
 One of my most profitable days in the past few weeks. Of course, the soybean market cooperated. Today was the kind of trading day that trader's dreams are made of. Very satisfying day!
I should have held this position, because the market continued upward, but I didn't. I had to re-enter again later.
Saturday, December 8, 2007
Friday 12-7 Soybean Trade #1
Friday 12-7 Soybean Trade #2

Almost picture perfect. Note how prices started to level off, and the Klinger indicators moved downward, leading into trade #3 below.
Friday 12-7 Soybean Trade #3

The only significant counter-trend move all day! Note at the end, however, how strongly the day's bullish trend renewed itself with vigor!
Friday 12-7 Soybean Trade #4

Nice trade. This is the kind that trader's dreams are made of. Friday's bullish soybean move is becoming a very good one!
Note in the subgraph with the Klinger indicator, that it formed a bearish divergence. When this happens, I tighten my stops to just under the lowest price of the preceding candle. That way, when momentum dissipates and reverses, I can maximize my profits.
Note that this same phenomenon occurs in trades #1 and #2 above as well. This is what makes the Klinger+ATR indicator such a powerful leading indicator!
Friday 12-7 Soybean Trade #5

I hated the waiting on this trade. It was just slightly profitable, so I wanted to wait and see if the market would continue upward, which it did. I set a stop at just above break-even, so I knew that at least I wouldn't lose money. Fortunately, prices moved upward again, so I made a little more profit on this one. I should have kept Rule #1, however, and exited earlier. I was just plain lucky. I think I came to within just 1-2 ticks of my break-even stop being hit on this one.
Thursday 12-6 Soybeans Trade
Only one trade today. Market was a bit scattered, difficult to find momentum, and difficult to trade. 

Wednesday Trading
Wednesday was an average trading day. It was average in the sense that I have various trades, but nothing spectacular. It was NOT average in the sense that I took 8 trades. This is quite high; 4-6 trades are more typical. Pictured in the next few posts are the various trades I took. I haven't taken the time to mark entry and exit points due to lack of time. Tradestation does this for me, but I have to turn that feature off. I have turned it off for two reasons: 1) it makes the charts for difficult to see when its on, and 2) I tend to get too caught up in the profits/losses rather than concentrating on the indicators and prices (ie., they are a distraction). When I do that, emotions take over. It is easier to control my emotions when I turn that feature off.
For entry, I require the Klinger indicator to be moving in the same direction as prices, and it must also be above the trigger line (yellow) for a long position, and below the trigger line for a short position. Also, prices must have just crossed the EMA and at least one more MA (either the Hull MA or Guassian).
Due to the difficulties of blogging, I must post the trades in the opposite order from the way I placed them. It is difficult to do it this way, because it is counter-intuitive. I must post all the trades in reverse order so that when the blog is posted, they appear to the reader in proper sequential order.


Wednesday Soybeans Trade #3

Blogging is taking an enormous amount of time. I enjoy it, but it takes far more time than I expected. Here is trade #3.
Wednesday Soybeans Trade #4 and #5

I exited at the dip half way through the chart, then re-entered when prices rose above the EMA again. I hate these types of trades, because I will often go short and then lose money. In this case, I didn't go short. Following a significant movement in one direction or another, I won't take the reversal signs, especially if the MACD indicator hasn't changed direction, or if prices are still trending in the chart of the next higher timeframe (3 minute, 15 minute).
Wednesday Soybeans Trade #6

A real nail-biter because I could tell that prices were still moving up, but losing momentum. I exited when prices closed below the Bollinger MA and then confirmed with lower prices.
Wednesday Soybeans Trade #7

Another nail-biter. I almost always require prices to cross over the Bollinger MA, which is just a 20-period Simple Moving Average.
Wednesday Soybeans Trade #8

This last trade occurred in the closing minutes of the trading day. The grains futures close at 12:15 MST each day. Oftentimes, the best trading occurs in the closing minutes, when futures traders are liquidating the positions they have established earlier. This often causes volatility that is profitable and moves strongly in one direction. Using tick charts helps in this respect, because it shows strong shifts in market sentiments very quickly; tick charts are highly responsive to market sentiment.
Recently, I have been trying a new technique that relates to how many contracts I trade and getting in and out of them. Phantom's Rule #1 requires that I be adding and removing contracts constantly. However, oftentimes, I will find that at key inflection points at a market reversal, I would normally exit all my positions when the tick chart shows signs of reversal. However, often before than time, I will see leading signs that a reversal may come soon. My new technique is that when I see these leading signs, I tighten my stops on PART of my overall position. I exit very quickly on these contracts, usually about half of my total position. Then, I will hold the rest of my positions with the expectation that the new trend will return and prices will continue in the original direction.
By exiting half of my positions with a profit, I am locking in some profits. Then, I can afford to allow my remaining positions to ride out the market noise. This gives me a cushion, so that even if the remaining position goes negative temporarily, I have enough of a profit cushion from the half that I exited so that I can afford to take a slightly higher risk on the ones I kept open. I will expand on this idea in future blog entries.
Friday, December 7, 2007
Agricultural real estate ETF
Does anyone know of an ETF for agricultural real estate? There is, and will continue to be, a bull market in rural real estate for the foreseeable future. No bubble there!
Soybeans bullishness reasserts itself
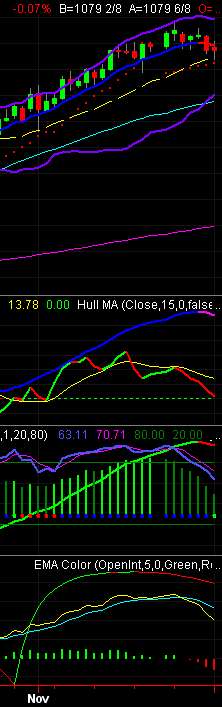
 Soybeans have been rising steadily for the past few days. The bullish trend in soybeans has reasserted itself strongly, and prices have risen to new highs ($11.22 today). Note in the graphic that the Klinger+ATR volume indicator (green and red in the bottom subgraph) has now turned bullish and has risen above the yellow trigger line, indicating a reassertion of the bullish trend in soybeans. It appears that prices in all the grains will continue to move up, notwithstanding the rally of the USD in recent days. The Fed better begin to worry about inflation again.
In the article below, you will see that the price of soybeans now appears to be linked to crude oil. With the resurgence of crude oil prices, both soybean and corn prices have exploded higher as well. The Bloomberg article suggests that prices may continue to rise unabated to at least $12/bushel, which will influence growers to plant more soybeans next spring.
I clipped this from Bloomberg:
Dec. 7 (Bloomberg) -- Chicago soybean futures rose to within 0.4 percent of a 34-year high and corn gained for a second day on speculation a rise in crude oil costs will buoy demand for the commodities to produce alternative fuels. Wheat also advanced.
Read the entire article here:
http://www.bloomberg.com/apps/news?pid=20601012&sid=aCAme1lIrwjM&refer=commodities
Agricultural Commodity ETFs
I watch and trade the following ETFs, all tied to agricultural commodities. Anyone who is interested in profiting from the bullish trend in grains and softs may want to consider some of these. The first 3 letters on each line are the ticker symbols on the various U.S. exchanges. (Yes, MOO and COW really are their ticker symbols.) I have linked each one to the home page where you can obtain further information from the provider. They all include different baskets of commodities, so make sure that you do your research:
DBA Proshares Agriculture
JJG iPath DJ AIG Grains Total Return Sub Index
COW iPath DJ AIG Livestock Total Return Sub Index
MOO Market Vectors Agribusiness
JJA iPath® Dow Jones-AIG Agriculture Total Return
In addition to the above ETFs, which are traded on the American exchanges, there are group of superb ETFs traded on the London Stock Exchange. Unlike the American ones that I have listed above, each of these ETFs are linked to a single commodity. If the time comes that the world's various exchanges are linked together and I can trade them all, I will probably change from the above ETFs to these. They are provided by a company called ETF Securities in London. Their website is:
http://www.etfsecurities.com/
AIGA Agriculture ETF
COFF Coffee ETF
CORN Corn ETF
COTN Cotton ETF
AIGG Grains ETF
HOGS Lean Hogs ETF
CATL Live Cattle ETF
AIGL Livestock ETF
AIGS Softs ETF
SOYO Soybean Oil ETF
SOYB Soybeans ETF
SUGA Sugar ETF
WEAT Wheat ETF
Wouldn't it be nice if the American ETF provider companies would follow suit and give us similar choices? Then, I could trade commodities in my IRA account just as I do in my futures accounts. Note, however, that these LSE-traded ETFs are sometimes small and liquidity is not very good -- YET. I suspect that over time, liquidity will improve.
Wednesday, December 5, 2007
Foreign vs. domestic stock ETFs
 TIP: To view these charts in better detail, you may want to open them in another window. The above charts were saved in a single jpg file.
Note that in the above three charts, representing some of the most liquid and commonly-traded International stock ETF's, the chart patterns are nearly identical. If I didn't label them on my charts, I could hardly tell the difference. These charts are of very diverse areas of the world: Emerging markets, Europe, Australasia, China. If I posted the U.S. stock ETF charts (SPY, DIA, QQQ, UWM, etc.), they would appear nearly identical.
The point of this post is simply that trading a multiplicity of stock ETFs from around the world is really quite useless, because all appear similar and move nearly in lockstep with each other. Stocks around the world tend to trade in very mirror-like patterns, with relatively small differences. I have noticed this pattern perpetuate itself time and again, and I finally realized that trading stocks, whether in Japan, Germany, Hong Kong, or New York, is still still trading stocks.
I suggest trading the largest and most liquid stock index ETFs, so you can enter and exit positions with good fills, tight spreads, and minimal slippage. Whether those ETFs are U.S., European, or Asian ones is largely irrelevant. However, U.S. financial markets are among -- if not THE -- most liquid in the world, so I prefer to use them. If I were living in another part of the world, I might trade using their indexes. However, this would only be because of the time zone and the need to trade at an hour when those markets have the greatest liquidity.
One caveat: I trade ONLY ETF's -- no individual stocks -- and they are all based upon indexes for those parts of the world.
Tuesday, December 4, 2007
Trading - prices don't ONLY move up and down
 We often assume, as traders, that prices only move in two directions. That's not true. While it is self-evident that prices can move up and down, there is a third direction that prices can advance -- sideways. When we take a position in the futures markets, we assume that it will move UP or DOWN, depending upon whether we go long or short. However, statistically, prices are more likely to spend most of their time progressing in a mostly stagnant, or consolidating pattern.
This is one of the factors that makes trading so difficult, because if prices are consolidating, as soon as they appear to take off in one direction, eliciting a long or short position, prices then reverse in the opposing direction. This is one of the reasons for having Rule #1 from Phantom's Gift:
Assume it is a bad trade until proven correct! Positions established must be reduced and removed until or unless the market proves the position correct.
I never maintain a position for more than a few minutes unless it become profitable almost immediately. It is not worth the stress and nail-biting! And as Phantom also mentions in his book, my judgment is better after I exit a position; my thinking becomes much more clear, and my perspective improves, because the emotion of the trade dissipates.
Feeling stress as a trader is one of the ways that we know we have made a bad trade. This stress is one of the body's warning signs of trouble. Time to exit quick when the stress level rises.
Quotes: Gold (the only real money) vs. fiat money

"Bulls of 1929 - like their 1990s counterparts - had their eyes glued on improving profits and stock valuations. Not a thought was given to the fact that the rising tide of money deluging the stock market came from financial leverage and not from savings."
- Dr. Kurt Richebacher
"...resources have been misallocated because of the cheapness of credit in both stock and credit markets. So, you're not going to solve the problem by making money cheaper again."
- Al Friedberg, Welling@Weeden, March 23, 2001
"Every mania in financial history has been liquidity driven. You can go back to the South Sea Bubble or tulips in Holland. As long as the money is coming in, everything is fine. "
- Raymond DeVoe, Dec. 11, 1995
"The length and severity of depressions depend partly on the magnitude of the 'real' maladjustments, which developed during the preceding boom and partly on the aggravating monetary and credit conditions."
- Gotfried Haberler, Prosperity and Depression, 1937
"The aggressive mindset of the world's economic powerhouse may need to be replaced with the humility appropriate for the world's biggest debtor nation."
- Berry Riley, Financial Times, April 2001
"Although the gold standard could hardly be portrayed as having produced a period of price tranquility, it was the case that the price level in 1929 was not much different, on net, from what it had been in 1800. But, in the two decades following the abandonment of the gold standard in 1933, the consumer price index in the United States nearly doubled. And, in the four decades after that, prices quintupled. Monetary policy, unleashed from the constraint of domestic gold convertibility, had allowed a persistent overissuance of money. As recently as a decade ago, central bankers, having witnessed more than a half-century of chronic inflation, appeared to confirm that a fiat currency was inherently subject to excess.
"Fortunately, nearly all of our public and private debt is denominated in U.S. dollars and we claim one-third of the world’s gold supply. And, we are the only super-power and have the largest economy in the world. In short, if we declare a new monetary regime disciplined by gold, the world has to accept it.
"In summary, because of the unique position of the U.S., perhaps running the printing presses to destroy excess financial claims through monetary inflation and then creating a new gold based monetary regime might be the most beneficial course of action for the interests of the U.S.
"But, again, unless they had just taken a vow of poverty, it would be unsettling to the owners of financial assets.
"As in the past, do we still hold the value of the U.S. dollar sacred?"
Remarks by Chairman Alan Greenspan Before the Economic Club of New York, New York City, December 19, 2002
“There is no subtler, no surer means of overturning the existing basis of society than to debauch the currency. The process engages all the hidden forces of economic law on the side of destruction, and does it in a manner which not one man in a million is able to diagnose.”
--John Maynard Keynes
“The plot is easy to read. The Fed has read it all along. The plot is as follows – American consumers MUST AT ALL COSTS CONTINUE TO CONSUME.”
– Richard Russell, April 16, 2003
“We have reached the point where there is no turning off the Credit excess, no turning off the GSEs, no turning off the Mortgage Finance Bubble, no turning off the destabilizing world of derivative trading, and no turning off the rampant financial speculation and its increasingly destabilizing effects. It is truly one massive Bubble running out of control. And let’s not ignore the reality that these frightening financial convulsions are symptomatic of an extremely sick system. One of these days there will be a life-threatening seizure. What we have here is an historic circumstance of a dysfunctional monetary regime and a central bank that will defend it at all costs." -Doug Noland
“By increasing the number of U.S. dollars in circulation, or even by credibly threatening to do so, the U.S. government can also reduce the value of a dollar in terms of goods and services, which is equivalent to raising the prices in dollars of those goods and services. We conclude that, under a paper-money system, a determined government can always generate higher spending and hence positive inflation” “Deflation: Making Sure ‘It’ Doesn't Happen Here,” Remarks by Governor Ben S. Bernanke before the National Economists Club, Washington, D.C., November 21, 2002
"…the U.S. is heading for maybe the greatest financial mess in world history. The U.S. is far too extended financially, militarily and socially in the way of entitlements that we can't afford." Richard Russell, Quoted by Mark Hulbert, “Russell Celebrates by Selling Bonds,” CBS Marketwatch, July18, 2003. Richard Russell, considered the dean of Investment Newsletters, publishes the Dow Theory Letters, the oldest and most successful investment newsletter in the world. His stock-market timing record is in first place on a risk-adjusted basis among all market-timing newsletters the Hulbert Financial Digest has tracked over the past 23 years.
"It was the case that the price level in 1929 was not much different, on net, from what it had been in 1800. But, in the two decades following the abandonment of the gold standard in 1933, the consumer price index in the United States nearly doubled. And, in the four decades after that, prices quintupled. Monetary policy, unleashed from the constraint of domestic gold convertibility, has allowed a persistent over issuance of money. As recently as a decade ago, central bankers, having witnessed more than a half-century of chronic inflation, appeared to confirm that a fiat currency was inherently subject to excess." – Fed Chairman Alan Greenspan Before the Economic Club of New York, New York City December 19, 2002 "Issues for Monetary Policy"
President Woodrow Wilson, who signed the Federal Reserve Act in 1913 was quoted just three years later as saying, “I have unwittingly ruined my country. The growth of the nation, and therefore all of our activities, are in the hands of a few men. We have come to be one of the worst ruled, one of the most completely controlled and dominated governments in the civilized world” (Quoted in “National Economy and the Banking System," Senate Documents Co. 3, No. 23, 76th Congress, 1st session, 1939.)
Wall Street spends so much of its intellectual and financial resources trying to figure out how to hedge every kind of risk it can imagine. But the one kind of risk that repeatedly brings down markets and the biggest and boldest players in those markets is liquidity risk. The only true hedge against liquidity risk would be to cut out man's greed gland. You can't hedge human nature. Michael Lewitt
“High inflation countries almost always have high money growth and low inflation countries have relatively low money growth.” Federal Reserve Chairman Ben Bernanke
George Bernard Shaw:
“You have to choose [as a voter] between trusting to the natural stability of gold and the natural stability of the honesty and intelligence of the members of the Government. And, with due respect for these gentlemen, I advise you, as long as the Capitalist system lasts, to vote for gold.”
Voltaire (1694-1778)
“Paper money eventually returns to its intrinsic value ---- zero.”
Daniel Webster, speech in the U.S. Senate, 1833
“We are in danger of being overwhelmed with irredeemable paper, mere paper, representing not gold nor silver; no sir, representing nothing but broken promises, bad faith, bankrupt corporations, cheated creditors and a ruined people.”
Thomas Jefferson to John Taylor, 1816
“I sincerely believe ... that banking establishments are more dangerous than standing armies, and that the principle of spending money to be paid by posterity under the name of funding is but swindling futurity on a large scale.”
Daniel Webster "Of all the contrivances for cheating the laboring classes of mankind, none has been more effective than that which deludes them with paper money."
St. Louis Federal Reserve Bank,
Review, Nov. 1975, p.22 "The decrease in purchasing power incurred by holders of money due to inflation imparts gains to the issuers of money--."++
Andrew Jackson, in his will, indicated that the epitaph on his gravestone was to read, "I killed the bank". He considered his cancellation of the 2nd National Bank to be his greatest accomplishment not only of his Presidency, but of his life!
Commodity prices supported by likely Fed rate cuts

The entire grain complex has seen higher prices today, largely supported by high probability of further Fed rate cuts. Gold has exploded higher by more than $17/oz from the London close yesterday. (see chart) Wow!
While I personally don't care which direction the futures go, since I can trade in both directions without preference, I often wonder why our government continues to devalue our currency by creating more and more fiat money to prop up the financial markets and investment banks artificially.
Monday, December 3, 2007
Lower daily close for soybeans
Soybeans closed at a new lower daily close today (Dec 3 2007), but just barely. More significantly, perhaps, is that prices spent the entire day below the previous day's close, only rising to nearly reach Friday's closing price just in the closing minutes of today's trading session. Not only that, but soybean prices also reached a new low price (for the day) that was lower than the past few days. Prices haven't been this low since Nov. 20th. Note also that prices are getting quite close to a crossover of the Bollinger Moving Average (a 20-period Simple Moving Average).
Note in the 2nd subgraph that selling activity continues, as soybeans are being distributed. This Klinger+ATR indicator is a wonderful leading indicator for when big money is selling, even before prices themselves reverse.
I included the other subgraphs in this picture because I wanted to show that the Hull Moving Average (2nd subgraph, blue and magenta) has turned negative.
In the third subgraph, note that the Bollinger Squeeze indicator has turned from bright green to dark green, indicating a loss of volatility and momentum. Likewise, the Gaussian indicator (green and red in the same 3rd subgraph) has also turned down.
In the bottom subgraph, the MACD has also turned down! This is all in the daily chart. This is rather strong signaling of more bearish soybean activity to follow.
However:
The weekly chart is still bullish, although the Bollinger Squeeze indicator has just turned from bright green to dark green. I have not posted the weekly chart.
Chart Triptych

I use a chart triptych as recommended by one of my teacher/mentors. This one is recommended by Philippe Cahen in his fantastic book on his copyrighted trading methodology called, "Analyse Technique et Volatilite". Yes, it is written in French. I spent 8 weeks translating it into English so I could use it. He wrote an earlier version in English titled, "Dynamic Technical Analysis".
I use 3 time horizons on my screen (this constitute the triptych) at all times to give me context. I also check the daily charts each day, and often I look at other time intervals as well.
One of the reasons that I like this method of trading so much is that it truly is dynamic. Instead of using static settings and fixed lines, this method takes into account the dynamic, constantly-changing nature of the financial markets, including for dynamic support and resistance using Bollinger Bands and EMAs.
Another reason that I prefer this method is that it is entirely visual in nature. I must be very visually-oriented. I have modified and added other indicators to Cahen's method, but I have kept the triptych, which I consider to be a necessity.
Indicator settings
 Another post from Tradestation forums dated Nov 19th, 2007
Here are the indicators I use in my trading. I also use a 3 minute and 15 minute chart. On the 3 minute chart, I have also added the 15 minute EMA, and on the 15 minute, I have also added the 60 minute EMA. I added them so I can see the potential support and resistance that they provide.
One of the nice features I've noticed about soybeans is how smoothly the market moves, with relatively little market noise compared with some other instruments. I also like that there is often a very active trading market during the evening hours in my time zone. This chart, for example, is for TONIGHT. Note how active the market is this evening. This is NOT atypical.
Indicators usage explanation

This was a post I placed in the Tradestation forums on Nov 19th. It explains how I use some of my indicators.
Here is the 15 minute chart for soybeans today, beginning at the dotted line from 7:30 pm EST last night. Soybean futures are my favorite instrument to trade because it has more volatility than wheat or corn, but moves slowly enough for me to be able to get in an out with good executions, combined with strong liquidity (soybeans are the USA's second largest grain crop - corn is #1). I include this chart to show how nicely the 8 period EMA works as dynamic support and resistance. Don't ask me why, but it does. (In his Encyclopedia of indicators, Rober Colby says that EMAs tested better than any other indicator he has tested; he also mentions an interesting phenomenon of EMAs is that they change direction ONLY on the candle in which prices close on the opposite side of the EMA. Note this phenomemon occurs in the price graph of my chart, changing between red and blue in the 30 tick chart of my prior post. It makes it easy to see.)
Note also that the Klinger + ATR indicator tonight is suggesting a bullish reversal is very likely, especially since soybeans are in a long-term bullish trend since Oct 9. There appears to be strong buying activity, and I will wait until at least one of my MA's (Hull, Guassian, or EMA) before I buy. This leading signal is what makes Klinger so useful, I believe.
The pale yellow horizontal dashed line is the settlement price from the prior days' trading. With grains, there are daily lock limits, and I mark those with solid yellow lines. (Soybeans rarely reaches the lock limit price of 50 cents, but wheat and corn quite frequently hit their lock limits of 30 cents and 20 cents respectivly.) I mark them every day, however, so I don't take a trade right before lock limit is reached. I also change the color daily, so I don't mistake a prior days' line that was above or below my visible range on the chart for today's lock limits.
I also use MA's to help me gauge when the reversal of trend is occuring, and the MACD to confirm that one is under way (bottom subgraph). Klinger is a wonderful leading indicator of a change in accumulation/distribution, but I use the MA's to help me time when this is happening. The Hull MA is located in the 2nd subgraph (blue for UP, magenta for DOWN), and the Gaussian is located in the 3rd subgraph (green for UP, red for DOWN).
I also use the Bollinger Squeeze indicator to help me know when a loss of momentum is under way and continued add-ons or new trades would be inadvisable.
I have tried my hand at trying to program a strategy, but after spending months at it, I finally realized my programming skills were simply not up to the task. Still, this method is working well for me. Just don't ask if I have automated it; the answer is "no".
Anyway, this is my contribution thus far, in the spirit of sharing. Any suggestions or additional ideas (or questions) are welcome. However, since I am trading every day, I don't spend much time in these forums. Regards to all my fellow traders.
One last observation - quite important and interesting, too:
Note in the second and third subgraphs that when the MAs cross below the other indicators, this moment quite consistently represents the nadir/apex of the trade. It is usually the best point to exit. I like BOTH the Hull MA and Guassian to cross over the other indicators (Klinger in the 2nd subgraph, and slow stochastic in the 3rd subgraph) at nearly the same time, which they do almost perfectly in this example. They often cross on precisely the same candle. If they don't cross nearly simultaneously, I question the signal. You can see this phenomenon in both of the charts I've posted tonight (the 30 tick chart, and the 15 min. chart). I believe this occurs with such consistency, at least partly because stochastic and Klinger (with my settings) are very sensitive and leading in nature, while MAs are lagging by nature.
Subscribe to:
Posts (Atom)


