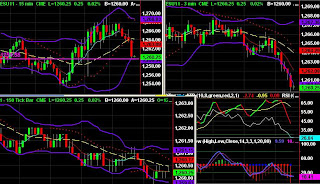
This chart shows a chart pattern that uses Japanese Candlesticks. These "smart" little time interval depictions can provide very helpful information regarding the direction of the markets. There are various websites across the Internet that provide very good instruction on the use of candlesticks as indicators.

This chart shows one known as a bullish engulfing pattern. When a candle reverses such that the body of the new candle completely encompasses the price range of the previous candle that was moving in the opposite direction, then it is considered to be a sign of a reversal. In this chart, the long green maribozu candle at the right of the encircled area has a price range that completely encompasses the prior red candle. If the new candle "engulfs" more than the previous candle, then the force and validity of that reversal is enhanced. In this case, the green candle engulfs not only the previous red candle, but the previous
seven red candles. The resulting bullish reversal is proof of the power of this pattern.
The engulfing pattern is a very strong sign of a significant reversal in the opposite direction. Often, a candlestick pattern on one time frame (this one is 3 minutes) will be matched with another candlestick pattern on another time frame (perhaps a 15 minute chart), thus reinforcing the reversal sign. Traders would be wise to learn and use candlestick patterns, because they are a powerful tool in the arsenal for recognizing short-term market sentiment, especially reversals. They can help us make more money by identifying early reversals, and they can save us money by protecting us from reversals against our positions.
I printed various japanese candletick patterns from various websites and put them in a binder, which I study regularly to sharpen my acuity to recognition of these patterns.
 When I see this candlestick pattern (see description next paragraph), I take it as a reading of market sentiment. The S&P 500 is now back to flat for the day. The Dow is lagging behind and is still positive; since the Dow was up much higher in percentage terms, this is not surprising.


