Friday, March 18, 2011

Day Higher, But Downtrend Dominates

Oil Price Threatens Economy

by Robert Zubrin from Washington Times:

In recent days, oil prices have climbed above $100 per barrel. As chaos spreads through the Arab world, we could soon see much worse.

According to recent testimony given to Congress by Federal Reserve Chairman Ben S. Bernanke, the current soaring oil prices are no reason for concern. According to the stock market, which has dropped hundreds of points each time oil prices have edged up another dollar or two, the situation is a five-alarm emergency. Who is right?
The likely impact of a new oil-price rise is shown in the graph below, which compares oil prices (adjusted for inflation to 2010 dollars) to the U.S. unemployment rate from 1970 to the present. It can be seen that every oil-price increase for the past four decades, including those in 1973, 1979, 1991, 2001 and 2008, was followed shortly afterward by a sharp rise in American unemployment.
The distress to American workers caused by such events is manifest, but the economic damage goes far beyond the impact on the unemployed. A sustained oil price of $100 per barrel will add $520 billion to the U.S. balance-of-trade deficit. Furthermore, there is a direct and well-established relationship between unemployment rates and the rates of mortgage defaults. Thus, the $130-per-barrel oil shock of 2008 didn't just throw 5 million Americans out of work, it made many of them default on their home payments and thus destroyed the value of the mortgage-backed securities held by America's banks. This, in turn, threatened a general collapse of the financial system, with a bailout bill for $800 billion sent to the taxpayers as a result. But that is not all. The destruction of spending power of the unemployed and the draining of funds from everyone else to meet the direct and indirect costs of high oil prices reduce consumer demand for products of every type, thereby wrecking retail sales and the industries that depend upon them.
Indeed, the world today is already in deep recession. Yet as a result of the systematic constriction of oil production by the Organization of Petroleum Exporting Countries (OPEC), which is limiting its production rate to 1973 levels of 30 million barrels per day, petroleum prices stand at more than four times what they were in 2003. This has imposed a tax increase on our economy of $500 billion per year, equal in economic burden to a 20 percent increase in income taxes, except that instead of the cash going to Uncle Sam, it will go to Uncle Saud and his lesser brethren.
These governments, however, are said to be our "friends." As current events in the Middle East should make clear, there is every chance that someday - perhaps soon - we could wake up and find that the world's oil is under new management, even less concerned with our well-being than the gang in charge today.
This is a fundamental threat to the American economy. We need to take action to protect ourselves from it now, before it is too late. How can we do this?
From looking at the data in the graph, it is clear that "cap-and-trade" plans or alternative methods of carbon or fuel taxation are not the answer. Indeed, by increasing the cost of energy even beyond those imposed by OPEC, they will only make the economic situation worse.
The only way out of this mess is forcefully to expand production of liquid fuels from sources outside OPEC control, particularly our own. That means unleashing our own domestic oil supplies through expanded drilling and also opening our vehicle-fuel market in a serious way to alternative fuels, such as methanol, which can be made cheaply from coal, natural gas or biomass and used in flex-fuel cars.
It may be too late already to stop the crash that will follow the current oil price run-up, but we still have to get started without further delay. Otherwise, while the crash itself will bring down world fuel demand and thus oil prices for a while, they will just rise once more when the economy begins to recover and slam us right back down again. And again. And again.
The time for action is now.
Robert Zubrin is president of Pioneer Astronautics and author of "Energy Victory: Winning the War on Terror by Breaking Free of Oil" (Prometheus Books, 2007).

But Crude Bounces Back Above $103 Too!

Strong Bounce

Fed Admits It Has Intervened In Currency Markets


WASHINGTON (AP) -- The New York Federal Reserve Bank confirmed that it intervened in currency markets on Friday for the first time in more than a decade.
The disclosure came a day after the Group of Seven major industrialized nations pledged in a statement to join in a coordinated effort to weaken the Japanese yen. The yen has surged in the last week to post-war record levels following the Japanese earthquake and tsunami.
A spokesman at the New York Fed, which operates as the agent of the U.S. Treasury in currency operations, confirmed that it had intervened. The last time the U.S. government intervened in currency markets was the fall of 2000 when it sold dollars and bought euros to bolster the fledgling European currency.
The spokesman refused to provide any details on the amounts of the intervention or what currencies were involved.
A stronger yen threatened to deal another blow to the fragile Japanese economy by depressing the country's exports.
In morning trading in New York on Friday, a dollar was buying 81.30 yen, up from 79.05 yen late Thursday and moving off its postwar low of 76.32 yen hit on Wednesday. Before the earthquake struck, one dollar bought 83.02 yen.

Stocks Falling Faster Now

...but stocks are still higher for the day. I'll bet we see a bounce soon!

Treasury Secretary Geithner Declares Obama's Openness to Replacing Dollar

Is is any wonder that the Dollar is being destroyed!?

No Drop in Crude Follow-Through Either

There is either no credibility or other variables are providing support. Perhaps both!

But Why No Follow-Through?

This surprises me. This is not a good sign.

Back to Bullish

If stocks close near these highs, the market will be bullish again starting next week. It should be an interesting day.

Gaddafi Declares Ceasefire; Stocks Leap, Oil Plunges

Stocks


Crude Oil

Thursday, March 17, 2011

What Does $1 Trillion Look Like?

All this talk about "stimulus packages" and "bailouts"...
A billion dollars...

A hundred billion dollars...
Eight hundred billion dollars...
One TRILLION dollars...
What does that look like? I mean, these various numbers are tossed around like so many doggie treats, so I thought I'd take Google Sketchup out for a test drive and try to get a sense of what exactly a trillion dollars looks like.
We'll start with a $100 dollar bill. Currently the largest U.S. denomination in general circulation. Most everyone has seen them, slighty fewer have owned them. Guaranteed to make friends wherever they go.
$100
A packet of one hundred $100 bills is less than 1/2" thick and contains $10,000. Fits in your pocket easily and is more than enough for week or two of shamefully decadent fun.
$10,000
Believe it or not, this next little pile is $1 million dollars (100 packets of $10,000). You could stuff that into a grocery bag and walk around with it.
$1,000,000 (one million dollars)
While a measly $1 million looked a little unimpressive, $100 million is a little more respectable. It fits neatly on a standard pallet...
$100,000,000 (one hundred million dollars)
And $1 BILLION dollars... now we're really getting somewhere...
$1,000,000,000 (one billion dollars)
Next we'll look at ONE TRILLION dollars. This is that number we've been hearing so much about. What is a trillion dollars? Well, it's a million million. It's a thousand billion. It's a one followed by 12 zeros.
You ready for this?
It's pretty surprising.
Go ahead...
Scroll down...
Ladies and gentlemen... I give you $1 trillion dollars...
$1,000,000,000,000 (one trillion dollars)
Notice those pallets are double stacked.
...and remember those are $100 bills.
So the next time you hear someone toss around the phrase "trillion dollars"... that's what they're talking about.

That covers an area about the size of a football field. 

Cost of Living in U.S. Reaches New All-Time Record

from CNBC:

One would think that after the worst financial crisis since the Great Depression, Americans could at least catch a break for a while with deflationary forces keeping the cost of living relatively low. That’s not the case.

A special index created by the Labor Department to measure the actual cost of living for Americans hit a record high in February, according to data released Thursday, surpassing the old high in July 2008. The Chained Consumer Price Index, released along with the more widely-watched CPI, increased 0.5 percent to 127.4, from 126.8 in January. In July 2008, just as the housing crisis was tightening its grip, the Chained Consumer Price Index hit its previous record of 126.9.
“The Federal Reserve continues to focus on the rate of change in inflation,” said Peter Bookvar, equity strategist at Miller Tabak. “Sure, it’s moving at a slower pace, but the absolute cost of living is now back at a record high in a country that has seven million less jobs.”
The regular CPI, which has already been at a record for a while, increased 0.5 percent, the fastest pace in 1-1/2 years. However, the Fed’s preferred measure, CPI excluding food and energy, increased by just 0.2 percent.
“This speaks to the need for the Fed to include food and energy when they look at inflation rather than regard them as transient costs,” said Stephen Weiss of Short Hills Capital. “Perhaps the best way to look at this is to calculate a moving average over a certain period of time in order to smooth out the peaks and valleys.”

The so-called core CPI is used by the central bank because food and energy prices throughout history have proven to be volatile. However, one glance over the last two years at a chart of wheat or corn shows they’ve gone in one direction: up. And many traders say Fed Chairman Bernanke’s misplaced easy money policies are to blame.
Over time, the Bureau of Labor Statistics has made changes to the regular CPI that it feels make it a better measure of inflation and closer to a cost of living index. It improved the way it averages out prices for items in the same category (e.g., apples) and also uses the often-criticized method of hedonic regression (if you're curious, you can learn more about that here) to account for increases in product quality.
In 2002, the BLS created this often-overlooked cost of living index in order to account for the kinds of substitutions consumers make when times are tough. It is supposed to be even closer to an actual “cost of living” measure than the regular CPI.

“For example, pork and beef are two separate CPI item categories,” according to the BLS web site. “If the price of pork increases while the price of beef does not, consumers might shift away from pork to beef. The C-CPI-U (Chain Consumer Price Index) is designed to account for this type of consumer substitution between CPI item categories. In this example, the C-CPI-U would rise, but not by as much as an index that was based on fixed purchase patterns.”
“As the cost of living increases, we are headed toward a bigger problem with the slowing of housing permits,” said JJ Kinahan, chief derivatives strategist at thinkorswim, a division of TD Ameritrade. “As the staples start to cost more, this could lead to a quick slowdown in the auto and technology sectors as an iPad is an easy thing to pass on if you are paying more for your gas and food and need to cut back somewhere.”
To be sure, it’s nearly impossible to get a perfect “cost of living” measure, and the BLS acknowledges this on their web site: “An unconditional cost-of-living index would go further, and take into account changes in non-market factors, such as the environment, crime, and education.”
Still, states will be cutting back services drastically this year at the very same time they are raising taxes in order to close enormous budget deficits and avoid a muni-bond defaults crisis. So while it may be the missing link to a perfect cost of living measure, one can assume that Americans will be paying more for unquantifiable services such as police enforcement and education, but getting them at a lesser quality.
Bottom line: The cost of living for Americans is now above where it was when housing prices were in a bubble, stock prices at a record, unemployment low and consumer confidence was soaring. Something has gotta give.

Stocks Finish Up Sharply Despite Crude Oil's Concomittant Rise

Corn Limit Up, Other Commodities Rebound Powerfully

Crude Oil Skyrockets $5 to the Doorstep of $102

The Yen Carry Trade if Over, But It's Destroying the Dollar

Yen


Dollar

Wednesday, March 16, 2011

Torrential Day: Stocks Again Lose Their Grip

After 300-Point Drop, Stocks Battle Back

Then Sinks Still Further

Fed Reschedules POMO, Stocks Bottom

Bond Bazaar or Bond Bizarre?

Housing Starts Drop

They rose last month, but that was mostly a seasonal improvement.


WASHINGTON (Reuters) - Housing starts posted their biggest decline in 27 years in February while building permits dropped to their lowest level on record, suggesting the beleaguered real estate sector has yet to rebound from its deepest slump in modern history.
Groundbreaking on new construction dropped 22.5 percent last month to an annual rate of 479,000 units, according to Commerce Department data released on Wednesday. This was just above a record low set in April 2009 and way below the estimates of economists, who had been looking for a smaller drop to 570,000.

Look Out Below!

What a bizarre news day!

Food Inflation Leaps Most In 36 Years!

WASHINGTON (AP) -- Wholesale prices jumped last month by the most in nearly two years due to higher energy costs and the steepest rise in food prices in 36 years. Excluding those volatile categories, inflation was tame.
The Labor Department said Wednesday that the Producer Price Index rose a seasonally adjusted 1.6 percent in February -- double the 0.8 percent rise in the previous month. Outside of food and energy costs, the core index ticked up 0.2 percent, less than January's 0.5 percent rise.
Food prices soared 3.9 percent last month, the biggest gain since November 1974. Most of that increase was due to a sharp rise in vegetable costs, which increased nearly 50 percent. That was the most in almost a year. Meat and dairy products also rose.
Energy prices rose 3.3 percent last month, led by a 3.7 percent increase in gasoline costs.
Separately, the Commerce Department said home construction plunged to a seasonally adjusted 479,000 homes last month, down 22.5 percent from the previous month. It was lowest level since April 2009, and the second-lowest on records dating back more than a half-century.
The building pace is far below the 1.2 million units a year that economists consider healthy.
There was little sign of inflationary pressures outside of food and energy. Core prices have increased 1.8 percent in the past 12 months.
Still consumers are paying more for the basic necessities.
Gas prices spiked in February and are even higher now. The national average price was $3.56 a gallon Tuesday, up 43 cents, or 13.7 percent, from a month earlier, according to the AAA's Daily Fuel Gauge. Rising demand for oil in fast-growing emerging economies such as China and India has pushed up prices in recent months. Turmoil in Libya, Egypt and other Middle Eastern countries has also sent prices higher.
But economists expect the earthquake in Japan to lower oil prices for the next month or two, which should temper increases in wholesale prices in coming months. Japan is a big oil consumer, and its economy will suffer in the aftermath of the quake. But as the country begins to rebuild later this year, the cost of oil and other raw materials, such as steel and cement, could rise.
Oil prices fell sharply Tuesday as fears about Japan's nuclear crisis intensified. Oil dropped $4.01, or 4 percent, to settle at $97.18 per barrel on the New York Mercantile Exchange.
Food costs, meanwhile, are rising. Bad weather in the past year has damaged crops in Australia, Russia, and South America. Demand for corn for ethanol use has also contributed to the increase.
Prices rose 1 percent for apparel, the most in 21 years. Costs also increased for cars, jewelry, and consumer plastics.

Fed Cancels POMO, Causes Flash Crash, Stocks Continue Slide

Tuesday, March 15, 2011

Speaking of Valuations: Pricey Markets Mean Poor Returns


As discussed in previous posts, the benefit of a normalized P/E ratio (and a historical perspective) is that it gives us cues on whether the current price of the market is cheap or expensive and thus whether future returns will be high or low.
The S&P 500 Normalized P/E ratio as calculated by Robert Shiller stands at 23.3. Ed Easterling's work produces similarly elevated valuation levels. Not only is this well above the long-term average, but it is consistent with very disappointing long-term expected returns.


UPDATE: I was wisely encouraged to consider TOTAL returns, with dividends re-invested
But just how disappointing are returns likely to be? I spent a few hours on Friday afternoon geeking out in excel. I found that when the cyclically adjusted P/E ratio is between 22 and 24 (as it is now) the average annual real returns (after inflation) for the subsequent 10 years is -2.2%! And as usual, the average doesn't quite tell the whole story. In the 66 month ends since 1881 when the P/E was between 22 and 24 the distribution of subsequent returns looks like this:


The median total return is -3.1% real. It seems exceedingly likely to me that long-term returns for the stock market from here will be negative. I don't think most investors are prepared for these sort of outcomes over the next decade.

For those who care to see their returns nominally, the average is +1.2% annual returns and the distributions are as follows:


Several successful investors use the same concepts to drive actual estimates of future market returns.

John Hussman, PhD uses this methodology to help drive decision making with his mutual funds. His recent work produces estimated NOMINAL returns over the next 10 years of 3.1% annualized which may be close to zero real returns depending on inflation.


Using a 5 year time frame, the "probable outcomes" are even worse, with 0% projected nominal returns.


GMO does similar work with additional emphasis on where profit margins are relative to normal (and likely to revert towards) and does so across various asset classes and publishes their results monthly. These are also nominal returns and are certainly not high enough to warrant a buy and hold or long-only approach especially when one considers that this is just a range of estimates and the downside to low estimates is equally as likely as the upside.


The fact is that what you pay matters and expensive markets today mean low or even negative prospective returns going forward. The value restoration project, which began with the peak of the stock market in 2000, is ongoing despite a 2 year cyclical rebound on the heels of unprecedented stimulus.


Read the Sitka Pacific Annual Review for more on the multitude of challenges facing investors.

Of course, in the short term the market can get more expensive. Those calling for negative returns in 1997 or 1998 based on this sort of methodology were certainly frustrated over the course of the next 2 years as the market when from merely expensive to insanely bubblicious. My colleague Mish had a nice post looking at the returns over various time periods when you start with expensive markets. In the first year the returns ranged from -30% to +33%.
UPDATE: Hussman cites Mish's work in his latest Weekly Commentary.
I believe this are nominal returns which means that all of those single digit 10 year returns starting in the late 60s were certainly negative after the effects of inflation. 
Secular bear markets ALWAYS have powerful rallies which has nothing to do with the fact that bear markets NEVER end until the market is "not just interesting, but rather commandingly, and compellingly cheap." I don't portend to have a crystal ball, but it seems to me that our powerful bear market rally is getting rather long in the tooth.


Disclaimer:The content on this site is provided as general information only and should not be taken as investment advice. All site content, including advertisements, shall not be construed as a recommendation to buy or sell any security or financial instrument, or to participate in any particular trading or investment strategy. The ideas expressed on this site are solely the opinions of the author(s) and do not necessarily represent the opinions of sponsors or firms affiliated with the author(s). The author may or may not have a position in any company or advertiser referenced above. Any action that you take as a result of information, analysis, or advertisement on this site is ultimately your responsibility. Consult your investment adviser before making any investment decisions.

John Hussman: Anatomy of a Bubble

Great analysis by John Hussman. No one is better!

Over the past decade, investors have seen near-parabolic advances in a variety of assets, followed by crashes. These have included dot-com stocks (which peaked and crashed well before the general market peak in 2000), technology stocks, housing, commodities, and stocks in a variety of emerging markets. These experiences have made investors somewhat more attuned to the destructive potential for speculative bubbles in various assets, but has also created something of a "casino economy" where a great deal of resources are directed in hopes of participating in these bubbles.
What exactly is a "bubble?" Informally, we can think of a bubble as an advance in an asset's price to levels that are "detached from fundamentals" - essentially, the primary motive for investing ceases to be the expectation of future cash flows or consumption, and instead centers on the expectation of further increases in price. From this perspective, a bubble emerges at the point where a continual increase in the ratio of prices to fundamentals is required in order for investors to achieve satisfactory returns.
Formally, a bubble can be defined as a "non-fundamental" component of price which grows exponentially. Think about stocks. Let "k" be the long-term return that investors expect stocks to achieve. If these expectations are correct, then next year's price Pt+1 will just be (1+k) times today's price Pt, minus whatever dividend Dt will be paid. The next year's price is determined the same way. If you write this out and solve the difference equation, you'll get a solution that looks like this: Pt = Vt + Bt, where Vt is just the discounted value of expected future dividends, and Bt is an arbitrary constant. It can be anything, so long as it obeys Bt+1 = (1+k)Bt.
Mathematically, Bt is a "bubble component" of prices. If that component Bt is not zero, the price will gradually "explode" away from any relationship with fundamentals. Moreover, the present discounted value of the future price will not tend toward zero no matter how far into the future you look. Ultimately, this sort of price path is ruled out by the fact that the value of stocks cannot grow infinitely larger than the economy, so bubbles ultimately crash. But over the short-run, there is little to prevent investors from putting a little bit of "B" into prices from time to time. This becomes pathological when the sustained price gains expected by investors diverge significantly from the growth rate of the overall economy.
In short, a bubble is an advance in prices that "substitutes" for fundamentals, in the sense that the realized return on the investment continues to be positive even after the asset is no longer priced to achieve satisfactory returns on the basis of expected future cash flows (or in the case of housing and commodities, future consumption value or other services).
The effect of valuation levels and valuation changes on S&P 500 total returns
When valuations are reasonable, investors can expect satisfactory long-term returns simply on the basis of the stream of cash flows they receive over time. But once valuations are elevated, investors become increasingly reliant on pure increases in prices and valuations in order to achieve satisfactory returns. This is easily seen in historical data for the S&P 500.
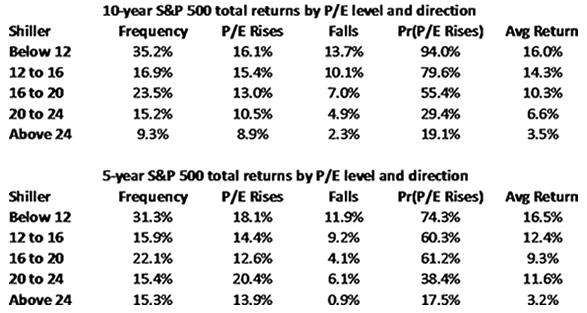
The chart below is based on post-war U.S. data, and illustrates the interaction between valuation levels and valuation changes in producing long-term total returns for the S&P 500, and expands on some of Mike Shedlock's recent observations on valuations and prospective returns. As I've frequently noted, Depression-era data is far more hostile than post-war data, as is data surrounding other historical and international credit crises, so investors would have needed more stringent valuation criteria in order to accept market risk during these periods. Still, post-war data is sufficient to convey some important ideas.
The first two columns below reflect the Shiller P/E (also known as the "cyclically adjusted" price/earnings ratio), and the frequency of various P/E ranges in historical data. The next two columns show the average annual total return of the S&P 500 Index, based on whether the Shiller P/E rose to a higher level during the 10- or 5-year horizon, or whether it fell to a lower level by the end of that horizon. The next column is the percentage of observations where the P/E was higher at the end of the horizon, and the last column is the weighted average return for each level of Shiller P/Es.
Notice that regardless of whether P/E ratios rose or fell during these investment periods, subsequent returns were substantially higher from low valuations than from high ones. Of course, subsequent returns were higher for horizons where the P/E increased than for those where the P/E fell. It is also important, though not surprising, that low initial valuations were associated with a far higher probability of rising valuations in the future. With low valuations, investors have enjoyed the prospect for high expected returns even if valuations contracted further, and also faced a high probability that a future increase in P/E multiples would add further to their returns. In contrast, high valuations have been associated with poor average returns, and a low probability of further increases in valuation multiples.
Since data is available for 5-year returns through 2006, but only through 2001 for 10-year returns, the two tables cover slightly different horizons since 1940. Notably, the frequency of Shiller P/Es greater than 24 is 15.3% in 5-year data but only 9.3% in 10-year data. This is because extreme valuations have been the norm in recent years (where the P/E has exceeded 24 over half the time, interrupted only briefly by the recent plunge and rebound).
Presently, the Shiller P/E stands at 24. Be careful how you interpret the data in the table for Shiller P/E's above 24, since these levels were almost never observed in data prior to the late-1990's market bubble. You can see the odd effect of the bubble on the P/E categories above 20. The recent tendency for high valuations to move even higher over the short-term, coupled with the rapid recovery of much of the 2008-2009 loss, creates a "hump" in the 5-year profile - average returns first decline as valuations increase, and then actually improve for the 20-24 bracket. This is an artifact of recent years, and appears neither in pre-1995 data nor in 10-year return data.
Indeed, outside of the bubble period since the late 1990's, the only historical instance of Shiller P/Es materially above 24 was between August and early-October of 1929. The closest we got to 24 in post-war data was in mid-1965. While prices went on to achieve moderately higher levels (lagging earnings growth, so that the Shiller multiple fell), the mid-1965 valuation peak is widely viewed as the starting point for a 17-year "secular" bear market during which the S&P 500 achieved total returns of less than 5% annually through 1982, despite severe inflation. That's a good reminder that stocks are not a very good inflation hedge during periods when inflation is rising, particularly when stock valuations are already elevated and are priced to achieve poor returns. Stocks only "benefit" from inflation during hyperinflations and during sustained and anticipated inflations. In other cases, the eventual adjustments in economic activity and valuations overwhelm the "beneficial" effect of inflation on earnings.
The implication of this data for long-term returns is clear. With the Shiller P/E presently at 24, we observe about the same implications for 10-year S&P 500 total returns as we obtain from our broader valuation methods (expected total returns averaging about 3.5% annually). Still, the actual course of total returns will depend on whether valuations become even more extended over the next 5-10 years, or if they contract instead. Even if one includes data from the late-1990's bubble, the probability of rising P/E multiples from these levels is less than 1-in-5.
Still, if one wishes to bet on a bubble, there is no reason set in stone that the market cannot achieve further gains. The question investors should ask, however, is whether confident prospects for a radiant economic future are likely to capture the imaginations of investors to anywhere near the extent that we observed during the late 1990's. The answer matters, because if we exclude the bubble period, the historical probability of rising P/E multiples from present levels effectively drops to zero - similar valuations were always followed by a contraction in multiples.
Long-term versus near-term
I want to emphasize that the arguments above relate to 5-year and 10-year horizons, and not how the market may perform over the next several months or quarters. Over shorter periods of time, the strength and uniformity of market internals conveys important information about the willingness of investors to accept risk. Even if we observe rich valuations, there can be some justification for accepting market risk during periods when market internals are uniformly strong, provided that the environment is not also characterized by a syndrome of overbought, overbullish and rising-interest rate conditions. Accordingly, if we can clear at least one component of that syndrome (most likely the overbought or overbullish aspect) without also provoking a broader deterioration in market internals, we'll have a reasonable window in which to accept a moderate exposure to market fluctuations. A correction to the lower-1100's on the S&P 500, without a material breakdown in broader market internals, would likely open that window.
Here and now, market conditions imply a negative average return/risk profile for stocks, but clearing some component of that syndrome (again, barring a broader breakdown in market internals) should shift the expected return profile to a modestly favorable average, allowing us to reduce the extent of our hedges. Of course, we're likely to retain a "line" of defense with index put options, to protect against any abrupt further declines or broad deterioration in market internals. But it's important to emphasize that despite our dour view of long-term return prospects, those views don't necessarily translate into an avoidance of moderate exposure to market fluctuations over the short- and intermediate-term. We're very mindful of risk here, but shareholders can also expect us to accept moderate, periodic exposure to market fluctuations more frequently, on the basis of the expanded set of Market Climates we introduced last year.
For now, we're defensive and tightly hedged (though we've reduced the number of our short call options in recent weeks in response to market weakness). That tight defensiveness may only persist for another week, possibly several weeks, but probably not months unless we observe a material breakdown in market internals. We'll take our evidence as it comes. In any event, our longer-term view of market prospects is quite restrained, and we remain concerned about latent economic risks, so even if we have constructive opportunities over the intermediate term, we expect to maintain a line of defense against more serious downside risks.
Classic bubbles - parabolic advances and log-periodic fluctuations
From our perspective, there is at least a small "bubble" component at play when markets advance over the short run, despite being priced to achieve poor returns in the long-run. In effect, investors in these markets are taking on speculative risk, in the expectation that other investors will be willing to pay even higher prices. Whatever one wishes to say about the rationality of investors during these periods, the historical evidence is that certain features of market action (particularly broad uniformity of market internals) is a useful metric of investors' willingness to speculate. As I've frequently noted, neither market action, nor trend-following measures, nor an easy Fed has been sufficient once the overvaluation is coupled with overbought, overbullish, rising-interest rate conditions. But even during post-credit crisis periods, some combinations of market conditions have warranted at least a moderate speculative exposure to market fluctuations despite rich valuations.
In the stock market, I believe that there is indeed a "bubble" component in current prices, but it is not nearly as large as we observed in the approach to the 2000 peak, nor as extreme as we observed on the approach to the 2007 peak. My hope is that investors have learned something. That's not entirely clear, but we'll be as flexible as we can while also being mindful of the risks.
While my view is that bubble components can come and go in the markets, they sometimes become so large and well-defined that they take on a very distinct profile. Such bubbles included the advance to the 2000 stock market peak, the housing bubble, the advance in oil prices to their peak in 2008, the advance in the Nikkei in the late 1980's, and other clearly parabolic advances.
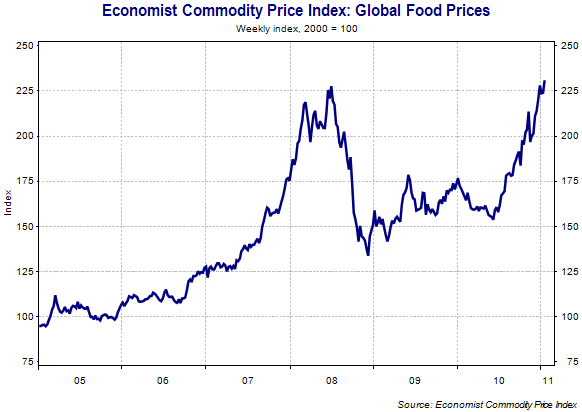
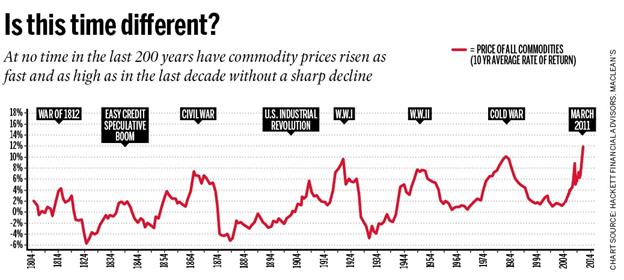
On that note, it's clear to me that we're seeing classic bubbles in a variety of commodities. It is very unlikely that this is simply due to global demand growth. Even with an exhaustible resource, it is a well-known economic result (Hotelling's rule) that the optimal extraction rule is one where the price rises at a rate not much different from the interest rate. What we've seen lately is commodity hoarding, predictably resulting from negative real interest rates provoked by the Fed's policy of quantitative easing.
http://financialinsights.files.wordpress.com/2011/03/commodity-chart1.jpg
Fortunately for the world's poor, the speculative dynamic that has created a massive surge in commodity prices appears very close to running its course, as we see very similar "microdynamics" in agricultural commodities as we saw with oil in 2008. That's not to say that we have a good idea of precisely how high prices will move over the short term. The blowoff phase of a bubble tends to be steep, but so short-lived that it affords little opportunity to exit. As prices advance in an uncorrected parabola, the one-sided nature of the speculation typically gives way to a frantic effort of speculators to exit simultaneously. Crashes are always a reflection of illiquidity in two-sided trading - the inability of sellers to find eager buyers at nearby prices.
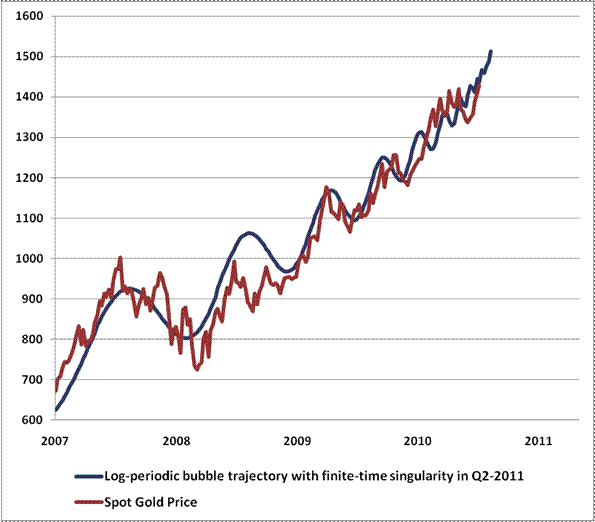
As physicist Didier Sornette has observed, major parabolic bubbles also tend to include shorter-term fluctuations that are increasingly "chaotic" - specifically, there is a tendency for price dynamics to include a "log-periodic" component (which essentially looks like a cosine wave fluctuating at increasing frequency), so that corrections become shallower and more frequent within the parabolic trend. Eventually, these periods culminate in what Sornette calls a "finite-time singularity," which is about the point where the market crashes.
In my view, it's somewhat ambitious to use these self-similar fluctuations as the basis to time the end of a bubble, but it's clear that weakly corrected parabolic advances do tend to be unsustainable, and often produce deep and abrupt losses. As I wrote in July 2008 just as oil was spiking to $150 a barrel and headed toward $40 (see The Outlook for Inflation and the Likelihood of $60 Oil ), "When you have to fit a sixth-order polynomial to capture price history because exponential growth is too conservative, you're probably close to a peak."
On the subject of commodities, it's a natural question whether gold falls into the same category as agricultural commodities. After all, gold and other hard assets have an important role as an alternative to money to store value, and it appears clear that the world is monetizing in a way that is unlikely to be fully reversed even if policy makers wish to do so down the road.
In my view, it's not clear that gold is in a bubble here, but it will be important to watch for the earmarks of a classic bubble. Below, I've plotted the price of gold against a "canonical" log-periodic bubble. Already, we're seeing some behavior that is characteristic of a bubble-type advance. A Sornette-type analysis generates a finite-time singularity as early as April, but there are other fits that are consistent with a more sustained advance. If we observe a virtually uncorrected advance toward about 1500 in the next several weeks, the steep and uncorrected advance would imply an increasing hazard probability.

Again, for my part, I think it's a bit ambitious to use log-periodic functions and other purely mathematical tools to identify bubbles and gauge crash hazards. We prefer more fundamental approaches. While I don't view gold stocks as overvalued relative to the metal (which gives us some margin of safety in the gold shares we own in Strategic Total Return), we have to view the rate and character of the advance in gold with some suspicion. If gold continues a parabolic advance toward 1500, the risk of a very sharp decline in precious metals would increase substantially, in my view. Classic bubbles tend to have a "signature" - parabolic advances with shallow and increasingly frequent corrections. Eventually, you begin to see price spikes at one-day, one-hour and even ten-minute intervals. That's a danger sign to monitor. Remember, if emerging markets stocks have taught investors one thing, it's that it's very possible for a long-term thesis to remain intact and yet have prices suffer significant declines over the intermediate-term.
Market Climate
As of last week, the Market Climate for stocks remained characterized by an overvalued, overbought, overbullish, rising-interest rate syndrome that has historically been associated with negative returns per unit of risk, on average. Both the Strategic Growth Fund and the Strategic International Equity Fund remain well hedged, though this will change in response to any clearing of this syndrome that does not also produce a significant breakdown in market internals.
In the Strategic Total Return Fund, yield pressures improved on a number of measures last week, and we responded by modestly increasing the duration of the Fund to about 3.5 years (meaning that a 100 basis point change in interest rates would affect the Fund by about 3.5% on the basis of bond price fluctuations). The Fund continues to hold about 8% of assets in precious metals shares, and we continue to view those shares as reasonably priced in relation to the metal itself. That said, the near-parabolic rise in gold prices is of some concern, as noted above, so we are comfortable with a modest but not aggressive exposure to this asset class.

Fed and China Can't Have it Both Ways

by Charles Hugh Smith of oftwominds.com blog


Sorry, Fed and People's Bank of China: You Can't Have It Both Ways   (March 15, 2011)


My thoughts are with those trying to contain the nuclear reactor crisis in Japan, and with their families, who are justifiably worried about the health consequences their loved ones risk as they work long hours in hazardous and difficult conditions.
You can't have it both ways, but that isn't stopping the Fed and the PBOC from continuing their doomed policies.
The Federal Reserve and the People's Bank of China are each trying to have it both ways: they want rapid growth in money supply, lending and the economy but no troublesome jumps in the price of essentials. Yet the rapid expansion of money supply and credit feeds volatile price increases and politically disruptive income inequality.
While the world watches and hopes the reactor containment structures in Japan hold, whatever the aftermath of this deepening nuclear crisis, we will be living in a world defined by the financial policies of the Federal Reserve and the People's Bank of China.
Frequent contributor Harun I. neatly summarized the problem with Fed Chairman Ben Bernanke's explanation for why the Fed's policies had nothing to do with skyrocketing global commodity prices:

What I find troubling about Bernanke these days is his overt dissembling. Before congress he says that the recovery, not money printing is causing a rather destabilizing spike in commodity prices. Looking for evidence in nominal price charts, there is none to be found. What he is trying to make us believe that from 1982 to 1998 (the great equity bull market) there was not enough demand to drive crude oil prices where they are today. Hmm. At any rate he can not have it both ways. He cannot claim that he needs to print money to spur "acceptable inflation" (which effectively raises prices) while claiming that money printing has nothing to do with rises prices.
Thank you, Harun.
The Fed is being disingenuous in claiming it is blameless for global inflation: the Fed's zero-interest rate policy and quantitative easing are both unleashing "hot money" that is seeking higher returns anywhere they can be found in the global economy.
In a larger sense, the Fed is attempting to repeal the business cycle. In the normal course of capitalism, low rates and easy credit lead to increased borrowing, which leads to rising consumption and investment in production to feed that increased consumption.
This leads to higher profits, which feed more investment and debt.
At some point, the cycle hits a brick wall: borrowers can't afford to pay more interest, so debt stops rising, and consumption and demand slump as borrowing levels off. In the rush to mint profits, production capacity exceeds demand, and as a result prices and profits both fall.
As the boom progressed, investors sought out riskier, more marginal investments. As new debt and demand fall, then these riskier investments lose money and are either shuttered or sold for a loss.
As profits decline, workers are laid off and commercial borrowers find their income streams aren't sufficient to meet their obligations. The credit cycle turns from expansion to contraction, as marginal borrowers go bankrupt and insolvent businesses and loans are liquidated or written down.
This purging of bad debt, speculative excess and misallocated resources sets the foundation for another cycle of renewed growth.
But the Fed has attempted to repeal the credit cycle. Rather than allow credit to fall sharply and interest rates to rise as bad debt is purged from the financial system, the Fed has pursued a policy of making credit even cheaper in the hopes that financial-sector borrowers will be able to borrow more since rates are near-zero.
But since consumers and enterprises are still burdened with mountains of existing debt, few are willing or qualified to borrow more. As I recently wrote here, consumer debt in the U.S. has declined a paltry 2.7% in the Great Recession.
The Fed's quantitative easing ends up flowing not to households or productive enterprises but to the “too big to fail” banks and Wall Street firms, which then seek higher returns in assets such as stocks and commodities.
The Fed's intention was to push money into productive enterprises, but instead it has fed pools of speculative money chasing high returns in global commodities. This is helping to fuel inflation in food and other commodities, not just in the U.S. but globally.
Now the Fed has backed itself into a corner: if it keeps interest rates low and continues pouring hundreds of billions of dollars into “hot money” hands, then it will adding to the destabilizing consequences of rising commodity inflation. If it stops its quantitative easing stimulus to help cool global inflation, it threatens to derail the stock market run-up. Without QE2 to hold down rates, interest rates will rise, pushing marginal borrowers out of the market and increasing borrowing costs for everyone from new home buyers to those buying new vehicles.
By attempting to repeal the business cycle and refusing to allow a necessary credit cleansing (writing off of bad debt) and repricing of risk, the Fed has created an inescapable double-bind for itself: either continue to pursue easy-money policies and help destabilize the global economy with rising commodity inflation, or allow interest rates to rise and destabilize speculative markets and marginal borrowers.
China is also trying to have it both ways. China's leadership is on the horns of a dilemma: if it continues pumping up rapid growth, it will inevitably feed inflation, while if it raises interest rates and curbs lending to limit inflation, that policy will restrain overall growth.
Though profits and gross domestic product (GDP) have been surging over the past decade as China's productivity improved, these gains have not trickled down to the workers' paychecks. According to the National Development and Reform Commission, incomes only kept pace with profits and GDP in three of China's 27 provinces.
In other words, the "rapid growth" is flowing only to the top tranch of China's households, while food and energy inflation's impact is felt mostly by lower-income wage earners. In effect, China's economy and political structure is creating a nation of Haves and Have-Nots. (Sound familiar? Just substitute "America" for "China" and the statement is equally true.)
Victor Shih, an Associate Professor of Political Science at Northwestern University, sees the government's tight control over yields on savings accounts and lending rates as a primary cause of rising inequality: as inflation accelerates, China's savers are losing money, as the return on savings is lower than the rate of inflation. Negative returns on savings act as a stealth tax on China's households and a subsidy to the government-owned banks.
The banks then turn around and loan money to politically connected real estate developers and government-owned enterprises at interest rates that are near zero in inflation-adjusted terms. "The Chinese financial system channels wealth from ordinary households to a small handful of connected insiders and state-owned firms," writes Shih.
Insiders and top managers take home substantial income in cash that goes unreported in regular channels—so-called "grey income." This is another source of wealth inequality: average workers don't receive these large cash payments, which are considered commissions and bonuses in China.
A Credit Suisse survey of urban households in China found $1.5 trillion in grey income unreported in the official household income numbers. About 60 percent of this grey income flowed to the top 10 % of households. According to Shih, while income of normal households rose 8%, the top 10% of households saw their income leap by 25%
The net result of these structural imbalances, in Shih's view, is a China that is "increasingly splitting into a small upper class that spends freely on luxury goods, and a remaining population whose earnings and savings are eroded by inflation and state confiscation."
So both the Fed and the PBOC are creating two equally destructive and pernicious financial forces: runaway commodity prices fueled by asset bubbles and heavily goosed speculation, and rapidly increasing wealth/income inequality as the gains from speculative excess flow to the top while the price increases and low yield on savings stripmines purchasing power from those least able to afford it.
You can't have it both ways, and that's something neither the Fed nor the PBOC is willing to admit--yet.

Monday, March 14, 2011

Global Turmoil

One can only wonder what will happen when Europe awakens and reacts to global turmoil. Crude futures are tumbling in sympathy with stock markets.

Nikkei in Freefall

My prayers for Japan!

Yen Goes Nuts!

Bank of Japan has intervened. This is true black swan event!