

Saturday, March 5, 2011
David Rosenberg Perspective on Yesterday's Unemployment Figures
"A couple of behind-the-scene facts: from October to February, an epic 700k people have left the work force. If you actually adjust for the fact that the labour force participation rate has plunged this cycle to a 27-year low the unemployment would be sitting at 12% today. Moreover the employment-to-population ratio — the so-called “employment rate” — stagnated in February at 58.4% and is actually lower now than it was last fall when “double dip” was the flavour du jour."
Jobs Participation Rate Plunges
Thanks to Zero Hedge for these charts:
We have heard much from the propaganda machine just how much better the jobs situation has gotten under president Obama three years into his term. We would like to interject with two very simple charts...
Chart 1

Chart 2

h/t John Poehlingjobs
Rick Santelli: It's STILL All About Jobs, Jobs, Jobs!
I remember all too well my refrain in the fall of 2008: "It’s all about JOBS, JOBS, JOBS!"
We created 192,000 headline jobs in the February employment report. It’s not enough, but it certainly is welcome news and it is heading in the right direction — although too slowly.
We also learned from the February report that the unemployment rate finally trended below the psychologically important 9 percent mark. This is a very big development, considering the rate was pushing the 10 percent level several months ago.
Upon closer scrutiny though, there is another factor contributing to the drop that is not necessarily good news: The official size of the U.S. labor force is shrinking.
The Bureau of Labor Statistics publishes the “Labor Force Participation Rate” each month, along with a litany of other metrics that are used to give us the headline jobs number and the unemployment rate.
The government's definition of the labor force is all individuals 16 years of age and older, who are employed or seeking employment. It does not include students; retirees; anyone with unreported income, or "discouraged" workers.
The participation rate is the comparison of the "labor force," those looking for work or employed, and everyone else. That ratio is currently 64.2 percent seasonally adjusted, and 63.9 percent non-seasonally adjusted, the same level as last month. Both of those percentages are currently running at 27-year lows, meaning the percentage of Americans not working or even trying to join the work force is at a near three-decade high.
The last time the participation rate was above 66 percent — the 10-year average — was in August 2008.
It is imperative that we continue to monitor this relationship in order to determine if an improving unemployment rate means that American workers are finding jobs, or have just given up looking.
Friday, March 4, 2011
Stocks Rebound Even As Crude Reaches $105/Barrel
This is amazing. Apparently, the Wall Street minions are betting on economic gold even as crude oil nears the $105/handle. My guess is that this is a short-covering rally.
Stocks

Crude oil


Crude Oil Blasts Through $102, $103, Touches $104

Thursday, March 3, 2011

Risk Is Back

Wednesday, March 2, 2011

Crude Oil Finally Hits Stocks


Tuesday, March 1, 2011


Stocks Stop!


Monday, February 28, 2011


Investment Returns Pummeled by QE2
Last week, the S&P 500 pulled back by less than 2% - certainly not sufficient to clear the overvalued, overbought, overbullish, rising-yields syndrome that we observe in the market, but enough to bring our estimate of S&P 500 10-year total returns from an expected 3.06% to an expected 3.25%.
From the standpoint of prospective investment returns, it is important to recognize that the main effect of quantitative easing has been to suppress the expected return on virtually all classes of investment to unusually weak levels. It's widely believed that somehow, QE2 has created all sorts of liquidity that is "sloshing" around the economy and "trying to find a home" in stocks, commodities, and other investments. But this is not how equilibrium works.
Here's how equilibrium does work. Every security that is issued has to be held by someone, in precisely the form in which it was created, until that security is retired. Period. That means that if the Fed creates $2.4 trillion in currency and bank reserves, somebody has to hold that money, in that form, until those liabilities are retired. The money ultimately can't go anywhere. If someone tries to get rid of their cash in order to buy stock, somebody else has to give up the stock and hold the cash. In the end, every share of stock that has been issued has to be held by somebody. Every money market security that has been issued has to be held by somebody. Every dollar bill that has been created has to be held by somebody. None of these instruments somehow "find a home" by going somewhere else or becoming something else. They are home.
Let me be clear - the additional monetary base created by the Fed certainly is "liquidity" from the standpoint of the banking system, and does amount to funding the U.S. deficit by printing money, until and unless the transactions are reversed. As I've noted previously, at what is approaching 16 cents of base money per dollar of GDP, there will also be significant inflationary risk in the event of even modest upward pressure on short term interest rates. The point, however, is that it is incoherent to say that this "cash on the sidelines" will somehow find a home in some other financial market, or anywhere else in a manner that makes it vanish from "the sidelines" - until it is explicitly retired by the Fed.
So what is the effect of creating an extra $600 billion dollars of monetary base by having the Fed purchase $600 billion dollars of Treasury debt? The same thing that happens anytime any security is issued. Somebody has to hold it, and the returns on all other assets have to shift by just enough to make everyone in the economy happy, at the margin, to hold the outstanding quantity of all of the securities that have been issued. In practice, the only way you can get people to willingly hold $2.4 trillion in non-interest bearing cash is to depress the return on all close substitutes to next to zero. So short-term Treasury bill yields have been pressed to nearly nothing.
Of course, people also look at risky assets and ask whether they might be able to get higher risk-adjusted returns by holding those instead. In order to make people happy to hold the outstanding quantity of zero return cash, the prospective returns on other risky securities have also collapsed (securities are a claim to future cash flows - as investors pay a higher price, they implicitly agree to accept a lower long-term return). In my view, this has gone on to an extent far beyond what is likely to be sustained, but thanks to eager speculation, the S&P 500 is now priced, by our estimates, to achieve annual returns of just 3.25% over the coming decade.
Likewise, all of those securities yielding zero or nearly zero returns have to compete with commodities. Here, the markets have responded to the massive deficits of world governments by increasing their expectations regarding inflation. Now, if you're looking at a zero nominal return on money-market instruments, as well as expected inflation over time, it's natural to start hoarding commodities. See, if you expect your dollars to buy fewer goods and services in the future, and you're not earning interest to make up for it, you'd prefer to stockpile goods right now. This, of course, has created terrible problems for people in less-developed countries, who are experiencing soaring prices for food and fuel, but commodity hoarding was a predictable outcome of QE2.
The real question is how high commodity prices have to rise until people are indifferent between holding non-interest bearing cash, and commodities that are elevated in price. The basic answer is that commodity prices have had to "overshoot" the expected future level of broad consumer prices by enough that both cash and commodities can now be expected to suffer a negative real return as measured against a broad basket of consumer goods. This sort of overshoot is necessary to make people indifferent between holding one versus another, and it restores equilibrium in the face of the negative real return available on money market securities. As with stock prices, I believe that this has already gone too far, but the civil unrest in the Middle East has certainly worsened the situation over the short-term.
This is a critical point - commodity prices tend to swing by a much greater amount than consumer prices. You can easily get periods where general consumer prices are advancing, yet commodities prices are advancing slower or even falling. In my view, QE2 has provoked an "overshooting" advance in commodities prices, which has been necessary because the Fed is holding real interest rates at negative levels. In the face of moderately higher consumer price inflation, coupled with short-term interest rates at zero, the only way to get people to be comfortable holding that much cash is to make the prospective returns on every possible alternative just as bad.
If investors don't understand that this is how QE2 is "working," they are likely to be as blindsided by the coming decade of weak investment returns as they've been over the past decade. It's notable that the weak returns achieved by the S&P 500 over the past decade were predictable, and our estimates of projected total returns have remained quite accurate in recent years. It bears repeating that our difficulty in 2009 was not that we viewed stocks as overvalued, but that we were forced to contemplate data from periods other than the post-war period, which had generally required much more stringent criteria for accepting market risk. At the 2009 lows, stocks were priced to achieve 10-year total returns in excess of 10% annually by our estimates. The problem is that similar expected returns were not sufficient to end prior declines during much lesser crises even in post-war data.
As for the Depression, stocks were priced to achieve negative 10-year returns, by our estimates, at the 1929 peak. After losing half their value, stocks were priced to achieve 10-year returns in excess of 10%. From there, stock prices dropped by an additional two-thirds before bottoming.
Whatever value was available at the 2009 lows is long gone. Our miss in 2009 was emphatically not the result of inaccurate valuation estimates - it was the result of having to contemplate data outside of the post-war period. I've extensively discussed the adjustments we've made (see recent commentaries as well as our semi-annual report). Still, there is nothing in recent data, nor long-term historical data, that creates meaningful doubt for us that stocks are priced to achieve bitterly small returns over the coming decade.
As it happened, much of the 10-year prospective returns that were priced into stocks at the 2009 low have been compressed into the advance since then. For long-term investors, there is now a great deal of risk with not much prospective return to compensate them at current prices. There will still be periods warranting at least a moderate exposure to market fluctuations based on shorter-term considerations, but with the market still characterized by an overvalued, overbought, overbullish, rising-yields syndrome, now is not one of them.
Savings, Investment and Credit Market Debt
Having discussed QE2, let's move on to the broader subject of "credit." Here also, there is a lot of confusion about how credit creation is related to real economic activity. My hope is that the following discussion will clarify some of these relationships. As usual, the best way to evaluate the merit of somebody's analysis is if they show you the data, so I'll also show you the data.
Let's start by considering an economy that produces 100 units of output. 80 are consumed, and 20 are saved as "investment goods" to increase the ability of the economy to produce more output in the future. On the "income" side, those 20 units would be considered to be "savings." On the "output" side, those 20 units would be classified as "investment."
Every good or service that is produced ends up being owned by someone, even if it is simply as unwanted inventory. In an economy where a price can be put on every good and service, and where that price is divided up into the amount earned (or sometimes lost) by those who produced that good and service, it is also an accounting identity that the total value of what the economy produces is equal to the total income of the people in the economy - this is why GDP can be calculated both in terms of "output" and in terms of "income." As a result, when one person saves, it follows that someone else in the economy either consumed more than they produced ("dissavings") or the saved output represented unconsumed investment goods. Net savings and investment are always equal, even if the "investment" represents involuntary accumulation of inventories as a result of production that fails to meet the preferences of consumers.
If the economy is specialized, so that workers, wealth-holders, factory owners and so forth are not identical individuals, the savings of some individuals have to be matched up with the desired investment or dissavings of other individuals. Credit is simply the means by which this transfer occurs. Suppose that each unit of output costs $1 in our simple economy. We need not trace every single transaction to know that ultimately, people will have earned $100 of income, consumed $80 of it, saved (net) $20 of it, then lent the $20 to others who bought the 20 units of "investment" output. In order to transfer or "intermediate" the savings, savers now get IOUs in the amount of $20, and the borrowers now owe IOUs in the amount of $20. The stack of IOUs in the economy thus represents amounts that have been intermediated from savers to borrowers. Broadly speaking (and with some important exceptions), the quantity of outstanding credit market debt measures the amount of net saving that has been transferred for the purpose of real investment over time.
Linking financial activity to real activity
A good way to understand the total quantity of credit market debt in the economy may be to think in terms of "opening," "closing," and "spread" transactions. In an "opening" transaction, someone produces a real good or service, earns money for doing so, saves some of it, and uses those savings to make a new loan to someone else in the economy. A "closing" transaction also transfers new savings that have resulted from the production of real goods and services, but in this case, the savings are used to pay off an existing loan to someone else in the economy. Finally, a "spread" transaction is one where someone in the middle essentially borrows from one person and lends to another. In this sort of transaction, the ultimate borrower and lender don't deal with each other, but are each a "counterparty" of the middleman.
It's useful to think of transactions in this way because it links what is happening in the real goods-and-services economy with that is happening in the debt markets. The economist Ludwig von Mises made a similar distinction when he talked about "commodity credit":
"Every serious discussion of the problem of credit expansion must start from the distinction between two classes of credit: commodity credit and circulation credit. Commodity credit is the transfer of savings from the hands of the original saver into those of the entrepreneurs who plan to use these funds in production. The original saver has saved money by not consuming what he could have consumed by spending it for consumption. He transfers purchasing power to the debtor and thus enables the latter to buy these nonconsumed commodities for use in further production. Thus, the amount of commodity credit is strictly limited by the amount of saving, i.e. abstention from consumption. Additional credit can only be granted to the extent that additional savings have been accumulated. The whole process does not affect the purchasing power of the monetary unit."
"Circulation credit is granted out of funds especially created for this purpose by the banks. It increases the amount of money substitutes, of things which are taken and spent by the public in the same way in which they deal with money proper. It increases the buying power of the debtors. The debtors enter the market of factors of production with an additional demand, which would not have existed except for the creation of such banknotes and deposits. It is the main tool of policies aiming at cheap or easy money."
Consider an "opening" transaction. Someone in the economy produces goods and services, but does not consume the income. That leaves unconsumed goods and services available to others in the economy. The saver takes the new income resulting from that production, and lends it to someone else. Now, one of two things can happen: 1) the borrower can use the proceeds for consumption, in which case savings are offset by dissavings, so you get an expansion of credit without any addition to real investment, or 2) the proceeds can be used to purchase investment goods.
If the economy has done its job well, individuals have an incentive to save, and the investment goods produced by the economy are desirable and add to future productivity. If the economy has failed to allocate production well, the investment goods end up being unwanted "inventory investment" and the savings are essentially used to finance their accumulation (think of a company having to borrow to cover payroll to produce goods that it was unable to sell). Worse, if the inventory is ultimately written off or goes bad, somebody is forced to book the loss of what they previously thought was income, producing "dissaving" and "disinvestment," and the economy goes on as if the misallocated output was never produced in the first place.
Keep in mind that the particular "story" will vary from case to case, and there may be intermediate transactions. But in the end all of this is an accounting identity. Exactly who ends up doing the borrowing, lending, saving, dissaving, and investment may be in question, but in aggregate, savings equal investment, income equals output, and everything that is produced ends up being consumed or held by someone.
What is important here is that stagnant or contracting credit market debt typically reflects an economy where there is little incentive to save, or where investment is misallocated to produce things that are not desired by consumers or businesses. Economic policies that both punish the incentive to save, and encourage the speculative misallocation of resources, however well-meaning, are hostile to economic growth and rising standards of living.
Yet even when credit market debt is expanding, it may not be favorable for the economy if the increase in debt is used to finance dissavings and consumption. In that case, you get an expansion in debt without a corresponding expansion in real investment and productive capacity. This is a dangerous game, because credit market debt can increase more rapidly than the real stock of productive investment assets in the economy that are able to service that debt. In the end, there will be hell to pay.
Sustainable Credit = Actual Savings Allocated to Productive Investment
Let's take the discussion above to real world data. The chart below presents the 4-year change in total credit market debt versus the 4-year total of gross domestic investment (which is also equal to gross domestic saving plus the savings we import from foreign countries to finance our economic activity). Note the two credit bubbles in the data. The first was in the late 1980's, which was followed by the savings-and-loan crisis. The second was the housing bubble that reached its peak in 2007, followed by the recent credit collapse. In both cases, the growth of debt rapidly outstripped real investment, indicating that debt was being taken on largely for the purposes of consumption. Savers were matched up with dissavers, creating a great deal of new debt, but no new net savings or investment. In addition, various forms of financial engineering created "repackaged" debt by simultaneously borrowing and lending, which created more debt securities and adding a great deal of "counterparty" risk to the economy. Neither of these credit bubbles ended well.
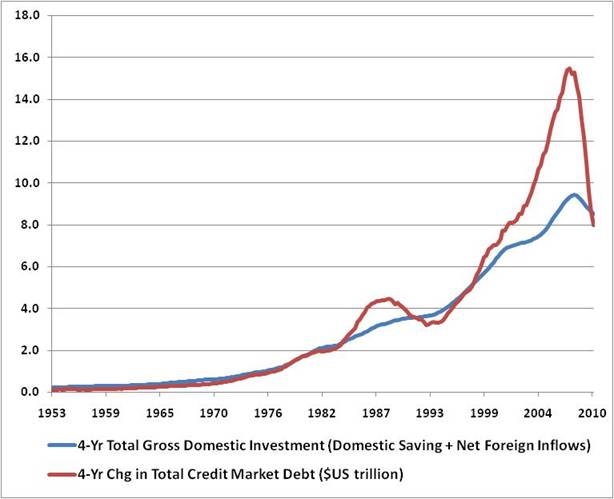
It's not clear whether Ben Bernanke will be successful in promoting a third bubble in credit, but it seems more likely that the Fed's interventions have done little except to defer the full resolution of the bubble we already had. Personally, I believe that the Fed's existing policies have set the financial markets up to experience persistent disruptions in the years ahead, so for all intents and purposes, he might as well have created a full scale bubble - the outcome for investors appears likely to be the same.
While the bubble in credit growth has clearly reversed, we would not be surprised to see a further deterioration in total credit market debt, accompanied by further stagnation in gross domestic investment for several more years. On that note, it's worth observing that after 5 quarters of positive growth, U.S. gross private domestic investment collapsed at an annualized rate of over 20%, both in real and nominal terms, during the last quarter of 2010. No wonder the U.S. economy only looks good with the help of deficit spending approaching 10% of GDP and what now amounts to trillions of dollars of Fed intervention.
Interestingly, the relationship between savings/investment and total credit market debt holds together fairly well in a cumulative sense since 1950. There are numerous factors (interest payments, retirement of debt, and so forth) that would need to be modeled explicitly in order to capture the precise relationship between cumulative savings/investment and growth of credit market debt. Still, to a first approximation, the two have grown very closely over the past 60 years. Importantly, credit market debt has increased far more rapidly than real savings and investment during the past decade, largely reflecting "cash-out" financing which withdrew equity from homes, as well as government deficit spending to finance consumption and military expenditures. Frankly, I also believe that a not-insignificant portion of outstanding credit market debt is essentially worthless, but is still carried on the books as if it has value. Overall, the recent bubble in credit was clearly not a reflection of productive saving and investment activity, and it is not clear that the economy has de-leveraged to the extent needed to put the burden of ongoing debt service in line with our productive means.
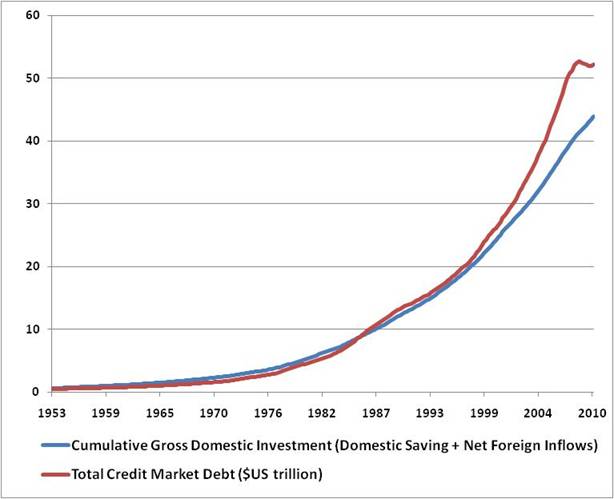
At present, the outstanding quantity of credit market debt represents about 3.5 times GDP. The chart below is from Flow-of-Funds data, and I should note that the Federal component does not include Treasury debt held by the Fed, the Social Security Administration, or other government agencies. While 3.5 times GDP seems like an unbelievably high figure, the analysis above suggests that most of this is well represented by productive investments that the economy has made over time. To the extent that a large proportion of this debt represents productive investments that the U.S. has made over time, the debt is perfectly desirable. Indeed, we are hopeful that the U.S. economy will produce and allocate far more savings to investment, funding new innovations and discoveries that will add to future growth and economic prosperity.
On the other hand, however, the gap is still too wide between the credit that has been extended and the productive capacity that we have accumulated. Much of that gap has emerged because we continue to punish saving by depressing the rate of return available to investors, while at the same time pursuing policies aimed at consumption rather than real investment, research & development, and other activity that would add to the productive capacity of the nation. Stimulating consumption and speculation have been the life-blood of government policy interventions over the past two years, yet they are exactly the approaches that got us into trouble, and are likely to fare no better in producing better outcomes in this instance. Our problem is not with debt itself (much of which represents productive past investment), it is with imbalances, misallocated resources, distorted financial markets, bad debt held on the books as if it is good, and the quiet reliance on the public to bail out losses that should be borne by the private sector.
I strongly believe that part of the gap between total credit market debt and cumulative gross investment is literally thin air, in the sense that assets are being held on the books of banks and other financials that are not worth the sharpened pencils that are needed to perpetuate the illusion of value. On that subject, we've received a number of notes from observant shareholders pointing out that the Chief Financial Officer of Wells Fargo has inexplicably resigned. I observed several quarters ago that we could observe a wave of fresh risk aversion "at the point where the first bank CFO resigns out of refusal to sharpen his pencil any further," but as I've noted below, the FASB appears intent on preserving the existing set of accounting rules allowing financial institutions to value their assets with "substantial discretion," with no necessary link to market values. So it remains unclear what the true state of the banking system is, and the extent to which further bailouts will ultimately become necessary down the road. It will be important to keep watch on how this develops.
In any event, the bottom line is that real economic growth is best supported by the allocation of savings to productive investment. Rapid expansion of credit market debt, relative to real savings and investment activity, is indicative of a credit bubble - what Ludwig von Mises termed "false prosperity." Absent the incentive to save, and the availability of productive investment opportunities, the Fed's monetary interventions serve to do little but misallocate resources and capital.
An Open Letter to the Financial Accounting Standards Board
To: Financial Accounting Standards Board
From: John P. Hussman, Ph.D.
From: John P. Hussman, Ph.D.
Dear FASB Board members,
As one of the few economists that urgently warned three years ago about the oncoming financial crisis (see Minding the Hinges on Pandora's Box ), I am not simply disappointed, but stunned that the FASB has indicated a willingness to move back to amortized cost in the accounting of bank loans, in a banking system that is well known to have trillions of dollars in mortgage loans with underwater collateral, as well as millions of delinquent but unforeclosed loans. Rather than opting for procedures that would require adequate reflection of impairment or even quasi-market valuation such as 3-year averaging, the FASB appears intent on laying a lovely turf lawn over a toxic waste dump.
The FASB is a standards board. Standards. You are not running a popularity contest. Leslie Siedman cited “strong signals from the board's constituents” as the basis for the accounting decision, but precisely who are your constituents? Are they the bank representatives and lobbyists who undoubtedly stuffed your in-boxes with objections, or are they the general public – who rely on full, fair and accurate disclosure – but who scarcely can be expected to address the FASB on detailed accounting rules and therefore must trust you to act on their behalf?
Does any among you believe that the mortgage loans on bank balance sheets are actually worth amortized cost, when many of those loans are presently considered “current” only because they have been modified to tack delinquent payments onto the back end of the payment stream? You know better.
It matters urgently which “constituents” you presume to represent. Consider today's text from the Wall Street Journal:
“The Financial Accounting Standards Board preliminary vote would allow banks to continue valuing many of their loans at amortized cost, an adjusted version of their original cost, as they do now. That backtracks on an FASB proposal last May to expand fair value to bank loans. The reversal is a victory for the banking industry, which says it would have hurt lending and unfairly reduce banks' book value. Supporters of the FASB fair-value proposal say it would have improved transparency and unmasked potential weakness at banks. The FASB indicated the overwhelmingly negative reaction to its proposal from companies and investors played a large role in prompting the board to change its mind. The board received more than 2,800 comment letters on its fair-value proposal, most of them opposed to the move.”
That text might as well now read as follows:
“The Financial Accounting Standards Board preliminary vote would allow Bernard Madoff to continue valuing many of his funds based on the value of the original investments made by investors, before they were embezzled, as Madoff does now. That backtracks on an FASB proposal last May to expand fair value to pyramid schemes. The reversal is a victory for the Ponzi industry, which says it would have hurt lending and unfairly reduce Ponzi schemes' book value. Supporters of the FASB fair-value proposal say it would have improved transparency and unmasked potential weakness in Ponzi schemes. The FASB indicated the overwhelmingly negative reaction to its proposal from Ponzi schemes and investors hoping to trade the schemes higher played a large role in prompting the board to change its mind. The board received more than 2,800 comment letters on its fair-value proposal, most of them opposed to the move. Ordinary and less sophisticated investors [not to mention the public who will eventually be called on to clean up the mess], trusting the FASB and the SEC to get it right, didn't realize that they had to write a letter, and are therefore [expletive deleted] out of luck.”
Congratulations. You've turned the U.S. banking system into the Love Canal.
I urge the Board to think very carefully about precisely who its constituents are, and to maintain the words “standards,” “complete,” “fair,” and “accurate” in the forefront of its deliberations.
Sincerely,
John P. Hussman, Ph.D.
Hussman Investment Trust
Hussman Investment Trust
Subscribe to:
Posts (Atom)


