Wednesday, January 18, 2012

Hoisington Calls for Recession in 2012

By Van R. Hoisington and Lacy H. Hunt, Ph.D.

High Debt Leads to Recession
As the U.S. economy enters 2012, the gross government debt to GDP ratio stands near 100% (Chart 1). Nominal GDP in the fourth quarter was an estimated $15.3 trillion, approximately equal to debt outstanding by the federal government. In an exhaustive historical study of high debt level economies around the world, (National Bureau of Economic Research Working Paper No. 15639 of January 2010, Growth in the Time of Debt), Professors Kenneth Rogoff and Carmen Reinhart econometrically demonstrated that when a country's gross government debt rises above 90% of GDP, "the median growth rates fall by one percent, and average growth falls considerably more." This study sheds considerable light on recent developments in the United States. After suffering the most serious recession since the 1930s, the U.S. has recorded an economic growth rate of only 2.4%. Subtracting 1% from this meager expansion suggests that the economy should expand no faster than 1.4% in real terms on a trend basis going forward, which is virtually identical with the economy's expansion in the past twelve months.

In highly indebted countries, governments have expansively taken resources from the private sector through taxing and borrowing. This leaves the private sector with less vigor to produce jobs and increase productivity, and subsequently wealth for its fellow citizens. This theory, which dates back to David Hume's essay, Of Public Credit published in 1752, is now being played out in real time in the United States. We judge that when an economy is expanding in such a meager fashion it is exposed to an increasing frequency of recessions. We expect such a recessionary event to emerge in 2012.
Contractionary Fiscal Policy
It would be difficult to devise a more horrendous set of fiscal policy parameters to spur economic growth than currently exist. Real federal government purchases of goods and services, which comprise 8% of real GDP, will decline by about 1% if the impartial projection of the Congressional Budget Office (CBO) for a fiscal 2012 deficit of about $1.3 trillion is in the ballpark. Defense spending will bear most of the decline in federal expenditures, but non-defense spending will, at best, be flat. In spite of record deficits since the spring quarter of 2009, real federal government purchases of goods and services have risen at an anemic 1.5% annual rate, confirmation that only a small amount of exploding expenditures went for infrastructure projects. The scant growth rate in the economy suggests a negative outlay multiplier.
Contrary to common belief, the massive deficits of recent years will actually reduce economic growth in 2012 through a subtle, but nevertheless credible channel consistent with the preponderance of economic research. Studies suggest the government expenditure multiplier is zero to slightly negative. Increased deficit spending does appear to provide a modest lift to GDP for three to five quarters, depending upon the initial conditions of the economy. However, following this small, transitory gain, deficit spending actually retards GDP growth and the economy returns to its starting point at the end of about twelve quarters. Based on our interpretation of these studies, the U.S. economy is now on the backside of the string of record deficits, and this will be a drag in 2012. Despite the massive spending, all that is left is an economy saddled with a higher level of debt, with more of its productive resources diverted to paying the non-productive elevated level of interest payments. According to the CBO, gross federal debt will rise to at least 103% by the end of 2013. However, if the FICA tax reduction is extended for the full year, and/or a recession ensues, as we expect, revenues and expenditure estimates by the CBO will prove to be too optimistic. Under current circumstances, no viable way exists to remove the increasing federal debt burden from the economy's growth trajectory. As such, the federal fiscal constraint is operative for the foreseeable future.
In the past three fiscal years, the budget deficit averaged 9.3% of GDP (Chart 2), the highest since 1943-45. Federal outlays were almost 25% of GDP (Chart 3), and also the highest since the final three years of WWII. Dr. Barry Eichengreen of the University of California at Berkeley, author of Exorbitant Privilage,estimates that after 2015 this outlay figure is headed to 40% over the next quarter century without major structural reforms in Social Security and Medicare. For Dr. Eichengreen this means that the current law cannot remain unchanged in spite of the lack of political will to deal with the issue. Dr. Eichengreen states: "The United States will suffer the kind of crisis that Europe experienced in 2010, but magnified. These events will not happen tomorrow. But Europe's experience reminds us that we probably have less time than commonly supposed to take the steps needed to avert them. Doing so will require a combination of tax increases and expenditure cuts." He goes on to point out that, "At 19 percent of GDP, federal revenues are far below those raised by central governments in other advanced economies with spending on items other than health care, Social Security, and defense and interest on the debt having shrunk from 14 percent of GDP in the 1970s to 10 percent today, there is essentially no non-defense discretionary spending left to cut. One can imagine finding small savings within that 10 percent, but not cutting it by half or more in order to close the fiscal gap."


Consistent with this analysis, the Trustees of Social Security and Medicare have calculated that the present value of unfunded liabilities of these two programs totals $59.1 trillion. Additionally, there have been tabulations that all federal government liabilities, including those of Medicaid, veterans and other defense obligations, pension liabilities of government employees, and additional federal programs total $200 trillion at present cost.
These massive unfunded liabilities, when coupled with our present trillion dollar deficit, point to the stark reality that significant revenue increases and serious cuts in all programs will be shortly forthcoming. If these readjustments take advantage of current knowledge regarding tax and spending multipliers, the economic implications should not be severe. Clearly the only solution for our present predicament is to have a vigorous and rapidly expanding private sector and a shrinking public sector. As an investor concentrated solely in Treasury securities, our maturity structure will depend greatly upon the timely resolution of the country's present deficits.
State and local purchases of goods and services (10.9% of real GDP) has fallen at a 2.1% annual rate since mid 2009, and is poised to decline further in 2012. The fiscal condition of these levels of government has improved due to rising tax revenues and expenditure cuts. However, about one half of the states still face deficits in the final half of the current fiscal year and/or in the new fiscal year that begins in July 2012. Also, these budgets do not reflect the unfunded liabilities of their pension funds that are experiencing another year of investment returns that are considerably less than their actuarial assumptions. Further, a number of states enacted temporary tax increases that expire. Thus, state and local governments must continue to either cut spending or renew the taxes that politicians promised were temporary. The seeming improvement in state and local finance is an illusion, and this drag on economic activity will continue.

Monday, January 16, 2012

Eurodollar Futures Explained

Futures contracts

The Eurodollar futures contract refers to the financial futures contract based upon these deposits, traded at the Chicago Mercantile Exchange (CME). Eurodollar futures are a way for companies and banks to lock in an interest rate today, for money it intends to borrow or lend in the future.[7] Each CME Eurodollar futures contract has a notional or "face value" of $1,000,000, though the leverage used in futures allows one contract to be traded with a margin of about one thousand dollars.[8]
The minimum fluctuation in a Eurodollar contract is one-quarter of one basis point (0.0025% = $6.25 per contract) in the nearest expiring contract month, and one-half of one basis point (0.005% = $12.50 per contract) in all other contract months. [9] Trading in Eurodollar futures is extensive, and the market for them tends to be very liquid.
CME Eurodollar futures prices are determined by the market’s forecast of the 3-month USD LIBOR interest rate expected to prevail on the settlement date. The settlement price of a contract is defined to be 100.00 minus the official British Bankers Association fixing of 3-month LIBOR on the contract settlement date. For example, if 3-month LIBOR sets at 5.00% on the contract settlement date, the contract settles at a price of 95.00.[10]

How the Eurodollar futures contract works

For example, if on a particular day an investor buys a single three month contract at 95.00 (implied settlement LIBOR of 5.00%):
  • if at the close of business on that day, the contract price has risen to 95.01 (implying a LIBOR decrease to 4.99%), US$25 will be paid into the investor's margin account; or
  • if at the close of business on that day, the contract price has fallen to 94.99 (implying a LIBOR increase to 5.01%), US$25 will be deducted from the investor's margin account.
On the settlement date, the settlement price is determined by the actual LIBOR fixing for that day rather than a market-determined contract price.

Eurodollar futures contract as synthetic loan

A single Eurodollar future is similar to a forward rate agreement to borrow or lend US$1,000,000 for three months starting on the contract settlement date. Buying the contract is equivalent to lending money, and selling the contract short is equivalent to borrowing money.
Consider an investor who agreed to lend US$1,000,000 on a particular date for three months at 5.00% per annum (months are calculated on a 30/360 basis). Interest received in 3 months' time would be US$1,000,000 × 5.00% × 90 / 360 = US$12,500.
  • If the following day, the investor is able to lend money from the same start date at 5.01%, s/he would be able to earn US$1,000,000 × 5.01% × 90 / 360 = US$12,525 of interest. Since the investor only is earning US$12,500 of interest, s/he has lost US$25 as a result of interest rate moves.
  • On the other hand, if the following day, the investor is able to lend money from the same start date only at 4.99%, s/he would be able to earn only US$1,000,000 × 4.99% × 90 / 360 = US$12,475 of interest. Since the investor is in fact earning US$12,500 of interest, s/he has gained US$25 as a result of interest rate moves.
This demonstrates the similarity. However, the contract is also different from a loan in several important respects:
  • In an actual loan, the US$25 per basis point is earned or lost at the end of the three-month loan, not up front. That means that the profit or loss per 0.01% change in interest rate as of the start date of the loan (i.e., its present value) is less than US$25. Moreover, the present value change per 0.01% change in interest rate is higher in low interest rate environments and lower in high interest rate environments. This is to say that an actual loan has convexity. A Eurodollar future pays US$25 per 0.01% change in interest rate no matter what the interest rate environment, which means it does not have convexity. This is one reason that Eurodollar futures are not a perfect proxy for expected interest rates. This difference can be adjusted for by reference to the implied volatility of options on Eurodollar futures.
  • In an actual loan, the lender takes credit risk to a borrower. In Eurodollar futures, the principal of the loan is never disbursed, so the credit risk is only on the margin account balance. Moreover, even that risk is the risk of the clearinghouse, which is considerably lower than even unsecured single-A credit risk.

Other features of Eurodollar futures

40 quarterly expirations and 4 serial expirations are listed in the Eurodollar contract.[11] This means that on January 1, 2011, the exchange will list 40 quarterly expirations (March, June, September, December for 2011 through 2020), the exchange will also list another four serial (monthly) expirations (January, February, April, May 2011). This extends tradeable contracts over ten years, which provides an excellent picture of the shape of the yield curve. The front month contracts are among the most liquid futures contracts in the world, with liquidity decreasing for the further out contracts. Total open interest for all contracts is typically over 10 million.
The CME Eurodollar futures contract is used to hedge interest rate swaps. There is an arbitrage relationship between the interest rate swap market, the Forward Rate Agreement market and the Eurodollar contract. CME Eurodollar futures can be traded by implementing a spread strategy among multiple contracts to take advantage of movements in the forward curve for future pricing of interest rates.

Sweeps

In United States Banking, Eurodollars are a popular option for what are known as "sweeps". By law,[12] banks aren't allowed to pay interest on corporate checking accounts. To accommodate larger businesses, banks may automatically transfer, or sweep, funds from a corporation's checking account into an overnight investment option to effectively earn interest on those funds. Banks usually allow these funds to be swept either into money market mutual funds, or alternately they may be used for bank funding by transferring to an offshore branch of a bank.

As Markets Become Unravelled

from m3 Financial Analysis blog:
The markets are dissolving…they are TOTALLY disconnecting due to the stresses caused by deleveraging…IT IS NOT PRETTY and it is totally the result of central economic planning…what a mess. A major disconnection around these corners awaits.
For more information regarding what the EURODOLLAR contract is: click here

Credit Trumps Equities

from Macrostory blog:
Credit markets are truly forward looking. Equity not so much. History clearly shows credit should never be ignored. There have been three large divergences between equity and credit since the late 90′s and each time credit forced the hand of equity.
Here we are once again on the eve of a possible breakout in the entire treasury curve to new all time highs (low yields). History does have a way of repeating when it comes to the capital markets.
Below is a 15 year comparison of the 10 year yield and the SPX. Also note the orange circles outlining that huge head and shoulder’s pattern on the SPX that has taken a decade to form. In the words of the Dos Equis man “stay thirsty my friends.”

Sunday, January 15, 2012

Overnight Long/Intraday Short Gold Fund More Than Doubles In Just Over A Year: Generates 43% Annualized Return

The PM gold fix occurs at 3 pm London time (8 am MST) and the AM gold fix occurs at 10:30 am London time (3:30 am MST)

from Zero Hedge:

Back in August 2010, we presented an idea proposed by our friends at SK Options trading for a very simple trading strategy: being long gold in the overnight session, and shorting it during the day. At the time of writing, such a strategy would have returned $2.16 billion from a $100 million initial investment in 10 years, a 37.46% annualized return. Today, we provide a much needed follow up to this quite stunning divergence. As SK notes: "we have revisited the article and written an update. Not only does the discrepancy still exist but it has been actually increasing. That fund would now be worth $5.26B, way up from $2.16B when we last wrote about it - in other words an increase of 143% in just over a year. When we wrote about this in August 2010, the annualized return of the Long Overnight/Short Intraday gold index was 37.46% since the start of 2001. However if we measure from now the annualized return since 2001 is 43.24%, with the annualized return of the Long Overnight/Short Intraday gold index standing at roughly 64.4% since 2009." So for those who wish to layer on an additional alpha buffer on top of what is already the best performing asset of the past decade, the SK Options way just may be the strategy. As for the reasons for this gross arbitrage - who cares. Is it manipulation? is it the early Asian buying offset by London pool selling? It is largely irrelvant - the point is that this is "the divergence that keeps on giving" - kinda like a Stolper trade, or an inverse Tilson ETF, and until it doesn't, or until something dramatically changes in the precious metal market, it is likely that this trading pattern will continue for a long time.
From SK Options trading
Revisiting Our Proposal For An Overnight Gold Fund


In August 2010 we wrote an article entitled “Proposing An Overnight Gold Fund” in which we explored the potential for launching a fund that held long positions in gold overnight and was short gold during the day. We pointed out that “a hedge fund starting in 2001 with $100m, with the strategy of being long gold from the PM to AM fix, and short gold from the AM to PM fix...would be worth $2.16billion today, before any fees and expenses.” We have been monitoring this trading strategy since then and therefore would like to take this opportunity to update readers on its astonishing progress.
Firstly we will introduce the thinking that led us to investigate this trading strategy. There is much debate within the precious metals industry regarding the alleged suppression, or at least manipulation to an extent, by either central banks or the proprietary trading divisions of large banks, or a combination of the two.
In April 2010 the US Commodity Futures Trading Commission CFTC fined Hedge Fund Moore Capital for manipulation of the New York platinum and palladium futures market, as the firm was found to be “banging the close”, which involves entering orders in a manner designed to inflate the closing price, which other various derivatives contracts could be based on. So that is irrefutable evidence that the precious metals futures market is, at least to some extent, being manipulated. However a large concentration of this debate is based not on platinum and palladium, but on gold and silver, and particularly gold.
There are other theories that could explain this discrepancy that do not involve manipulation. For example one could take the view that Eastern market participants are perhaps more bullish on gold than their Western trading counterparts. Therefore gold is perhaps more likely to rise during Asian trading and fall when the west takes over.
Numerous hypothesises have been put forward as to the motive behind alleged suppression of the gold, ranging from a central bank conspiracy to keep gold prices low, to large trading banks simply exploiting their market dominance for easy profits, or even a combination of the two with the central banks and large bullion trading operations working together in some kind for cartel to keep gold prices low. This article does not intend to discuss the merits of these theories, however plausible or implausible various parties believe them to be. Instead we will focus on finding out if a discrepancy exists and if it does, can one take advantage of it and use it for profitable trading strategies.
We would like to recommend an excellent article by Adrian Douglas, editor of Market Force Analysis and a GATA board member entitled “Gold Market is not “Fixed”, it’s Rigged” which goes into great detail on the statistics behind the difference between how gold trades between the AM and PM fix, and how it trades from the PM to AM fix. The very fact that there appears to be a significance difference sets our alarm bells ringing. Whether gold trades in New York, London, Tokyo or Timbuktu, gold is still gold and so one would expect that it would trade in a similar fashion across these timeframes over a long period of time.
If we take the change in the gold price from the London AM to PM fix (intraday gold) compare it to the change in the gold price from the PM to AM fix (overnight gold), we can see the startling difference between the two periods of trading. We will demonstrate this by showing what would have happened if one had theoretically invested in the intraday gold market from 2001 to present.
Starting in 2001 with an indexed based at 100, the chart below shows what would have happened to that investment of 100 if it had been used to purchase gold at the AM fix and sell gold at the PM fix, replicating the daily percentage performance of gold in the intraday market.


As the chart above shows, the performance is dismal. For example a hypothetical gold investment fund starting with $100m in 2001, and using it to buy gold at the AM fix and sell it at the PM fix would now be left with just $31 million, almost a 70% loss in just under ten years. Over the same time period gold prices have risen over 590%.
From this we can infer that in fact it was possible to make money shorting gold everyday for the last decade or so. If a hedge fund or even an individual trader were to have sold gold at the AM fix and covered that short position at the PM fix, for each day of this terrific bull market run in gold, that fund would have almost tripled their starting capital.

This appears to be a remarkable result, as one would presume that shorting gold everyday during a period where the yellow metal has risen 590% would have devastated any portfolio, not caused a 178.7% increase. Those who do not believe in theories of gold price suppression, often cite the fact that gold prices are at an all time high as a major piece of evidence to discredit any suggestions of price suppression. After all how can the price be being suppressed if prices are sky rocketing?
Well the answer to that question is that if the gold traders at the large banks accused of such manipulation are just trading during the intraday market between the AM to PM fix, they may not be too concerned about how gold trades overnight (provided they are not holding positions overnight of course). What matters is how gold trades during this intraday period, and if more often than not gold is falling during this time, and more often than not the banks are short gold during this period, then they are making money regardless of the overnight price action.
It would appear that subtle manipulation is more likely that blatant price suppression.
So the question on the mind of many gold bulls might be; how do I remove this downward manipulation during the intraday period? Even if I do not believe in manipulation, suppression or any other conspiracy theories, how do I eliminate this statistical fact that gold is underperforming during the intraday period?
The answer is to buy gold at the PM fix and sell it the following day at the AM fix, or more simply put, just be long gold overnight.

The graph above shows how rewarding this strategy would have been, with a return of 1797% in eleven years, a return 3.2 times greater than the 590% that would have been made simply buying gold in 2001 holding until now. With many investors and traders looking for the best way to lever their gold returns, from pouring over drill results to identify the best gold stocks to experimenting with leveraged gold ETFs and ETNs, a more simple solution could be simply to only have long exposure to gold overnight.
For the more cavalier traders, going long gold overnight and then short gold for the intraday period, makes for an even more profitable strategy.

Consider a hedge fund starting in 2001 with $100m, with the strategy of being long gold from the PM to AM fix, and short gold from the AM to PM fix. That hedge fund would be worth $5.26billion today, before any fees and expenses. This should be enough to catch any investor’s attention. Even without shorting gold during the intraday period, limiting exposure to gold to just the overnight period enhances returns enough to justify using this as a basis for a trading strategy.
As stated at the beginning of this article, our focus is not what or who is causing this discrepancy nor any potential motives for such a discrepancy, but what action to take in order to profit from it.
What has surprised us most in our ongoing investigation into this area is that not only is the discrepancy persisting, but it is arguably increasing. When we first wrote about this in August 2010, the annualized return of the Long Overnight/Short Intraday gold index was 37.46% since the start of 2001. However if we measure from now the annualized return since 2001 is 43.24%. the chart below demonstrates this point, with the annualized return of the Long Overnight/Short Intraday gold index standing at roughly 64.4% since 2009.

Another point of interest is when this outperformance is concentrated. The performance around the September 2011 correction is particularly remarkable. Whilst gold prices plummeted, the Long Overnight/Short Intraday gold index increased dramatically, having already been increasing whilst gold rallied over the previous couple of months.

From this we can infer that the majority of gold’s declines in the recent major correction occurred during the intraday trading session, not the overnight trading session.
However in practice we must keep in mind that reversing one’s position each day is not free. One would have to cross the bid/ask spread. Taking a $0.10 spread into account the short intraday and long overnight index would have increased from 100 to 1827.34 since 2001. This increase of 1727.4% outperforms the 593% increase in gold prices over the same period by almost 3 times. If a $0.20 spread is used on a short intraday and long overnight index, there is an increase of 530.4%, which slightly underperforms a buy and hold strategy. Therefore one would need to be able to reverse one’s position at the AM and PM fix for $0.10 spread for the strategy to work in practice.
Nonetheless we still think that this is an important discrepancy that should be taken into account when trading gold. Even if one does not explicitly execute this exact trading strategy, one can still benefit from the trading patterns it is based on. For example if one was nervous about a correction in gold prices but did not want to be short gold, it would perhaps be preferable to close any long position prior to the intraday trading period and reopen them after the PM fix.
In addition to incorporating these patterns into our trading strategy at SK Options Trading, we are also looking into the feasibility of launching some form of investment fund to take advantage of the opportunities discussed in this article. As part of this feasibility study we are looking to gauge investor interest and so would welcome any comments, suggestions or ideas that people may wish to contribute, simply email info@skoptionstrading.com.

Bill Hester: Five Risks to the Global Economy in 2012

As we're all a bit forecast weary by this point in the year, here's a list - not of prognostications - but rather of potential risks that may come into even greater focus this year. These risks – whether they intensify or pass – will likely play an important role in driving the performance of global stock markets in 2012.

1) The Persistence of Wide Spreads Among European Debt – Even if Bond Holders are ‘Rescued'
There are two components of the European credit crisis - debt levels and economic growth prospects. While the conversations to this point have leaned mostly toward reducing debt levels, economic growth prospects and the overall viability of a common currency will likely get a closer look this year, especially as Europe heads for recession.
During this two-year crisis investors have continually called on the ECB and euro area leaders to ‘fix' the debt issue: by wiping out half of Greece's debt, by protecting Italy's access to debt markets through bond purchases, or by suggesting a levered EFSF, the euro area's rescue vehicle.
But even if the ECB does bend to the will of the bond markets this year, and begins to buy sovereign debt directly, the single currency is left with all of the same weaknesses that existed prior to the crisis: the inability to tailor interest rate policy for each individual economy, the lack of foreign currency adjustment needed to offset differences in competitiveness, and growth-limiting trade dynamics throughout the area.
Martin Feldstein, a long-time euro skeptic, in this month's Foreign Affairs magazine made the point this way: “During the past year, Germany had a trade surplus of nearly $200 billion, whereas the other members of the eurozone had trade deficits totaling $200 billion. A more comprehensive measure that factors in net investment income reveals that Germany has a current account surplus of nearly five percent of GDP, whereas Greece has a current account deficit of nearly ten percent of GDP. Put another way, Germany can invest in the rest of the world an amount equal to five percent of its GDP, whereas Greece must borrow an amount equal to nearly ten percent of its GDP to pay for its current level of imports”.
One of the strongest benefits at the introduction of the common currency was that investors priced government debt similarly across the euro area. During this period investors thought of the euro area as a group of countries that would not only share a currency, but also share economic performance and long-term outcomes. Smaller countries and those of southern Europe experienced the greatest amount of benefit from converging yields. Yield on Greek debt fell by more than half in less than 10 years. Even stock market valuation ratios converged. The spread between the countries with the highest and lowest PE ratios dropped by more than half during the period.
While this period could have been used to improve some of the issues surrounding productivity, competitiveness, and trade dynamics among countries, what occurred instead was that governments took on larger amounts of liabilities, and as interest rates fell, housing bubbles formed. With that period passed, it's difficult to imagine that investors will soon return to the mindset that Portugal, Ireland, or even Italy, will soon again converge materially – in either economic performance or level of credit risk - with Germany.
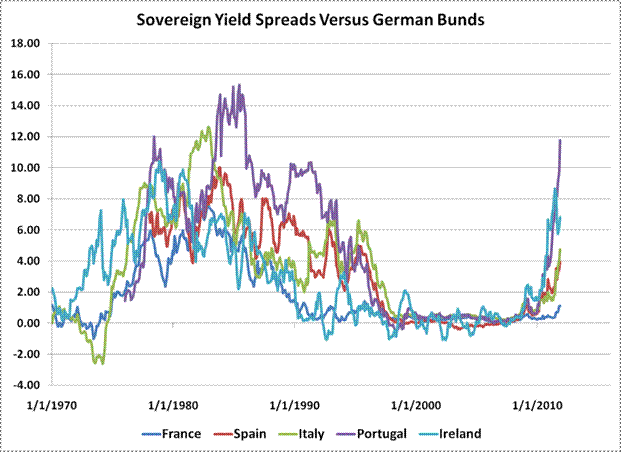
I highlighted this risk and the graph below early in the European credit crisis ( The Great Divergence ). At that point the sovereign debt of Portugal was priced at 200 basis points above German bunds, compared with 1100 basis points today. Here is an updated graph.
There is a long history prior to the period of the shared currency where spreads among countries and with Germany were dramatically and persistently wider than even today. This was because expected economic growth rates, inflation expectations, and the real rates required by investors differed. Now that investors have been reminded of the structural weaknesses of a common currency – even outside of the discussion of high debt loads - persistently high spreads may be here to stay. Those spreads will surely play a role in the potential long-term growth rates of economies and euro area stock market valuations.
2) Sovereign Debt Rollover Risks
When the history of the European Credit Crisis is written, it'll likely be in two parts. The first part will cover the debt crisis of the smaller European countries – mainly the woes of Greece, Portugal, and Ireland. It will cover Greece's admission that its accounting didn't add up. And how Ireland's bad bank debt was turned into sovereign debt – which tripled its debt to GDP ratio in just three years. It will also cover the trajectory of peripheral sovereign bond yields in the face of investor uncertainty, where yields were first pushed above seven percent, and then eventually to much higher levels, forcing a rescue program.
The second part of the story will be about Italy and Spain, and potentially France, and how they were either pulled into the fiscal debt maelstrom or whether the ECB and euro area leaders were able to ring-fence them from the more troubled smaller euro countries. It will cover whether investors pushed these core countries from liquidity concerns to solvency concerns. While these chapters are still being written, the outcome may very well be available to historians (and investors) much sooner than many are expecting. One reason is because of the vast amount of sovereign and bank debt that is due to mature this year, all of which will needed to be rolled over because of existing budget deficits. The two countries that pose the greatest risks for rolling over this debt are Italy and Spain.
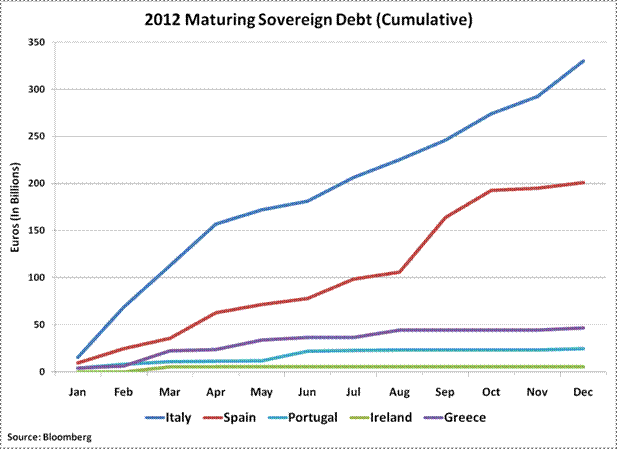
The chart below gives some sense of the relative importance of Italy – and to a slightly lesser degree Spain – in meeting its rollover demands this year versus the smaller euro area countries. The graph shows the cumulative amount of debt that will mature this year in the countries listed. (These totals count all government debt coming due – including shorter term notes – and are therefore larger than estimates of only long-term debt.) The graph shows the limited bond market needs (and therefore rescue funds needed) of Greece, Portugal, and Ireland, relative to those of Italy. Also, notice how steep the line is for Italy's maturing debt during the first four months of the year – when almost half of this year's total debt will mature.
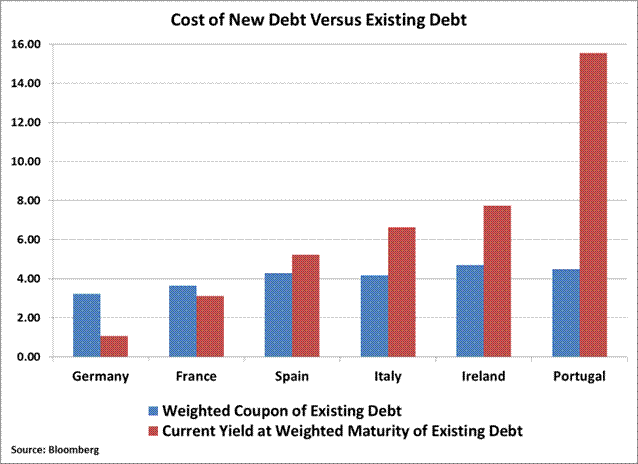
It will be important to watch bond auction demand in Italy and Spain in the beginning of the year. The recent bid to cover ratio – a measure of the eagerness of bond investor to participate in an auction – for Italy's 10-year notes has mostly been in line with results from early last year. Of course, the level of yield will also matter. The chart below shows the weighted coupon of the existing debt outstanding for each country (in blue) versus the current yield (using the weighted maturity of existing debt) of its bonds (in red). For many years during the Euro's first decade, borrowing costs continued to fall versus the average cost of the existing debt of these countries. This trend has now changed for most of Europe, except Germany and France. This will likely continue to further widen economic divergences among countries.
This is one more benefit Germany is deriving from the crisis. In addition to a weaker euro, which helps fuel its export-oriented economy, the cost of financing its sovereign debt relative to its existing debt continues to fall while the smaller countries struggle with rising financing costs.
3) The Depth of Italy's Recession
It would be difficult to overemphasize the importance of Italy retaining access to the bond markets, and mitigating further losses in its sovereign bonds. According to the Bank for International Settlements, foreign claims on Italian debt total $936 Billion – that's larger than the combined foreign claims on the debt of Portugal, Ireland, and Greece. And core Europe is long a mountain of Italian debt. French banks, for example, hold 45 percent of Italy's liabilities. Much more is at stake than France losing its Triple-A rating if Italy moves from a liquidity concern to a solvency concern.
What eventually would force that shift is if investors come to believe that the country's ability to handle its debt load over the long term is compromised. Those concerns can be partly alleviated if Italian Prime Minister Mario Monti delivers a balanced budget by 2013, which he promised this week. Unfortunately, near-term economic risks could make these goals difficult to meet in practice.
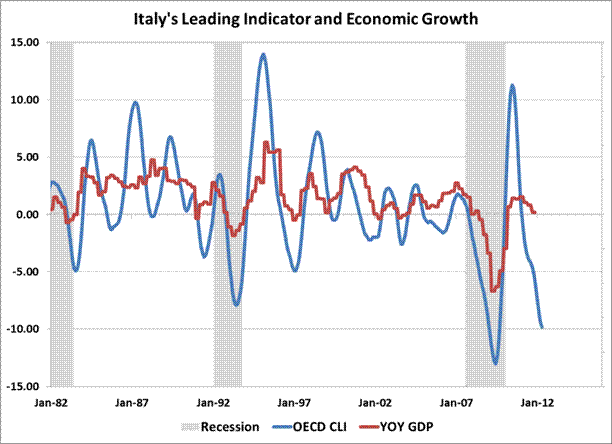
This year economists expect the Italian economy to contract only slightly – by 0.3%. The graph below shows the year-over-year change in the OECD composite leading indicator for Italy (lagged by six months) versus the year-over-year change in Italian GDP. The change in the leading indicator is currently -9.8 percent. That's suggesting a much deeper contraction in the Italian economy than current forecasts. Following any decline of greater than 5 percent in the year-over-year change of the leading indicator has led to an average contraction in the Italian economy of about 3 percent six months later.
Even assuming austerity measures might ease some of the country's debt load, it would be difficult to offset this steep of a decline in output. Hold debt levels static, and that rate of economic decline would force Italy's debt to GDP ratio to rise to 122% from 118% – clearly the wrong direction if the hope is to ease long-term solvency concerns.
Investors in Italian stocks may have moved some distance toward pricing in a deeper recession than what is currently expected by economists. The FTSE MIB Index declined 40 percent peak to trough last year (the index fell 25 percent on a calendar basis). But a deeper decline in Italy's economy this year that pushed debt to GDP ratios materially higher would likely catch bond investors' attention, and then ultimately the attention of global stock investors.
4) The ECB, LTROs and European Bank Funding
Will the ECB's three-year long-term refinancing operations (LTRO) work as a stealth quantitative easing program? Will banks borrow long-term funds from the ECB and turn around and buy sovereign debt? That's the hope. But there are strong tides of data pushing back against this idea.
While there was much fanfare last month after the ECB loaned 523 banks 489 billion euros, the actual amount of new funds was a more modest number. This is because two earlier loan programs expired on the same day as the three-year LTRO was held, and banks probably rolled these funds into the three-year operation. The earlier operations included a 3-month loan of 141 billion euros offered in September, and a net 112 billion euros of overnight loans. The ECB also allowed banks to shift 45 billion euros from an October operation into the 3-year LTRO. Of the 489 billion Euros operation, that left about 191 billion euros of fresh loans. (See this link for ECB euro operation results.)
Will this smaller figure be used by banks to buy sovereign debt? Any purchases will probably not in be in large amounts. That's because, as Bloomberg Economist David Powell recently pointed out, the 191 billion euros of new loans are less than the value of bank debt scheduled to come due this quarter alone. And with the unsecured debt markets essentially closed to many of these banks, the ECB loans will be needed to fund existing assets.
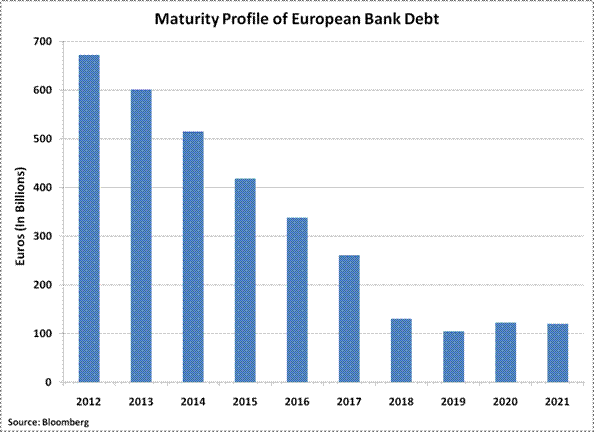
Up to 700 billion euros of European bank debt comes due this year, with about 200 billion euros coming due the first quarter, according to Bloomberg data. The financing needs coming due in the first quarter “imply that euro area banks will not have extra money as a result of the three-year auction to purchase European sovereign bonds, using a carry-trade strategy, because the amount of fresh cash is less than the amount of bank debt that will mature during the quarter”, Powell wrote recently.
Meanwhile, the ECB's balance sheet continues to grow. At 2.7 trillion euros, it's now levered 33 times to its own capital, versus a leverage ratio of 25 back in September. For investors holding out hope that the ECB becomes more involved in the debt crisis, it's clear that the central bank is already deeply involved.
As the size of the ECB's balance sheet grows, the quality of its collateral is declining. Open Europe, a Brussels-based think tank, estimates that through government bond purchases and liquidity provisions to banks, the ECB's exposure to Greece, Portugal, Ireland, Italy, and Spain has reached 705 billion euros, up from 444 billion euros in early summer - a 50 percent increase in six months (their note was published prior to the December 21 three-year LTRO, which likely further boosted lower quality collateral). They also remarked, “the number of banks which are becoming reliant on the ECB is alarming and hopes that the functioning of the European financial markets will ever return to normal are diminishing – creating a long-term threat to Europe's economy.”
5) Widespread Global Slowdown
Risks exist outside of Europe, too. Leading indicators suggest that the risks of a synchronized global downturn are building. (See John Hussman's recent discussion on this topic: When "Positive Surprises" Are Surprisingly Meaningless . ) The year-over-year changes in the OECD's Composite Leading Indexes for the United States, the United Kingdom, Japan, and Europe have all turned negative to varying degrees. Of these, the OECD's index that tracks Europe's major economies is declining at the fastest pace (-6.5), with the 12-month change in the US index falling just below zero in the latest release of the data.
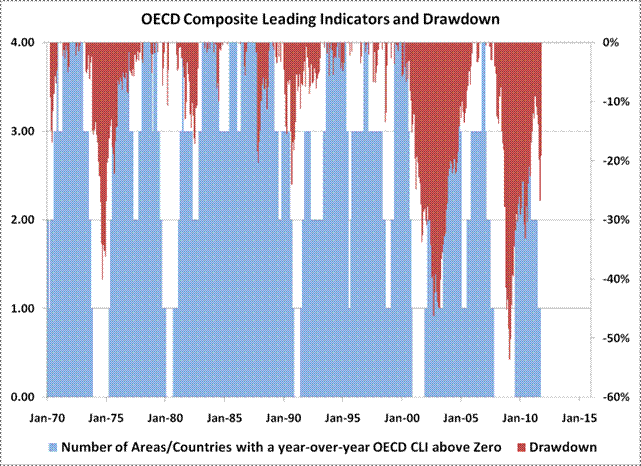
Now that negative leading indicator readings for these four major regions of the world are in place, stock market risks have climbed considerably. The graph below is one way to show the typical outcome when all of these leading indicators are negative. The red bars (right scale) represent drawdown – or the decline from each prior peak - in the MSCI World Index. The blue bars (left scale) are just a sum total of the number of regions where the year-over-year change in the OECD leading indicator is positive. The large blocks of blue areas reaching the top of the graph represent periods of widespread economic growth, such as the late-1980's and -1990's, when the leading indicators for all four regions were positive. The large blocks of white space represent those periods where economic contraction was widespread – such as in 1974, the early 1980's, in 2000, and in 2008. Importantly, the sum of positive leading indexes has dropped to zero once again.
Probably the best way to summarize this chart is that when the majority of developed economies have negative leading indicators on a year-over-year basis, investors should at least allow for large stock market declines. The declines beginning in 1974, 1990, 2000, and 2007 all began from periods when the leading indicators of all four regions had – or were about to - turn negative. The worst of those - 1974, 2000, and 2007 also began from very rich market valuations. The stock market collapse in 1987 is the only example of a large decline without at least some notification from the OECD's leading indicators of oncoming weakness. The 1980-1982 period, where global stocks fell more modestly, can be explained by the extremely low levels of valuation during that period, unlike today's higher levels.
The above global composite of OECD leading indicators also does a surprisingly good job of providing a coincident signal of US recession. Here are the dates where all four indicators first turned negative along with the actual month a US recession began in parenthesis: December 1973 (November 1973), February 1980 (January 1980), December 1990 (July 1990), December 2000 (March 2001), and November 2007 (December 2007). The indicator warned 5 months into the 1990 recession, and 3 months early in 2001, but within a month of each other recession (missing only the 1981 recession). This composite indicator turned negative with the October data.
Debt loads and economic growth vulnerability probably sum up this list of risks best. While these were topics investors focused on in 2011, this year will raise the stakes. Large quantities of debt will need to be rolled over and coincident indicators are likely to follow the currently downbeat leading ones. Both will need to be watched closely.

Mauldin: Europe and Sovereign Debt Economics; the Endgame Approaches -- Soon!

One of the interesting things about being in Hong Kong is that I get to see the weekend edition of the Financial Times 12 hours early. And the headlines were not all that pleasant. As I promised last week, we will cast our eyes to Europe and ponder what is in store for Europe for the year and the next five years. And what do we read on page 2? The "ECB raps revisions to draft a fiscal pact." Seems they feel there are too many loopholes, which will make the document meaningless … somewhat like the treaty they have now. And we further learn that "Greek default threat grows as talks falter." Seems there is a lack of agreement on how much of a haircut the investors ought to take, and the Greeks don't want to guarantee any future debt, just in case they need to default some more in the future. But they do want the €15 billion they need to keep the debt machine running for a few more months.
And on page 1, in big type, we are surprised (but not very) by the headline, "France and Austria face debt blow." Seems those sharp-eyed accountants over at S&P have decided to downgrade French debt from AAA. Which of course leads to another headline on page 2, suggesting "Firepower of bail-out fund cast into doubt." The currency markets were shocked – shocked I tell you – that S&P would do such a thing and promptly took back the euro rally and cast the euro down to recent cycle lows. Who knew, other than the entire free world not watching reality TV, that S&P was planning to do such a thing? And we read elsewhere that the European Commission is dismayed that S&P would do something so clearly not right, at least according to the way they keep their own books.
Even here in amazing Hong Kong, with the growth of China driving a wave of prosperity, eyes are fixed on Europe. How will they deal with the crisis? We read that US exports to Europe were down 7% last quarter, and Europe has not yet really entered into recession, which is almost guaranteed this year. And if US exports are down, then so are Asian and Latin American exports. Global growth appears to be threatened.

Solving the Mayan Code

There are so many pieces of data to go through in order to augur Europe's future – I want readers to know I have left no stone unturned! In fact, I went to some very old stones to get help with this week's letter. I began to scrutinize the Mayan Code from ancient Central America, which so many feel predicts the end of the world on December 21 of this year, bringing my fresh eyes to an old mystery.
After much deliberation, I have come to this astounding insight: The Mayan academics who created the code were not in fact astronomers or even astrologers. No, it is clear they were another breed of even more dubious forecasters, called economists. Once you approach the glyphs with that understanding, it becomes clear they are not predicting the end of the world, merely the end of Europe. One symbol clearly shows the Greek flag dipping to the ground. Another depicts the Italian flag with its wheels coming off. Oh, and you don't even want to know what they have prognosticated for the French. This is a family e-letter and I can't squeeze such language past the censors. But now that I have provided the basic insight, I leave it to you, fellow scholars, to decipher the rest of code.
And we will spend our time together here this week trying to discern what it means, in fact, for Europe to come to the place in its journey where it must make extremely difficult and often painful choices. As I wrote last week, as I started this voyage of discovery with you, the choices the various countries in the developed world are now making will put us on a path that does not allow us to turn back without severe consequences. (If you missed last week's letter, here it is.) We are left with debt that must be dealt with, with imbalances that must be balanced, and with deficits that must be brought under control. No matter what we choose, there will be pain for all of us. You cannot make debt go away without paying it back or defaulting, one way or the other, which means someone loses. And as we will see, paying it back can be very difficult, indeed, once it has grown this large.

To Solve the Crisis You Must Solve Three Problems

There are three main problems in Europe. The first is that most of the banks are massively insolvent, because they have 30 times their capital invested in the second problem, which is the sovereign debt of countries that are going to have trouble paying that debt. If the banks have to mark down the debt to what its real value is – or to what it will soon be – they will be bankrupt on a scale that makes 2008 look like a waltz in the park.
Countries simply cannot function in a manner that can be called normal without viable banking systems, which is why the authorities spend so much time worrying about them. If banks can't make loans, then businesses must cut back, which means fewer jobs, products, and services, which quickly becomes an ugly spiral. Losses in the private sector mount up. This obliges the treasury secretary to get on one knee and beg some elected official who has no understanding of how business and economics work to save the world as he knows it.
But if countries must step in and save their banks, then they have to assume some of the losses. (I am assuming that this time shareholders get completely wiped out, as do most bondholders. Taxpayers – read voters –are actually paying attention this time. They are in no mood to bail out bankers.) But most of the countries in Europe with the worst banks simply do not have the money to invest. They already have too much debt. Where do they get the capital? (More on that later.)
For most of the past two years, European leaders have tried to deal with the problems as though they were short-term liquidity problems: "If we just find the money to buy some more Greek bonds, then Greece can figure out how to solve its problems and then pay us back. Given enough time, the problem can get solved."
They have now arrived at the understanding that it this not a short-term problem. Rather, it's a solvency problem of the various governments, which of course creates a solvency problem for their banks. They are now addressing the problem of solvency and providing capital until such time as certain countries can get their budgets under control and the bond market sees fit to provide the capital they need.
But they are completely ignoring the third and largest problem, and that is massive trade imbalances. Germany exports products to the peripheral European countries, which run trade deficits. As I have shown in several letters, a country cannot reduce private-sector leverage, reduce public-sector leverage and deficits (balance its budget), and run a trade deficit all at the same time. That is simple, unavoidable math, based on 400 years of accounting understanding. Ultimately, there must be a trade surplus if leverage and debt are to be reduced.
Greece runs a trade deficit of about 10% of GDP. Until they can stop that bleeding, they cannot get their government and private budgets under control. It is not simply a matter of cutting budgets or raising taxes. Indeed, their economy will continue to shrink, making it more difficult buy foreign goods without increasing their own production of goods and services. It is a vicious spiral. And that same spiral will spin up to take in all of Europe. Again, more on that later, as we consider what their choices are.
But for now, let's start with my contention that if you do not solve all three problems you do not solve the real problem. Greece cannot "stand on its own" without a change in its cost of production relative to Northern Europe. Neither can Portugal, et al., unless Germany either changes how it exports and consumes more, or Germany is willing to fund Greek (and Portuguese and Italian and…) debt, so those countries can continue to run large deficits.
Let's resort to something I have done in the past, and that is to create a simple model to help us understand the issues involved. As always, when we make simple assumptions we are ignoring the real complexities. I know things are vastly more complicated than the following simple analogies, but the underlying truths are basically the same.

Getting Simple About Europe

Let's assume a country that has a gross domestic product (GDP) of $1,000. In the beginning it taxes its citizens about 25% of GDP and spends the money for the public's benefit. But alas, it spends about 30% of GDP, so it must borrow the overage (about $50) from its citizens or from the citizens of other countries. Because the country starts out with relatively little debt, interest rates on this loan are low, because those who buy the debt can easily see that the the country can pay them back. If the debt of the country is only 5% of GDP ($50) and the interest rate is 4%, then the amount that must be paid as interest is only about $2 per year. Not a whole lot, about 0.2% of GDP.
But this goes on year after year. Sometimes the deficits get smaller and sometimes they get larger, depending on the economy; but government expenditures grow at the same rate as the country grows, and the debt keeps growing at an average of 5% of GDP per year. Now, if the country is growing at 3% a year, after 24 years the economy will have doubled to $2,000 GDP. That means the debt has grown (roughly) to a total of $1,800, which is now a debt-to-GDP ratio of 90%. Debt has grown faster than the country's economy. Note that if the country had held its budget down to where it grew slower than GDP, thus reducing its need for debt, that ratio would be lower, even if the debt had grown. You can indeed grow your way out of a debt problem if the growth of government spending is less than the growth of the economy.
But what if the size of government grows to about 50% of GDP, rather than 25% or 30%, over the 24 years, as politicians decide to spend more money and voters decide they want more benefits? (Think France.) Then the private sector must pay about 50% of its production to the state – plus, the debt is now growing unwieldly. The private sector has less to invest in new businesses and tools, and the growth of the economy slows.
And then along comes a very nasty recession. The revenues of the government fall as the economy shrinks. If the economy shrinks by 3% and total taxes are 50%, then tax revenue falls to $970. But the government does not cut back; and indeed, because it must pay unemployment benefits and welfare (because unemployment rises in a recession), its expenses actually rise by 5%! So it now needs $1,050 to pay all its budgeted expenses. And it must now borrow $80 to pay everyone it has promised to pay, in addition to the $100 it was already borrowing every year to cover its deficit, or a total of $180 a year, which is 9% of GDP.
(Yes, I know that debt must change as a percentage over time and nothing is stagnant, but work with me here.)
Now debt-to-GDP is rising by about 5% a year. Not a large number in the grand scheme of things, and everyone knows that the recession will soon be over and the deficits will come down. Sovereign governments never default on their debts – our government leaders assure us of that. They can always raise taxes or cut spending, can't they?
And things rock along just fine, and the bond market continues to buy the debt, until one day you look up and the debt is 120% of GDP. Then the bond market gets nervous and says that instead of 4% it wants 7%. Now the interest payments are over 8% of GDP and 16% of government spending, which means the government must either cut back on services or salaries or benefits, or raise taxes, or borrow more money. But cutting spending and raising taxes have consequences. They reduce GDP growth over the following 4-5 quarters as the economy adjusts.
What if that interest rate cost rose to 10%? Then the interest cost to the government would become 20% of its expenses and be rising faster than the country could grow, even in the best of times. And if they continued to borrow at 7% and the country did not grow, those interest expenses would rise at least 7% a year – as long as interest rates didn't go up.
And what if the other countries who had been buying the government's debt looked at the basic math and realized that, another step or two down the current path of government spending, there was no way they would be able to get their money back?

How Much Risk Do You Want in a Government Bond?

Now, government bond investors are a curious breed. They invest in government bonds because they actually think there is not supposed to be any risk. They want their money to be safe. If they wanted risk, there are lots of opportunities to invest with the potential for more reward.
The moment that government bond investors begin to think they might be at risk, they leave. And history suggests they tend to leave seemingly all at once. It is the Bang! moment. Someone fires the starting gun, and they all head for the exits. They start selling their bonds to speculators at discounts, which makes the effective interest rates in the market rise, sometimes by a lot. That means that if a country wants to borrow more money, it will have to pay the effective price in the market, or maybe as much as 15-20% IF – a big IF – it can even get someone to buy the bonds, which of course makes it even more difficult to pay their debt as interest costs rise.
Now, let's add a twist. The other countries that have bought those bonds are not actually countries, but banks in other countries. And because the regulators of those banks knew it was impossible – inconceivable – that a sovereign country might default, they allowed their banks to buy 30 times as much sovereign debt as they had capital in their banks. They did not have to reserve against any losses, so these were "free" profits for the banks. You pay 2% on deposits or short term commercial paper and buy bonds paying at 4%. You make a 2% spread, which you then do 30 times. Now you are making 60% profits on your capital and deposits. It is a very nice business – as long as everyone pays the interest. And because it is such a good business, you just roll over the debt every time the bond comes due, because you want more easy profits.
Let's say that banks bought up to 10% of their total government sovereign-debt holdings in our problem country. If the country gets into trouble and says, we will only pay 50% of our debt (we will discuss why below), then that means the banks lose 5% of their total assets. But they only have about 3% capital, because they were allowed to leverage. That means they are functionally bankrupt.
Without a functioning banking system, other countries now have to step in and take the losses (and perhaps wipe out the shareholders and owners of their banks). That would be bad for the other countries, as that much spare cash is not just lying around in government coffers. They are ALL borrowing money already and have their own deficits to worry about.
So everyone gets together and they tell the bankrupt country (because that is what it really is), we will lend you more money to keep you alive, but you must agree to balance your budget. And since that is the only way the problem country can get more money, they initially say, "Sure. We can do that. Just give us some money now so we can get it figured out and get everything under control."
In the world of government, living within your means is called austerity. And it's an uphill slog. Let's say your deficit started out at 15% of GDP (somewhat like Greece's). If you agree to cut that deficit by 4% a year for four years running, if everything stays the same, you could be back in balance. But the other counties would have to agree to lend you the difference between what you budgeted to spend and what you took in as tax revenues. Just to keep things going. Otherwise you'd have to default on your debt. If the countries simply have to guarantee the loans and not actually spend the money, it is a lot easier than having to find real money to save their banks, so they agree.
But the cuts you have to make are not as easy as everyone hoped. It seems that employees don't like having their pay cut, and unions don't want pensions cut, and retirees certainly expect the government to fulfill its promises; and don't even get started on cutting healthcare, which is a God-given right.
So you raise taxes and cut spending by about 4% the first year. But a funny thing happens. That reduces the private economy by about 4%, so the base on which taxes are collected is reduced, which means less revenue is raised, which means that the deficit is much worse than projected. And then the following year you have to make another 4% in cuts, plus the last shortfall, just to make your plan and get to the agreed-upon deficit, in order to get more loan money. It becomes a very vicious circle.
And let's look at the endgame. That debt-to-GDP ratio will rise to at least 150%, while the economy is actually shrinking. If interest rates settle to a mere 7% (hardly likely), it means the people of the country are going to have to pay over 10% of their total production to foreign banks each and every year for decades, never mind paying down the principle.
Let's throw in one more twist. The country has been buying about 10% of GDP more from other countries than it sells to them. That is because the relative wages in the problem country are about 30% higher than in the "good" countries. The good countries get the money from what they sell and have a nice surplus. The problem country soon runs through its savings, trying to buy the goods and service it wants; and the private sector, as well as the government, must cut back.
What happens is that you are locking in what feels like a depression initially, and then you have a slow- or no-growth economy for many years, as so much of your work goes just to pay back that debt to the banks of other countries.
Understand, your government has freely obligated itself to pay that debt. But it means that its citizens in effect become debt slaves for a generation or two to foreign banks. Not a very popular platform for a politician to run on for re-election.
Long-time readers know I think the neo-Keynesians do not have a proper view of the world. They live in a theoretical world divorced from what really happens. But in this respect they are deadly right. Austerity on the scale needed by many countries will only reduce potential GDP. The Keynesian prescription is to therefore run deficits and borrow money until you get growth again; but when you have already exhausted your ability to borrow money, it just doesn't work.
More debt makes if far more difficult to grow your way out of the problem. If you are already drunk, you can't get sober by drinking more whiskey. If Greece cuts its deficit by 15% of GDP, the reality is that GDP over time will be reduced by about 20%, and the debt will grow, both in real terms and as a percentage of GDP. A 20% decline in GDP is by any standard a depression and makes it even harder to grow, as so much of what you do make has to go to basic expenses and not productive capital. And if you have the burden of massive debt it becomes damn near impossible.
That is why individuals can file for personal bankruptcy. We no longer force people into slavery or debtor's prison to pay their debts, at least in most places.
So our problem country goes to its lenders and says, "We think you should share our pain. We are only going to pay you back 50% of what we owe you, and you must let us pay a 4% interest rate and pay you over a longer period. We think we can do that. Oh, and give us some more money in the meantime. And if you refuse, we won't pay you anything and you will all have a banking crisis. Thanks for everything."
The difficult is that if our problem country A gets to cut its debt by 50%, what about problem countries B, C, and D? Do they get the same deal? Why would voters in one country expect any less, if you agree to such terms for the first country?
So now let's return to the real world of Europe. Greece cannot pay its debt without a major depression. So its wants to pay only 50%, but it doesn't even want to guarantee that in any meaningful way; so bondholders scream, "We get nothing in return for agreeing to take a 50% haircut?!" Which is today's headline.
Greece cannot print its own money, so unless it leaves the Eurozone, it's stuck. They can default on their debt, but that means they are shut out of the bond market for some period of time. That would force them to make the spending cuts they are now resisting, as they would simply not have enough money to pay their bills. Even with a 100% haircut they're looking at a shorter but very real depression. And because no one will sell them products they need, like energy and food and medicine, unless they can sell or trade something in return (that trade-deficit problem), they will be forced to change their lifestyles. Wages must drop or productivity rise to be competitive with northern Europe. And that differential is about 30%. I am not certain, as I have not been to Greece in a long time, but my bet is, you won't find many Greeks who think they are overpaid by 30%.
But that is what the market is going to say. And that is the third problem, which Europe is not addressing. Germany and the northern tier are simply more productive than the Southern periphery. (With the possible exception of Northern Italy, but Italy all gets lumped together, which is why many Northern Italians want to be their own country and not have to pay taxes that go to Southern Italy. I am not taking sides, just observing what we read in the papers.) Until Germany consumes more from the peripheral countries or the peripheral countries become more productive, the imbalance will not allow a positive solution.
Prior to the euro, the imbalances would be handled by currency exchange rates. The value of the drachma would go down relative to the value of the deutschmark. Things would balance over time. Now, all of the eurozone countries are effectively on a gold standard, with the euro standing in for gold this time. Britain, the US, and Japan print their own currencies. Their currencies can rise or fall over long periods of time, based on national accounts and the desires of foreigners to buy goods or invest in their countries.
Greece and the other peripheral countries face a difficult choice. Do we stay in the euro and pay as much as we can, and watch our economy drop; pay nothing and watch our economy drop (as we get shut out of the bond market); or leave the euro and go back to our own currency and watch our economy drop?
They have no choices that allow them to grow and prosper without first suffering (for perhaps a long time) some very real economic pain. As I have written in previous letters, leaving the eurozone has severe consequences; but the economic pain of leaving would go away sooner and allow for quicker adjustments, than if they stayed. However, the initial pain would be worse than the slow pain they'd suffer by staying in the euro. Their choice is, simply, which pain do they want – or maybe, which pain do they think they want? Because whatever they choose, they are not going to like it.
And just as I was finishing this section, this note came from Naked Capitalism:
"The three Troika inspectors—Poul Thomsen from the IMF, Mathias Morse from the EU, and Klaus Mazouch from the ECB—are supposed to head to Greece next week to inspect its books; the budget deficit is once again higher than the revised limit that Greece had vowed to abide by. And they're supposed to negotiate additional 'structural reforms.' But there probably won't be three inspectors, according to senior IMF sources. Missing: Poul Thomsen. The IMF has had enough.
"Already, according to more leaks, IMF Managing Director Christine Lagarde had warned German Chancellor Angela Merkel and French President Nicolas Sarkozy that the fiscal and economic situation in Greece had deteriorated. Hence, the 'voluntary' haircut on Greek bonds held by private sector investors should be increased to more than 50% to maintain the goal of bringing Greece's debt load down to 120% of GDP. And the second €130 billion bailout package, agreed upon on October 26, should be enlarged by 'tens of billions of euros.'
"The German reaction was immediate. 'There has to be a line somewhere,' said Michael Fuchs, deputy leader of Merkel's party, the CDU. 'This cannot be a bottomless barrel.' Even if Merkel were amenable to committing more taxpayer money to bail out Greece, she'd face a wall of opposition in her own party. And he wasn't brimming with optimism: 'I don't think that Greece, in its current condition, can be saved,' he said."
The article goes on with a description of the chaos in Greece. It is worse than I have described. Really. And so terribly sad.

Do You Have a Spare €1.5 Trillion?

Before I hit the send button this week, let's look at a few charts that can help us judge the current scope of the problem. These are from the very astute Bill Hester of the Hussman Funds. He wrote a very solid piece entitled "Five Global Risks to Monitor," at http://hussmanfunds.com/rsi/fiveglobalrisks2012.htm. It is very good, if sobering, reading.
This first chart shows how much bank debt is maturing in Europe over time. You have to add in how much new debt must be sold, as they will need to raise capital to balance the sovereign debt losses. Do you have a spare €1.5 trillion? Yes, some of that is rollover debt, but banks are trying to reduce their exposure to each other and may not want to roll over that debt, unless they can turn around and get capital from the European Central Bank to buy it, which is a back door to debt monetization.

The next chart shows how much debt must be rolled over by governments in the coming year. Notice how much Italy must raise in the first three months!

And one last chart from Hester. This is the rise in the cost of new debt as older, cheaper debt comes due. My simple example is not at all extreme.

Next week we will look further into Europe. As a preview, I do think this is the year they will be forced to the very hard decisions. We will examine what a fiscal union would look like and how likely it is to happen, and what the prospects are for a break-up of the eurozone, and compare several scenarios for what Europe may look like in five years.