
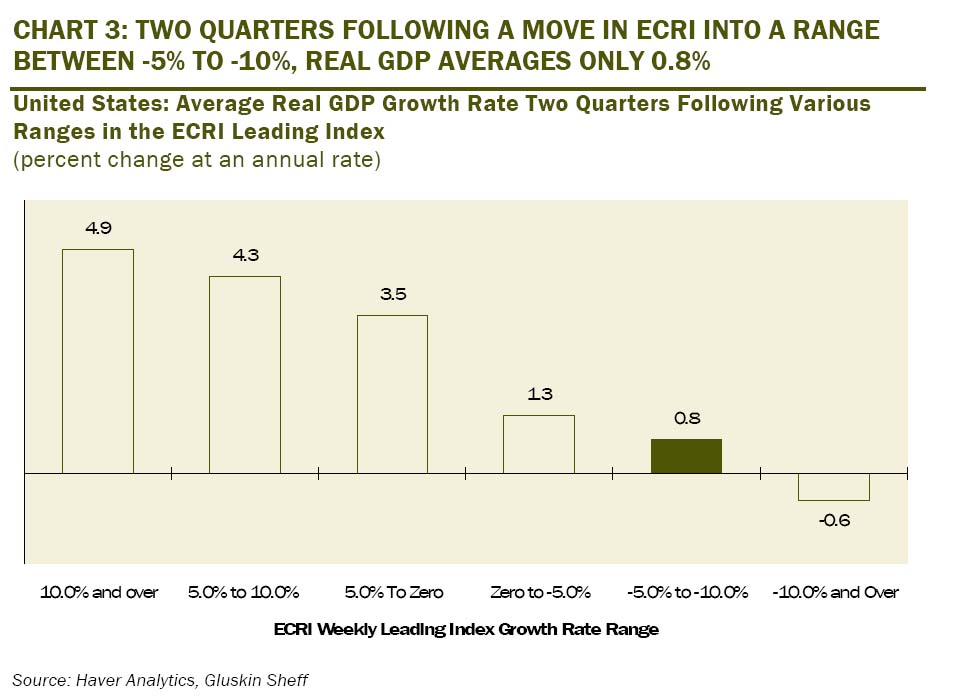
ECRI hit -10.5 yesterday, a level that has never been wrong in predicting a recession within 13 weeks. Here comes the double dip!
Friday, July 23, 2010
Thursday, July 22, 2010
American Economic Insecurity At 25-Year High
WASHINGTON (MarketWatch) -- Insecure about your finances? You're not alone. Economic insecurity in the U.S. is at its highest point in 25 years, according to a report released late Wednesday.
Almost one in five Americans are estimated to be insecure in 2010, compared with less than one in eight in 1985, according to the report from the New York-based philanthropy Rockefeller Foundation, and Jacob Hacker, a political science professor at Yale University."There is a clear long-term upward trend in the economic insecurity of American families," Hacker said in a statement.
"And while economic insecurity is substantially higher for less affluent and educated Americans than for other groups, it has risen across virtually all parts of American society -- it's an issue squarely confronting the American middle class."
The report defines the economically insecure as those whose available household income fell by at least 25%, after adjusting for inflation, from one year to the next due to a decline in household income, and/or an increase in out-of-pocket medical spending. The economically insecure also lack an adequate financial safety net.
Economic security fluctuates with the health of the general economy, according the report. "When the business cycle experiences an upturn, Americans' odds of suffering a large fall in income decreases," the report said. "But this cyclical pattern has been accompanied by a gradual rise in the overall prevalence of economic insecurity in good times as well as in bad."
The 'new normal'
Between downturns, economic security has not returned to prior levels, the report said. "The 'new normal' in each subsequent economic cycle has featured a higher level of economic insecurity," the report said.Economic security varies by income level. On average, among the poorest Americans, almost 21% "suffered a major economic loss" from one year to the next between 1997 and 2007, compared with a rate of about 12% for those in the richest households.
"In other words, lower-income households have roughly double the prevalence of economic insecurity, compared to those with the highest incomes," the report said.
The rise in large economic losses is due to higher indebtedness, out-of pocket medical costs, and a "gradual but clear rise in the chance of individuals experiencing large declines in their household income," the report said.
Since the 1970s, earnings for men have become more unstable, according to the report. "The rising prevalence of two-earner couples does not appear to have provided a big income cushion to families," the report said.
"This may reflect the fact that income gains for the middle class have been relatively muted over the period studied so that families are working harder for only modestly more income while facing large price increases for health care," the report said.
When looking at household type, the report said that individuals living alone have the lowest level of insecurity; next come households of at least two adults without kids; then households of at least two adults with kids; and finally single-parent households have the highest insecurity.
Going forward, the level of unemployment will be key in determining economic insecurity, Hacker said.
"When unemployment is higher," he said, economic insecurity "is higher."
We Aren't Better Off!
by Diana Furchtgott-Roth at RealClearMarkets.com:
WASHINGTON--With Wednesday's vote to extend eligibility for unemployment insurance benefits to 125 weeks, the Senate has just added $34 billion to the national debt. That's more than $500 million per senator who voted for the bill.
You can call it cover-up money, because these are many of the same Democratic senators who voted into law policies that threaten to destroy Americans' jobs to begin with, such as mandatory employer-provided health insurance. Now they're voting to send to President Obama, after the House of Representatives votes today, a small remedial package to assist workers who have been out of work for 99 weeks or longer.
Mr. Obama will sign it, his past statements notwithstanding. Obama Version 1.0 insisted on fiscal responsibility, that Congress find a way to pay for unemployment benefits. In November, 2009, he signed an extension of unemployment benefits into law and declared,
Fast forward eight months later: Obama Version 2.0 mocks Republicans for saying that unemployment benefit extensions have to be paid for. The $34 billion could have been paid for with unused stimulus money - about $362 billion remains - but the president opposed Republican suggestions to do just that.
Since the unemployment benefits extension is deemed "emergency spending'' under congressional budget rules, Congress does not have to pay for it. Ever.
The $34 billion brings the total unfunded level of unemployment benefits during this recession to $123 billion since July 2008.
Most Americans out of work for 99 weeks or more will be grateful to get the additional payments from the Federal-State unemployment insurance system, payments that some say will keep aggregate demand high and the economy chugging along, albeit slowly.
But the economy has little to show for the $152 billion spent on stimulus by President Bush in 2008, the $425 billion spent by Mr. Obama from 2009 to the present day, as well as the additional $86 billion for extending unemployment benefits since July 2008. Growth is slow, unemployment high.
What jobless men and women don't see is the discouraging effect government spending may have on job creation. These unemployed workers should ask their members of Congress:
(1) What have you done to make it easier for employers to hire workers?
(2) What have you done to make it more attractive to locate businesses in America rather than offshore?
(3) What have you done to lower taxes on employers who will consequently hire me, rather than going offshore where taxes may be lower?
(4) What have you done to reduce regulation and red tape so that employers are more likely to hire me rather than contract out to companies abroad?
Most of these 60 senators who voted to extend unemployment benefits support Obama administration policies that are dampening job creation, such as health care reform, financial regulation signed into law Wednesday, pending climate change legislation, and large spending projects such as high-speed rail. Democrats favor them, but such undertakings discourage employers from hiring.
Until the president and Congress abandon this costly interventionism, the economy won't produce the jobs needed to reduce unemployment significantly. In other words, more aggregate demand alone may be unnecessary and surely is not sufficient.
Take the new health care law, for instance. When it is fully phased in, the cost of health insurance will be higher, due to the generous mandated benefits. And every employer with more than 50 workers will either have to offer health insurance or pay an annual penalty of $2,000 per full-time worker. Small firms, those with 50 or fewer workers, will have a cost advantage.
Although small business is the engine of growth, firms with fewer than 50 workers won't want to add workers, and firms with around 60 to 70 workers will be trying to shrink to 50 workers to cut costs. Low-skill workers will be the worst affected.
The prospect of higher taxes, set to rise by five percentage points both at the top and the bottom of the income scale on January 1, 2011 unless Congress acts, discourages hiring now. So does the prospect of increases of capital gains and dividend taxation.
If members of Congress wished, they could have redesigned unemployment benefits to make them more effective. For instance, they could have given the unemployed relocation grants to move to areas of the country where there are more jobs. Senators could have voted for wage insurance, which would give people an incentive to take a new, lower-paying job by paying part of the difference between what they earned in a lost jobs and what the new jobs pays.
Such incentives were not debated. Most members of Congress have done absolutely nothing for the American worker, other than to guarantee their unemployment. They are misguided by inept advisors who know nothing about what it takes to employ workers in America.
Ronald Reagan said it best in 1980, "Are you better off today than you were four years ago?" For the American worker, the question to ask is "Are you better off today than you were two years ago?" And the answer is no.
Jobless Claims Rise Back Toward Moving Average
I feel for these people represented in this data. They are certainly being forgotten today!
The number of U.S. workers filing new claims for unemployment benefits rose last week by more than expected, reversing declines posted the prior week and signaling there is still little improvement in job market conditions.
In its weekly report Thursday, the Labor Department said the number of U.S. workers filing initial claims for jobless benefits increased by 37,000 to 464,000 in the week ended July 17. Economists surveyed by Dow Jones Newswires had expected claims would rise by 21,000.
The Tax Man Cometh Jan 1
Fiscal Policy: Many voters are looking forward to 2011, hoping a new Congress will put the country back on the right track. But unless something's done soon, the new year will also come with a raft of tax hikes — including a return of the death tax — that will be real killers.
Through the end of this year, the federal estate tax rate is zero — thanks to the package of broad-based tax cuts that President Bush pushed through to get the economy going earlier in the decade.
But as of midnight Dec. 31, the death tax returns — at a rate of 55% on estates of $1 million or more. The effect this will have on hospital life-support systems is already a matter of conjecture.
Resurrection of the death tax, however, isn't the only tax problem that will be ushered in Jan. 1. Many other cuts from the Bush administration are set to disappear and a new set of taxes will materialize. And it's not just the rich who will pay.
The lowest bracket for the personal income tax, for instance, moves up 50% — to 15% from 10%. The next lowest bracket — 25% — will rise to 28%, and the old 28% bracket will be 31%. At the higher end, the 33% bracket is pushed to 36% and the 35% bracket becomes 39.6%.
But the damage doesn't stop there.
The marriage penalty also makes a comeback, and the capital gains tax will jump 33% — to 20% from 15%. The tax on dividends will go all the way from 15% to 39.6% — a 164% increase.
Both the cap-gains and dividend taxes will go up further in 2013 as the health care reform adds a 3.8% Medicare levy for individuals making more than $200,000 a year and joint filers making more than $250,000. Other tax hikes include: halving the child tax credit to $500 from $1,000 and fixing the standard deduction for couples at the same level as it is for single filers.
Letting the Bush cuts expire will cost taxpayers $115 billion next year alone, according to the Congressional Budget Office, and $2.6 trillion through 2020.
But even more tax headaches lie ahead. This "second wave" of hikes, as Americans for Tax Reform puts it, are designed to pay for ObamaCare and include:
The Medicine Cabinet Tax
The HSA Withdrawal Tax Hike. "This provision of ObamaCare," according to ATR, "increases the additional tax on nonmedical early withdrawals from an HSA from 10% to 20%, disadvantaging them relative to IRAs and other tax-advantaged accounts, which remain at 10%."
Brand Name Drug Tax. Makers and importers of brand-name drugs will be liable for a tax of $2.5 billion in 2011. The tax goes to $3 billion a year from 2012 to 2016, then $3.5 billion in 2017 and $4.2 billion in 2018. Beginning in 2019 it falls to $2.8 billion and stays there. And who pays the new drug tax? Patients, in the form of higher prices.
Economic Substance Doctrine. ATR reports that "The IRS is now empowered to disallow perfectly legal tax deductions and maneuvers merely because it judges that the deduction or action lacks 'economic substance.'"
A third and final (for now) wave, says ATR, consists of the alternative minimum tax's widening net, tax hikes on employers and the loss of deductions for tuition:
• The Tax Policy Center, no right-wing group, says that the failure to index the AMT will subject 28.5 million families to the tax when they file next year, up from 4 million this year.
• "Small businesses can normally expense (rather than slowly deduct, or 'depreciate') equipment purchases up to $250,000," says ATR. "This will be cut all the way down to $25,000. Larger businesses can expense half of their purchases of equipment. In January of 2011, all of it will have to be 'depreciated.'"
• According to ATR, there are "literally scores of tax hikes on business that will take place," plus the loss of some tax credits. The research and experimentation tax credit will be the biggest loss, "but there are many, many others. Combining high marginal tax rates with the loss of this tax relief will cost jobs."
• The deduction for tuition and fees will no longer be available and there will be limits placed on education tax credits. Teachers won't be able to deduct their classroom expenses and employer-provided educational aid will be restricted. Thousands of families will no longer be allowed to deduct student loan interest.
Then there's the tax on Americans who decline to buy health care insurance (the tax the administration initially said wasn't a tax but now argues in court that it is) plus a 3.8% Medicare tax beginning in 2013 on profits made in real estate transactions by wealthier Americans.
Not all Americans may fully realize what's in store come Jan. 1. But they should have a pretty good idea by the mid-term elections, and members of Congress might take note of our latest IBD/TIPP Poll (summarized above).
Fifty-one percent of respondents favored making the Bush cuts permanent vs. 28% who didn't. Republicans were more than 4 to 1 and Independents more than 2 to 1 in favor. Only Democrats were opposed, but only by 40%-38%.
The cuts also proved popular among all income groups — despite the Democrats' oft-heard assertion that Bush merely provided "tax breaks for the wealthy." Fact is, Bush cut taxes for everyone who paid them, and the cuts helped the nation recover from a recession and the worst stock-market crash since 1929.
Maybe, just maybe, Americans remember that — and will not forget come Nov. 2.
Euro Rally May Be Temporary
from WSJ:
Investors' recent romance with the euro may just be a summer fling.
Before taking a midafternoon slide Wednesday, the euro had advanced more than 9% on the dollar since June 7, climbing to $1.30 this week from a four-year low of just under $1.19.
The euro benefited from some improved sentiment toward Europe: worries about the region's sovereign debt woes have eased and investors are anticipating that stress tests on European banks will allay fears of a meltdown in the banking system.
But many say the euro has been more a reflection of concerns about the U.S. economy than optimism
Stocks: BUY!

Home Sales Plunge 5.1%
WASHINGTON (MarketWatch) - Resales of U.S. homes fell 5.1% in June to a seasonally adjusted annual rate of 5.37 million after a federal subsidy for home buyers ended, the National Association of Realtors estimated Thursday. Economists surveyed by MarketWatch were expecting sales to fall about 10% to a 5.10 million annual pace. Inventories of unsold homes increased 2.5% to 3.99 million in June, representing an 8.9-month supply, the highest since August 2009. In coming months, the supply is expected to rise above 10 months, putting downward pressure on prices, said Lawrence Yun, chief economist for the real estate agents' lobbying and advocacy organization.
Wednesday, July 21, 2010
Stocks: SELL!


$3.7 Trillion Bailout Balloon
* Total US govt financial system support seen at $3.7 trln
* US support swells by $700 bln in past year-watchdog
* Mortgage, housing commitments account for most of rise
* TARP watchdog criticizes Obama housing rescue efforts
By David Lawder
WASHINGTON, July 21 (Reuters) - Increased housing commitments swelled U.S. taxpayers' total support for the financial system by $700 billion in the past year to around $3.7 trillion, a government watchdog said on Wednesday.
The Special Inspector General for the Troubled Asset Relief Program said the increase was due largely to the government's pledges to supply capital to Fannie Mae (FNMA.OB) and Freddie Mac (FMCC.OB) and to guarantee more mortgages to the support the housing market.
Increased guarantees for loans backed by the Federal Housing Administration, the Government National Mortgage Association and the Veterans administration increased the government's commitments by $512.4 billion alone in the year to June 30, according to the report.
"Indeed, the current outstanding balance of overall Federal support for the nation's financial system...has actually increased more than 23% over the past year, from approximately $3.0 trillion to $3.7 trillion -- the equivalent of a fully deployed TARP program -- largely without congressional action, even as the banking crisis has, by most measures, abated from its most acute phases," the TARP inspector general, Neil Barofsky, wrote in the report.
The total includes Federal Reserve programs and a myriad of asset guarantees, including Federal Deposit Insurance Corp. protection for bank deposits.
The increased government commitments more than offset about a $300 billion decline in the U.S. Treasury's TARP commitments in the past year as programs have closed and banks have repaid taxpayer funds.
HOUSING PROGRAMS CRITICIZED
Barofsky also in the report ramped up his criticism of the Treasury's housing relief efforts, saying that its program to reduce monthly mortgage payments for struggling homeowners was showing "anemic" participation numbers and had failed to "put an appreciable dent in foreclosure filings."
He said Treasury had refused his repeated recommendations to announce more effective goals and benchmarks for its mortgage modification program, which could reach up to $50 billion in TARP funds.
"Treasury's refusal to provide meaningful goals for this important program is a fundamental failure of transparency and accountability that makes it far more difficult for the American people and their representatives in Congress to assess whether the program's benefits are worth its very substantial cost," Barofsky wrote.
Among other recommendations repeated in the report, Barofsky called for the Treasury to consider making its voluntary mortgage principal reduction program mandatory, saying this would make it less likely for "underwater" homeowners to abandon their properties.
The Treasury has declined to adopt the recommendation, citing the prospect that mandatory principal reduction would cause mortgage servicing firms to opt out of the program and fairness issues in reducing principal for both responsible homeowners hit by value declines and homeowners who overleveraged their properties in refinancings.
U.S. Treasury officials defended the Home Affordable Modification Program, saying that it was still on track to reach its goal to keep 3 million to 4 million homeowners in their homes by the end of 2012 and was adapting to changing conditions by offering forbearance to unemployed people and extra funding for the hardest-hit markets.
Herbert Allison, Treasury assistant secretary for financial stability, said the Treasury often agrees with Barofsky's recommendations, "but once in a while, we differ on what type of policy will best carry out our mandate."
The report provoked swift criticism of Obama administration housing policies from U.S. Rep. Darrell Issa, a California Republican who has taken every opportunity to blast the Treasury's handling of financial bailout programs.
"The fact that the Obama administration is treating TARP like its own personal slush-fund is beyond egregious and a complete betrayal of what the American people were told would be then when their tax-dollars were used to bailout Wall Street," Issa said in a statement, adding that the housing efforts were "dumping good money after bad". (Reporting by David Lawder; Editing by Kazunori Takada)
Tuesday, July 20, 2010
Housing Headed Toward the Basement Again
The housing market, whose collapse pulled the economy into recession in late 2007, is stalling again.
In major markets across the country, home sales are deteriorating, inventories of unsold homes are piling up and builders are scaling back construction plans. The expiration of a federal home-buyers tax credit at the end of April is weighing on the market.
Where Housing Is Headed
![[HAGERTY_promo07]](http://si.wsj.net/public/resources/images/OB-JH795_HAGERT_D_20100720164627.jpg)
Future construction looks even weaker. Permits for single-family starts fell 3% in June, following big declines in both May and April. "We're hovering at post-World War II lows," said Ivy Zelman, president of Zelman & Associates, a research firm.
Access thousands of business sources not available on the free web. Learn More
While the housing downturn dragged the economy into a recession nearly three years ago, now it is the economy that is pulling down housing, says economist Patrick Newport at IHS Global Insight. Without sustained job growth, the housing market likely won't improve. That in turn will ricochet across manufacturing, retail and other trades heavily dependent on home building and consumer spending.
The Wall Street Journal's quarterly survey of housing-market conditions in 28 major metropolitan areas shows that inventory levels have grown in many markets. But inventory fell in some of the weakest ones, including several Florida markets, Atlanta, and Charlotte, N.C.
At the end of June, inventory was up 33% from year-ago levels in San Diego, and by 19% and 15% in Los Angeles and Orange County, Calif., respectively, according to data compiled by John Burns Real Estate Consulting. Rising inventory can lead to price declines later.
Jeff Gans, a 45-year-old engineer from Baltimore who designs software for car manufacturers, has contemplated buying a house or condo for more than a year. But concerns about job stability have kept him on the sidelines.
Even falling interest rates aren't enough to whet consumer appetites for housing. Last week, the average rate on a 30-year fixed-rate mortgage was quoted at 4.57%, according to Freddie Mac, the lowest since its survey began in 1971. But demand for home-purchase mortgages sits near 14-year lows, according to the Mortgage Bankers Association, down 44% over the past two months.
The government last fall extended tax credits worth up to $8,000 to home buyers who signed contracts by April 30, causing sales to surge early this year. Those buyers had until June 30 to close their sales until Congress, concerned that the backlog of sales wouldn't close in time, extended the deadline through September.
Analysts long expected the withdrawal of a federal tax credit, which had juiced sales, to lead to a slower-than-usual summer.
"It's the magnitude that's been the issue,'' says Douglas Duncan, chief economist at Fannie Mae. "The drop-off in activity has surpassed expectations.''
Reports should show that completed transactions of home sales held up through June. But newly signed contracts in May and June have plunged.
To be sure, some housing markets show signs of healing. Home-sales activity in New York, Washington, D.C., and parts of California continue to improve. But other markets, including Tampa, Fla., and Chicago, face rising foreclosures and weak job growth.
Low mortgage rates and falling prices have made homes more affordable in many markets than at any time in the past decade. But those affordability gains have been offset for many buyers by tighter lending standards, particularly for "jumbo" loans that are too large for government backing. Banks are requiring down payments of 20% and more and strong credit scores because they must hold jumbo loans in their portfolios.
More broadly, the housing market faces two big problems: too many homes and falling demand. More than seven million borrowers are 30 days or more past due on their mortgage payments or in some stage of foreclosure. Rising foreclosures will keep pressure on prices as banks put more homes on the market.
Last month, nearly 39,000 borrowers received government-backed loan modifications, but more than 90,000 borrowers fell out of the program, the Obama administration said on Tuesday.
Moreover, the pool of potential buyers remains constrained by the unprecedented number of homeowners who are underwater, or who owe more than their homes are worth.
That's making it particularly hard for traditional "trade up" homeowners like Maria Billis to pull the trigger on a home purchase. Ms. Billis can't sell her townhouse in Boynton Beach, Fla., because its value has fallen by a quarter. That puts it below the $160,000 that she owes the bank.
![[HOUSING]](http://sg.wsj.net/public/resources/images/P1-AW340_HOUSIN_NS_20100720193225.gif)
Mortgage-finance giants Fannie Mae and Freddie Mac also are starting to push more repossessed homes onto the market. The companies owned 164,000 homes at the end of March, up 80% from a year ago.
Another reason inventory is rising: "Unrealistic sellers have flooded the market" after reports of bidding wars and home-price increases earlier in the year, says Steven Thomas, president of Altera Real Estate, a brokerage in Orange County. The amount of time that homes there have sat on the market there has swelled to 3.78 months, up from 2.35 months in April.
"The sellers think the market's coming back. They've tacked on an extra 5 to 10 to 15%. The buyers aren't going for it," says Jim Klinge, a real-estate agent in Carlsbad, Calif. Over the next six months, "it's going to feel like a double-dip because sellers are going to have to lower their prices."
Not all sellers will take that step. Jerry Anderson has listed his four-bedroom home in Dana Point, Calif., on and off the market for the last two years. He's cut the price to $1.25 million, down from $1.75 million, but hasn't had any offers on the home, which has four bedrooms, three fireplaces and ocean views.
Mr. Anderson, who bought the home in 1987, says he'll take it off the market in December if it doesn't sell rather than cut the price.
Matt Carney listed his Moreno Valley, Calif., home for $337,000 in February, and lowered the price on Tuesday for the third time, to $297,000. He says he can't go any lower because he owes $274,000 on the home and doesn't want to dip into savings to pay for transaction costs.
Force-"Fed" Loans Lift Market

NEW YORK (MarketWatch) -- The U.S. stock market drew a Tuesday afternoon lift from speculation the Federal Reserve was readying to announce an effort to force banks to lend more. The talk involves the idea that the central bank would stop paying interest on reserves where it is currently paying 0.25%, according to Peter Boockvar, equity strategist at Miller Tabak. But Boockvar dismissed the talk, saying he doubted the Fed would use its "last bullet" so soon. Down 140 points earlier on, the Dow Jones Industrial Average /quotes/comstock/10w!i:dji/delayed (DJIA 10,177, +22.18, +0.22%) was lately up 16.39 points at 10,170.82.

Disappointing Earnings Tilt Stocks South
IBM, Goldman Sachs (down 82%), and Pepsico are being blamed this morning.

Monday, July 19, 2010

Sunday, July 18, 2010
Roubini: Prepare "for a Very Bumpy Ride"
The global economy, artificially boosted since the recession of 2008-2009 by massive monetary and fiscal stimulus and financial bailouts, is headed towards a sharp slowdown this year as the effect of these measures wanes. Worse yet, the fundamental excesses that fueled the crisis – too much debt and leverage in the private sector (households, banks and other financial institutions, and even much of the corporate sector) – have not been addressed.
Private-sector deleveraging has barely begun. Moreover, there is now massive re-leveraging of the public sector in advanced economies, with huge budget deficits and public-debt accumulation driven by automatic stabilizers, counter-cyclical Keynesian fiscal stimulus, and the immense costs of socializing the financial system’s losses.
At best, we face a protracted period of anemic, below-trend growth in advanced economies as deleveraging by households, financial institutions, and governments starts to feed through to consumption and investment. At the global level, the countries that spent too much – the United States, the United Kingdom, Spain, Greece, and elsewhere – now need to deleverage and are spending, consuming, and importing less.
But countries that saved too much – China, emerging Asia, Germany, and Japan – are not spending more to compensate for the fall in spending by deleveraging countries. Thus, the recovery of global aggregate demand will be weak, pushing global growth much lower.
The global slowdown – already evident in second-quarter data for 2010 – will accelerate in the second half of the year. Fiscal stimulus will disappear as austerity programs take hold in most countries. Inventory adjustments, which boosted growth for a few quarters, will run their course. The effects of tax policies that stole demand from the future – such as incentives for buyers of cars and homes – will diminish as programs expire. Labor-market conditions remain weak, with little job creation and a spreading sense of malaise among consumers.
The likely scenario for advanced economies is a mediocre U-shaped recovery, even if we avoid a W-shaped double dip. In the US, annual growth was already below trend in the first half of 2010 (2.7% in the first quarter and estimated at a mediocre 2.2% in April-June). Growth is set to slow further, to 1.5% in the second half of this year and into 2011.
Whatever letter of the alphabet US economic performance ultimately resembles, what is coming will feel like a recession. Mediocre job creation and a further rise in unemployment, larger cyclical budget deficits, a fresh fall in home prices, larger losses by banks on mortgages, consumer credit, and other loans, and the risk that Congress will adopt protectionist measures against China will see to that.
In the eurozone, the outlook is worse. Growth may be close to zero by the end of this year, as fiscal austerity kicks in and stock markets fall. Sharp rises in sovereign, corporate, and interbank liquidity spreads will increase the cost of capital, and increases in risk aversion, volatility, and sovereign risk will undermine business, investor, and consumer confidence further. The weakening of the euro will help Europe’s external balance, but the benefits will be more than offset by the damage to export and growth prospects in the US, China, and emerging Asia.
Even China is showing signs of a slowdown, owing to the government’s attempts to control economic overheating. The slowdown in advanced economies, together with a weaker euro, will further dent Chinese growth, bringing its 11%-plus growth rate towards 7% by the end of this year. This is bad news for export growth in the rest of Asia and among commodity–rich countries, which increasingly rely on Chinese imports.
An important victim will be Japan, where anemic real income growth is depressing domestic demand and exports to China sustain what little growth there is. Japan also suffers from low potential growth, owing to a lack of structural reforms and weak and ineffective governments (four prime ministers in four years), a large stock of public debt, unfavorable demographic trends, and a strong yen that gets stronger during bouts of global risk aversion.
A scenario in which US growth slumps to 1.5%, the eurozone and Japan stagnate, and China’s growth slows below 8% may not imply a global contraction, but, as in the US, it will feel like one. And any additional shock could tip this unstable global economy back into full-fledged recession.
The potential sources of such a shock are legion. The eurozone’s sovereign-risk problems could worsen, leading to another round of asset-price corrections, global risk aversion, volatility, and financial contagion. A vicious cycle of asset-price correction and weaker growth, together with downside surprises that are not currently priced by markets, could lead to further asset-price declines and even weaker growth – a dynamic that drove the global economy into recession in the first place.
And one cannot exclude the possibility of an Israeli military strike on Iran in the next 12 months. If that happens, oil prices could rapidly spike and, as in the summer of 2008, trigger a global recession.
Finally, policymakers are running out of tools. Additional monetary quantitative easing will make little difference, there is little room for further fiscal stimulus in most advanced economies, and the ability to bail out financial institutions that are too big to fail – but also too big to be saved – will be sharply constrained.
So, as the optimists’ delusional hopes for a rapid V-shaped recovery evaporate, the advanced world will be at best in a long U-shaped recovery, which in some cases – the eurozone and Japan – may be long enough to stretch into an L-shaped near-depression. Avoiding double dip recession will be difficult.
In such a world, recovery in the stronger emerging markets – the great hope for the global economy – will suffer, because no country is an island economically. Indeed, growth in many emerging-market economies – starting with China – is highly dependent on retrenching advanced economies.
Fasten your seat belts for a very bumpy ride.
$1 In Debt for Every $1 in Revenue
In his Friday commentary piece "Tax and Spend. And Spend", Nicholas Colas of BNY ConvergEx read our mind and posted this concise summary on the comparison between 2009 and 2010 tax withholdings, and the unique dynamics thereof. Whereas we will present a detailed analysis of this comparison shortly as there have been numerous interesting themes to discuss, we present the following piece from Colas as a great backdrop to our soon to be posted results. And for all those claiming the tax picture in the US is improving (we are looking at you Daniel Gross), here is the simple reality of the situation: "Simply put, for every $1 of proceeds from taxpayers, the Federal government issues more than $1 in new debt." Must read for all "improvement-ists", especially since Colas references the holy grail of all financial reporting: our all time favorite necessary and sufficient DTS.
Tax and Spend. And Spend.
Summary: You may not look at them very often, but that myriad of deductions on your paystub (who knows what OASDI even is?) are actually a powerful – and overlooked – tool to understand the state of the U.S. economy. The U.S. Treasury publishes a daily report that includes how much it is receiving in “withheld income and employment taxes”, making this a virtually real-time look at labor markets and trends in wages. The good news: individual withholding/tax receipts are virtually flat to last year for the first half of 2010, up 0.2% to $845.3 billion. Even though the Bureau of Labor Statistics estimates there are 900,000 fewer workers now than a year ago, tax receipts are flat, which means wages are up close to 1%. The bad news: the U.S. has issued $892 billion of incremental Federal debt over the same period. The country has some modest offsets – corporate taxes are recovering, but year-to-date revenues from this source are only $149 billion. Simply put, for every $1 of proceeds from taxpayers, the Federal government issues more than $1 in new debt.
My undergraduate degree was Near Eastern Archeology, so I enjoy finding little pieces of the past in ordinary modern life. Yesterday was payday at ConvergEx, and in perusing the twice-monthly paystub I found such a historical artifact. It is probably on your paycheck as well, labeled “OASDI.” It stands for Old Age, Survivors, and Disability Insurance. A neatly non-politically correct phrase there, and not surprisingly so, given that the term goes all the way back to the Great Depression. Now it would probably be called something else, but its archaic, 1930s name has stuck and everyone with a paycheck has a hidden reminder of a time when the country’s older citizens often lived in the most meager of conditions. You know OASDI by its other name – Social Security.
The U.S. Treasury collects not only Social Security, but Medicare and Federal Tax Withholding on a daily basis. It also publishes a report containing not only these receipts, but also corporate tax payments, proceeds from bond issuance, and all the major categories of the Federal budget. You can see it here:
https://www.fms.treas.gov/dts/index.html
We find the Treasury’s Daily Statement especially illuminating because it publishes exactly how much money it is receiving from the taxpayers of America each and every day. Since the vast majority of the “Withheld Income and Employment Tax” line comes from payrolls, it is in effect a very reliable barometer of current employment and wage trends. Far better, to my thinking, than the endlessly revised monthly Employment Situation report or the seasonally adjusted weekly Initial and Continuing Claims for Unemployment.
For the first six months of 2010, “Withheld Income and Employment Taxes” – and by extension the U.S. labor market - is essentially flat with last year’s first half, up 0.2%. That fits with some of the less robust data we alluded to above – the U.S. workforce is basically stagnant year-on-year at 139 million employed Americans. Strictly by the BLS data, there are actually 919,000 fewer employed people now than last year, so the up 0.2% actually shows that wages are up about 1.0%. And if you want to get really wonk-ish with the numbers, the first half of last year had some modestly higher withholding rates, equivalent to about 1.0% more wage growth in 2010. But no matter how finely you cut the data, the upshot is pretty clear – the labor market is about the same place it was in 2009. Disappointing, given the rafts of monetary and fiscal stimulus injected into the economy, but that’s where we are.
As for corporate tax receipts, these are on a better upswing for the year-to-date, up 33% for the first six months versus the same period last year. That speaks to better corporate profitability thanks to stringent cost cutting/layoffs in 2009. The fly in the ointment, as it where, is that what you learned in economics class is pretty much true: companies do not pay taxes. At least not very much of them. For the first half of 2010 Treasury booked $148 billion of corporate taxes. Individual taxpayers – people, not companies, paid almost six times this amount - $845 billion – in the first half of the year.
This leads us to a second reason why the Daily Treasury Statement is a useful document – it shows the degree to which the Federal budget squares up in terms of inflows and outflows. Think of it as Uncle Sam’s checking account. I think we all know the picture isn’t pretty here, but a few points to put some context around the problem.
- We already know several important numbers – “people” tax receipts YTD of $845 billion and “corporate” tax receipts of $148 billion. Tax refunds for the calendar year thus far have been $371 billion, mostly to individuals. So the country’s tax receipts, round numbers, are $622 billion year to date. There are some miscellaneous other income lines – excise taxes primarily, that add about $35 billion. Total, total: $657 billion in taxes/withholding.
- In the same period of time – the first 180 days of 2010 – the U.S. Treasury has issued some $892 billion in incremental debt. Almost all of it was issued to the public, rather than the customary practice of selling a piece to the Social Security system. That was not by choice – the reduced amount of withholding we outlined above means that Social Security has not had any material inflows of new money to invest in 2010. So all that newly issued debt – much of which went out as short term Treasury Bills – will need to be “rolled” as it matures. That means it has to find new buyers every 3, 6, 9 or 12 months.
Economics is the study of how societies allocate inherently scarce resources. Even this brief outline of taxation and government spending makes me think that the scarcest resource of all might just be common sense.
Subscribe to:
Posts (Atom)


