
John P. Hussman, Ph.D.
All rights reserved and actively enforced.
Reprint Policy
Goat Rodeo - Appalachian slang for a chaotic, high-risk, or unmanageable scenario requiring countless things to go right in order to walk away unharmed.
Over the years, of the most frequent phrases in these weekly comments has been "on average." Most of the investment conditions we observe are associated with a mix of positive and negative outcomes, so rather than making specific forecasts about future market direction, we generally align our investment position in proportion to the average return/risk outcome, recognizing that the actual outcome may be different than that average in any particular instance.
Increasingly however, we have observed sets of conditions that are so heavily skewed toward bad outcomes that they deserve the word "warning" (see Extreme Conditions and Typical Outcomes near the 2011 peak, Don't Mess with Aunt Minnie before the 2010 market break, Expecting a Recession in late 2007, A Who's Who of Awful Times to Invest at the 2007 market peak, and our shift from a modestly constructive investment position to a Crash Warning in October of 2000). While the downturns that followed have provoked increasingly large and desperate actions of central banks to kick the can down the road by preventing debt restructuring and financial deleveraging (in some cases by violating legal constraints - see The Case Against the Fed ), the fact is that the S&P 500 has achieved a total return of just 1.2% annually over the past 12 years, as a predictable outcome of rich valuations and still-unresolved economic imbalances.
I could admittedly do better, and would certainly have captured more upside from temporary speculation, had I committed myself to the principle that central banks will act strictly to defend the bondholders of the banks they represent, even if it means trespassing into fiscal policy, subordinating public interest, empowering the worst stewards of capital, violating legal restrictions, and inviting long-term instability. Still, none of those actions improve the long-term outcome for the markets, and more importantly, none have prevented repeated and serious downturns from occurring, despite all the can-kicking.
Once again, we now have a set of market conditions that is associated almost exclusively with steeply negative outcomes. In this case, we're observing an "exhaustion" syndrome that has typically been followed by market losses on the order of 25% over the following 6-7 month period (not a typo). Worse, this is coupled with evidence from leading economic measures that continue to be associated with a very high risk of oncoming recession in the U.S. - despite a modest firming in various lagging and coincident economic indicators, at still-tepid levels. Compound this with unresolved credit strains and an effectively insolvent banking system in Europe, and we face a likely outcome aptly described as a Goat Rodeo.
My concern is that an improbably large number of things will have to go right in order to avoid a major decline in stock market value in the months ahead. We presently estimate that the S&P 500 is likely to achieve a 10-year total return (nominal) of only about 4.7% annually, which reduces the likelihood that further gains will be durable even if they persist for a while longer. In the context of present valuations and a probable Goat Rodeo in the months ahead, my impression is that the recent market advance may be a transitory gift.
Whipsaws, Noise and Exhaustion
In nearly all real-world data, there are short-term fluctuations, random effects, and other influences that create "noise" in the values that we observe. Typically, those sources of noise confound the "signal" that we want to identify, so unless the noise is filtered away, there is a risk of being misled by meaningless short-term fluctuations. In finance, there are countless approaches that essentially involve noise reduction. For example, a moving average is just a simple noise-reduction technique, where very short-term fluctuations ("high frequency components") are averaged away, leaving the smoother influence of longer-term fluctuations. Similarly, the Coppock Curve - the 10-month exponential smoothing of the averaged 11-month and 14-month rate of change of the market - is really just a "low-pass" filter that cuts away high frequency fluctuations and allows the market's long-term (low frequency) cycles to pass through.
In late October, I noted a condition that we characterize as a Whipsaw Trap - which essentially involves a breakdown in a broad set of market internals, followed by a recovery driven by some of the more volatile components (sectors such as financials and transportation stocks are good examples). I noted that only about 30% of these whipsaw traps were followed by further advances - a statistic that was based on subsequent market action over the following 6-8 week period. The real question is "What then?" The answer is both straightforward and troublesome. Specifically, whenever we've observed a whipsaw trap that then advances enough to a) drive the S&P 500 earnings yield below its level of 6 months earlier and b) raise advisory bullishness beyond 45% - or bearishness below 30%, the result has almost always been hostile. Essentially, what this combination picks up is an already fragile set of market internals that has enjoyed an "exhaustion rally" that both exceeds earnings growth and is met with overbullish sentiment.
The previous observations of this exhaustion syndrome, and the deepest decline from that point to the low of the next 7 months, on a weekly closing basis, were: November 1961 (-25%), August 1987 (-33%), July 1998 (-18%), July 1999 (-12%), August 2000 (-22%), May 2001 (-24%), March 2002 (-32%) and May 2008 (-43%). There were also two instances of this syndrome that were not associated with a market plunge: January 2006 during the housing bubble (which ultimately led to a market collapse well below those levels), and November 2010, just as the Fed was initiating QE2 (which still did not prevent the market from trading at lower levels about 9 months later).
If we think in terms of "exhaustion rallies," the syndrome we're observing here is a multiple indicator version of signals like the Coppock "killer wave" - which occurs when the Coppock Curve reaches a peak, declines, and the market then recruits an advance large enough to establish a second wave higher. Some technicians have debated how best to define the signal (e.g. the decline required to define a negative shift) - in our view, it's not a good idea to use a single indicator in the first place - but in any event, the selloffs from those exhaustion waves have often been brutal, and a few overlap the syndrome outlined here.
In short, market action is presently showing features associated with "exhaustion rallies", which have often been followed by deep losses over the following 6-7 month period.
As a side note, we've seen an similar whipsaw in various economic statistics recently, where I continue to view the modest but tepid "recovery" as a reflection of high-frequency noise. Here too, the underlying "signal" remains weak, but the more volatile components have been positive. Unfortunately, the typical result is that the divergence snaps shut in the direction of the signal.
[Geek's Note: What I call a "Whipsaw Trap" is basically a breakdown in a broad range of market internals, followed by an advance in more volatile, high-frequency components that isn't enough to survive moving averages and other low-pass filters. It's difficult to draw a true signal from noisy data unless you have a lot it, and unfortunately, the more data you need to use to infer a signal, the greater the "lag" there is in recognizing that signal. Think again of a moving average - the longer-term the moving average, the more it lags behind recent action. The better you want a microphone to cancel noise, the longer the delay you have to endure between the input and the output. Generally speaking, we get better and more rapid information about the true, underlying "signal" if we can draw that signal out of multiple indicators, each which carries part of that information. Methods to distinguish "signal" from "noise" run through much of my financial, economic, and scientific work, for example Market Efficiency and Inefficiency in Rational Expectations Equilibria , and A Noise-Reduction GWAS Analysis Implicates Altered Regulation of Neurite Outgrowth and Guidance in Autism . The benefit of inferring signals from multiple sources is why the rational expectations paper used vector ARMA models for inference, why the GWAS paper exploited the local correlation of association signals within the same chromosomal region across multiple data sets, and why good leading economic indices combine multiple series rather than using any single indicator as an acid test].
Recession risk remains high
Last week contained very little to alter our view that a global economic downturn is likely here. While we recognize the modest, low-level improvement in a variety of indicators (see Dodging a Bullet, from a Machine Gun ), and also estimate that recession risk is something less than 100%, this is far from a suspension of our recession concerns. To the contrary, a concerted global downturn that includes the U.S. remains the most likely outcome.
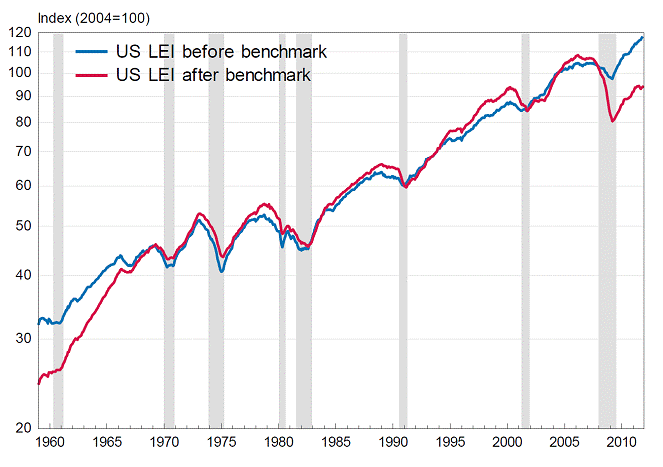
Last week, the Conference Board released its revised version of Leading Economic Indicators, which shows a sharply weaker trajectory than the former version if the LEI. Indeed, the revised LEI has already turned down, though to a lesser degree than just before previous recessions.
A few economic notes. In early 2010, we examined the seasonal adjustment factors used by the Bureau of Labor Statistics in the monthly employment report (see Notes on a Difficult Employment Outlook ). While we didn't observe any striking divergences between the BLS adjustment factors and our own estimates, I noted that the effect of those seasonal adjustments typically amounted to anywhere between +1.9 and -1.3 million jobs, depending on the month. Presently, we estimate that the effect of these adjustments range between +2.1 million and -1.1 million jobs in any given month (see When Positive Surprises are Surprisingly Meaningless ). These are strikingly large numbers compared with the typical range of forecasts that often surround the monthly employment numbers.
Think of it this way - if there is typically a great deal of temporary job creation in the fourth quarter of the year (and there is), the effect of seasonal adjustment will be to subtract off a certain proportion of actual employment in order to smooth that bulge down. Accordingly the October-December adjustment factors range between -0.6% and -0.8% of total non-seasonally adjusted employment. In contrast, if there is a great deal of job destruction in January and February (and there is), the effect of seasonal adjustment will be to add back some amount of phantom employment, amounting to between 1.1% and 1.6% of total nonfarm payroll jobs.
[Geek's note: In practice, most seasonal adjustment is done either with ARMA-type models or by working in the frequency domain. In monthly data, for example, the seasonal component is measured by the correlation of the data with a cosine wave that sweeps out 2*pi/12 radians per month (a wave that goes through exactly one full cycle per year). Seasonal adjustment then amounts to applying a "band pass " filter that squashes that particular frequency. In practice, seasonal adjustment methods also typically smooth the data as well (by attenuating higher frequencies), which can give users of economic data an unrealistic view of reality, and also invariably induces a lag (or "phase delay") in the adjusted data].
Given that virtually all economic series undergo some amount of seasonal adjustment, it isn't clear how much these adjustments may be affecting the month-to-month fluctuations we're observing in various economic series. Months where the data were very weak in recent years could understandably produce increases in the seasonal adjustment factors for those months. In any event, even without any skewed seasonal factors, the broad ensemble of leading economic evidence remains unfavorable here.
Finally, while we typically discourage drawing inferences from any single indicator, it's at least worth noting that with the release of Q4 GDP figures, the year-over-year growth rate of real U.S. GDP remains below 1.6% (denoted by the red line below). A decline in GDP growth to this level has always been associated with recession, usually coincident with that decline, though with a two-quarter lag in two instances (1956 and 2007), and with one post-recession dip in growth during the first quarter of 2003. As it happens, the GDP growth rate dropped below 1.6% in the third quarter of 2011.
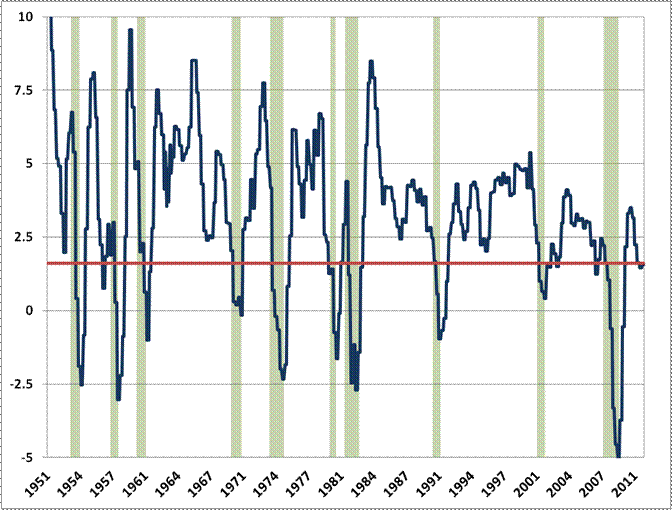
Given the strong and rather obvious relationship between the most recent year-over-year rate of GDP growth and the prospect of oncoming recession, it's difficult to understand why Wall Street so completely rejects the likelihood of an economic downturn. Then again, that's exactly why we're expecting a Goat Rodeo.


