Showing posts with label bubble. Show all posts

Thursday, June 4, 2020

Thursday, April 9, 2020

Top-Notch Investor Says Worst Is Yet to Come for Covid-19


In an article today on Marketwatch, investor Mark Spitznagel tells us that things are going to get much worse for stocks due to the coronavirus. He should know, since he recently achieved a 4,144% return in the month of March. He clearly stated also that the stock market is in a bubble, and that if the Covid-19 pandemic doesn't pop the bubble, something else WILL.
Look out beloooow!

Thursday, January 16, 2020

If This Isn't a Bubble, What Is?

One of the attributes of a financial bubble is that they are never recognized as such until AFTER they pop!
So when will this one pop? Predicting the future is for prophets (with a "ph"), not profits (with an "f"). The important thing is to have an exit strategy, not to predict a "when will it happen" future.

Friday, July 26, 2019

A Bubble Defined!

If this headline doesn't describe a bubble, I don't know what does! This is the very definition and description of a bubble. It's just a question of time when it pops!


Wednesday, July 3, 2019

This Sounds More and More Bubbly! Meet the Everything Bubble!

...And it sounds more and more like the "everything bubble"! Look at these headlines today:

Meanwhile, stocks are setting new record highs, even as jobs weaken. Job weakness, by the way, is known as a "lagging" economic indicator! It is one of the last things to drop when the economy approaches a recession. 

Friday, June 7, 2019

The Bubble Grows! Stocks Leap on Bad Economic News

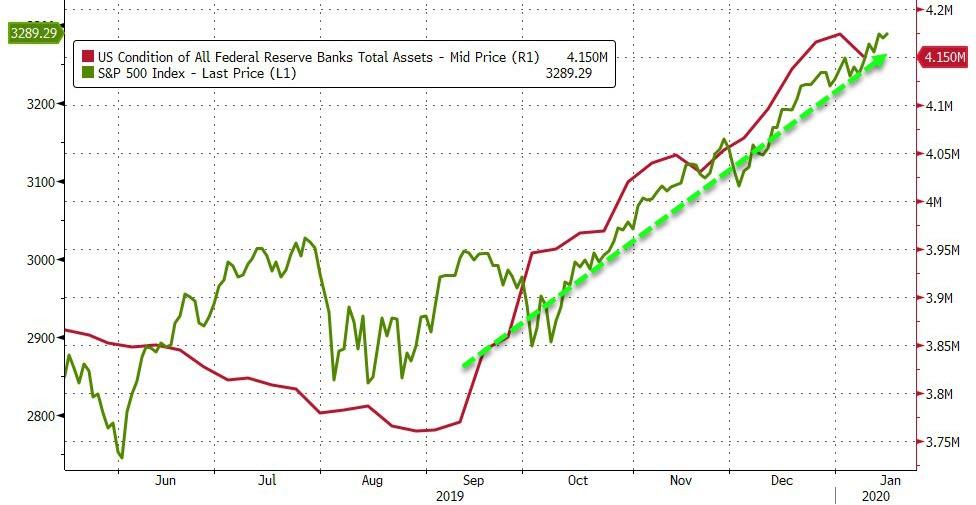
The federal jobs report this morning showed less than half the number of expected jobs were created last month than were expected. That's bad for business! That suggested that corporate America may be seeing a future recession coming down the road. But the stock market is up nearly 300 points! Why? Because, as indicated in the above headline, Wall St expects the Federal Reserve to initiate more quantitative easing, creating more digital money to artificially boost stocks even higher into bubble territory! The bubble grows!

Wednesday, June 5, 2019

Fed Is Pandering to Stock Market. That Spells B-U-B-B-L-E!

I thought this was an interesting insight this morning from Bill Blain at Morning Porridge.
"US employment is at a high, the labour market is tightening, there is minimal real inflation and the stock market is off to the races because the Fed says its ready to ease if trade tensions impact the stock market economy.
"In 35 years of markets, this is perhaps the stupidest moment I’ve ever seen.
"There is a danger Powell et al seem are confusing the Dow and S&P for the health of the economy, thereby making the Fed complicit in the ultimate market distortion that’s being going on since someone dreamt up QE. The World’s most important central bank is missing the point completely, and more or less promising to bail out stock markets if Trade Tension causes them to weaken."

One of the chief characteristics of a bubble is that everyone dismisses risk. Heeeeere we go again! 

Tuesday, April 16, 2019

Stocks Rise to Record Highs Even As Economy Weakens

The bubble grows! Central bankers are nervous and have shown signs that they may engage in quantitative easing again. This is not surprising, given the economic evidence. However, there is also evidence that QE may have run its course, and may not be effective the next time around. Previous central bank presidents indicated that a suppression of 4% or more is needed, but current US Treasury interest rates are only about 2%-2.25%, so another round of QE may be ineffective the next time around.

Monday, October 16, 2017

Still Another Record High

"Oh, but this time is different," they say. Nope! That language is actually an expression of a bubble mentality! It is, itself, proof of a bubble. And every bubble in history has ultimately burst. There has yet to be an exception. This one will too!


Thursday, October 5, 2017

This Bubble Gonna Burst


Thursday, August 3, 2017

Sure Looks Like a BUbble

This image, from Dr. John Hussman's weekly market analysis, suggests that this stock market bubble is just getting bigger and bigger. The Dow finished up 9 days in a row today, even though it was already at record highs. Of course, the nature of a bubble is that the vast majority of market participants don't recognize it as such. If they did, extreme prices wouldn't be moving from one extreme to even greater ones.
In the image, the red line is the calculation of a log-period bubble base on the formulas of Dr. Didier Sornette. This bubble matches his calculations perfectly. It is a flawless example of a financial bubble.

Monday, August 15, 2016

When Is a Bubble Not a Bubble?

Answer: When it's driven by central banker yield-seeking speculation!

Stock Valuations At Bubble Levels

The outcome of years of yield-seeking speculation induced by central banks is that investors across the globe have now locked in zero prospective total returns in virtually in every asset class for the coming decade... We actually view this period as the extended top-formation of the third speculative bubble in the past 16 years, not as a representative sample of things to come. -- Dr. John Hussman, PhD, August 15, 2016

Thursday, March 17, 2016

Economic DIchotomy -- Stocks Soar As Earnings Crash

I couldn't help noticing the contradiction today between stocks, which just went positive for 2016, and both employment and corporate earnings! This is what a bubble looks like!


Monday, November 25, 2013

Building Bubbles -- One Puff At a Time

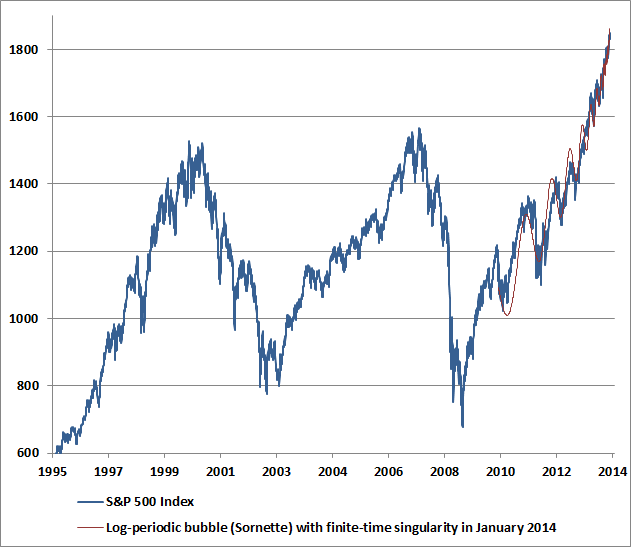
This shows the current stock market, shown in blue, overlaid by a textbook Sornett-style log-periodic bubble. They are virtually indistinguishable! This chart is from Dr. John Hussman's weekly market commentary.


Monday, November 21, 2011

Richard Russell: Debt Bubble is Close to a Pin

Writing from rehab (after a hip replacement operation), 86-year-old Richard Russell of Dow Theory Letters fame said: “The world’s inflated debt balloon is moving ever closer to its fate – a pin. Anybody younger than 80 years old is used to viewing the markets like a rubber band; stretch it one way, and it will always bounce back. That’s the widespread thinking and acting. If a correction comes, don’t sweat it, the markets will come back and end up higher. That’s been the story and thinking since the year 1900.

“I’m saying that the economy and the markets have lost elasticity. We’re moving into the period where the markets will go down but they’ll no longer act like a rubber band, they won’t bounce back. This period lies ahead one or two years, or possibly even three. For this reason, timing, or when to buy bargains, is antique thinking. The big picture trumps all timing methods. The strategy now is to get out of debt and accumulate eternal wealth, which is gold and gem-quality diamonds.

“Federal Reserve money pumping has equated with a rise in stock market and numerous bubbles. When the Fed stops pumping the markets stall, as they are doing now.”

Thursday, April 14, 2011

David Stockman: Fed's Monetary Path of Destruction

This is part two of a two-part series. I value Stockman's opinion particularly because he is a partner in a Private Equity firm. They know what makes business and free enterprise tick better than any other group of people in the world.
GREENWICH, Conn. (MarketWatch) — The destructive result of the Federal Reserve’s earlier housing and consumer credit bubble became the excuse for embracing a destructive zero interest rate policy which is self-evidently fueling even more destruction.
This destruction is namely, the exploitation of middle class savers; the current severe food and energy squeeze on lower income households; the illusion in Washington that Uncle Sam can comfortably manage $14 trillion in debt because the interest carry is close enough to zero for government purposes; and the next round of bursting bubbles building up among the risk asset classes. 
Moreover, the Fed soldiers on with its serial bubble-making, even though it is evident that the hallowed doctrines of modern monetary theory and the inherently dubious math of Taylor rules have failed completely.
Indeed, the evidence that the Fed no longer has any clue about the transmission pathways which connect the base money it is emitting with reckless abandon (e.g. Federal Reserve credit) to the millions of everyday pricing, hiring, investing and financing outcomes on Main Street sits right on its own balance sheet. Specifically, if the Fed actually knew how to thread the needle to the real economy with printing press money it wouldn’t have needed to manufacture $1 trillion in excess bank reserves — indolent entries on its own books for which it is now paying interest.
So in the present circumstances, ZIRP and QE2 amount to a monetary Hail Mary. There is no monetary tradition whatsoever that says the way back to U.S. economic health and sustainable growth is through herding Grandma into junk bonds and speculators into the Russell 2000 (NASDAQ:RUT)  .
Admittedly, the junk-bond financed dividends being currently extracted by the LBO kings from their debt-freighted portfolios may enable them to hire some additional household help and perhaps spur some new jobs at posh restaurants, too. Likewise, the 10% of the population which owns 80% of the financial assets may use their stock market winnings to stimulate some additional hiring at tony shopping malls.
That chairman Bernanke himself has explained in so many words this miracle of speculative GDP levitation, however, does not make it so. The fact is, if transitory wealth effects add to current consumer spending, they can just as readily subtract on the occasion of the next “risk-off” stampede to the downside. Indeed, the proof — if any is needed — that cheap money fueled asset inflations do not bring sustainable prosperity lies in the still smoldering ruins of the U.S. housing boom.
In truth, the Fed’s current money printing spree has no analytical foundation, and amounts to seat-of-the-pants pursuit of a will-o’-wisp — the idea of a perpetual bull market. Like the Bank of Japan, the Fed has made itself hostage to the global speculative classes, and must repeatedly inject new forms of stimulus to keep the bubbles rising. 
This is the only possible explanation for its preposterous decision to allow the big banks to resume dissipating their meager capital accounts by paying “normalized” dividends and by resuming large-scale stock buybacks. These are the same financial institutions that allegedly nearly brought the global economy to its knees in September 2008, according to the Fed chairman’s own words.
In what is no longer secret testimony to the FCIC (Financial Crisis Inquiry Commission), Federal Reserve Chairman Bernanke claimed that the Wall Street meltdown “was the worst financial crisis in global history” and that “out of maybe 13…..of the most important financial institutions in the United States, 12 were at risk of failure within a period of a week or two”.
That testimony was recorded just 15 months ago, but the financially seismic events it references have apparently already faded into the dustbin of history. Still, even if the dubious proposition that the banking system has fully healed were true, what did the Fed hope to accomplish besides goosing the S&P 500 (CME:INDEX:SPX)  via speculative rotation into the bank indices?
Well, there are no other plausible explanations. Certainly the stated theory — namely, that by green lighting disgorgements of capital today the Fed’s action will facilitate bank capital raising and new lending in the future —merits a loud guffaw. The fast money has already priced in whatever dividend increases and share buybacks may occur before the next banking crisis, but the last thing these speculators expects is a new round of dilutive capital issuance by the banks. Stated differently, the bid for bank stocks unleashed by the Fed’s relief action is predicated on speculators’ pocketing any near-term “surplus” capital, not leaving it in harms way.
Moreover, even if the Fed’s action had the effect of bolstering, not depleting, bank capital the larger issue is why does our already massively bloated banking system need more capital in any event? The reflexive answer is that this will help restart the flow of credit to Main Street, but it doesn’t take much digging to see that this is a complete non-starter.
The household sector is still saddled with massive excess debt — unless you believe that the credit bubble of recent years is the sustainable norm. The fact is, prior to the Fed’s easy money induced national LBO, debt-to-income ratios at today’s levels were unthinkable. In 1975, for example, total household debt—including mortgages, credit cards, auto loans and bingo wagers—was about $730 billion or 45% of GDP
During the 1980’s, however, this long-standing household leverage ratio began a parabolic climb, and never looked back. By the bubble peak in Q4 2007, total household debt had reached $13.8 trillion and was 96% of GDP. Yet after 36 months of the Great Recession wring-out, the dial has hardly moved: household debt outstanding in Q4 2010 was still $13.4 trillion, meaning that it has shrunk by the grand sum or 3% (entirely due to defaults) and still remains at 90% of GDP or double the leverage ratio that existed prior to the debt binge of the past three decades.
So the banking system does not need more capital in order to increase credit extensions to the household sector. In fact, the two principal categories of household debt — mortgage loans and revolving credit, continue to decline as American families slowly shed unsupportable debt. The only reason total household debt appears to be stabilizing in recent quarters is that student loan volumes are soaring, but this growth is being funded entirely by the Bank of Uncle Sam now that private bank loan guarantees have been eliminated.
Indeed, the startling fact is that the approximate $1 trillion of student loans outstanding — sub-prime credits by definition — now exceed the $830 billion of total credit card debt by a wide margin. While this latest student loan bubble will end no better than the earlier credit bubbles, the larger fact remains that the household sector is only in the early stages of deleveraging. Not the least of the self-evident motivating forces here is that the leading edge of the household sector — the 78 million strong baby boom generation — appears to be figuring out that it is not 1975 anymore, and that retirement and old age are approaching at a gallop.
This obvious household deleveraging trend remains a mystery to the Fed and to the Wall Street stock peddlers who occasionally moonlight as economists. One recent air ball offered up by the latter is that the ratio of debt to disposable personal income (DPI) has dropped materially, and that this proves the household sector has been healed financially and is ready to borrow again. Specifically, the household debt-to-DPI ratio has fallen to 116% from a peak of 130% in late 2007.
Never mind that this measure of household financial health stood at just 62% back during the healthier climes of 1975. It is evident that even the modest improvement in this ratio during the last three years is a statistical illusion. It turns out that the debt-to-DPI ratio is improving mainly because the denominator has gained about $885 billion or 8.3% since the end of 2007.
Yet this gain in DPI has nothing whatsoever to do with an improved debt carrying capacity in the household sector. Thanks to the more or less continuous riot of Keynesian stimulus in Washington since early 2008, we have had a tax holiday and a transfer payment bonanza. Specifically, in the three years since the fourth quarter 2007 peak, personal taxes are down at a $312 billion annual rate (which adds to DPI, an after-tax measure) and transfer payments are up by a $572 billion annual rate.
Both of these are components of DPI, and taken together ($884 billion) they account, quite astoundingly, for 99.8% of the DPI gain since Q4 2007. Moreover, it does not take a lot of figuring to see that these trends won’t last. The Federal tax take is now less than 15% of GDP — the lowest level since 1950 — and will be rising year-after-year in the decade ahead, as will personal tax burdens at the state and local level.
At the same time, the 30% surge in transfer payments over the last three years is mostly done. Unemployment insurance payments — which accounted for much of the rise — will be flat or shrinking in the near future, and various one-time low income programs have already expired. Moreover, the bulk of the current $2.3 trillion in transfer payments go to elderly and poverty level households which carry negligible portions of the $13.4 trillion in household debt, in any event.
By contrast, the ratio of household debt to private wage and salary income — a far better measure of debt carrying capacity — has not improved at all. Household debt amounted to 255% of private wage and salary income at the peak of the credit boom in late 2007, and was still 251% in Q4 2010. At the end of the day, the household debt-to-DPI ratio improved solely because Uncle Sam went on a borrowing spree and temporarily juiced DPI with tax abatements and transfer handouts.
In short, banks don’t need more capital to support household credit because the latter is still shrinking, and will be for a long time to come. Moreover, it might as well be said in this same vein that the business sector doesn’t need no more stinking debt, neither!
At the end of 2005 — before the credit bubble reached its apogee — the non-financial business sector (both corporate and non-corporate entities) had total credit market debt of $8.3 trillion, according to the Fed’s flow of funds data. By the end of 2007, this total had soared by 25% to $10.4 trillion. But contrary to endless data fiddling by Wall Street economists, the business sector as a whole has not deleveraged one bit since the financial crisis. As of year-end 2010, business debt was up a further $500 billion to $10.9 trillion.
The whole propaganda campaign about the business sector becoming financially flush rests on an entirely spurious factoid with respect to balance sheet cash. Yes, that number is up a tad — from $2.56 trillion in fourth quarter 2007 to $2.86 trillion at the end of 2010. Still, this endlessly trumpeted gain in cash balances of $300 billion is more than offset by the far larger gain in business sector debt — meaning that, on balance, the alleged cash nest egg held by American business is simply borrowed money.
At the end of the day, $10.9 trillion is a lot of debt in absolute terms, but based on the Fed’s data on the market value of business sector assets, it is also crystal clear that the relative burden of business debt has been rising, not falling. At the bubble peak in late 2007, business sector assets were valued at $41.5 trillion but alas this figure had shrunk to $36.9 trillion by the end of last year. The grim reaper of real estate deflation has done its work in the business sector, too.
Consequently, total business debt now amounts to 29.4% of business assets---a considerable rise from the 25.2% ratio at the bubble peak in late 2007. What the bullish cheerleaders of recovery constantly forget is that in an epochal deflation like the present one, debts remain at their contractual amounts, even as asset values wither.
So the real question regarding the Fed’s green light for bank dividends and buybacks is quite clear. Banks don’t need more capital to make new loans to households and business. What they actually need is to preserve their current artificially bloated retained earnings accounts in order to protect the taxpayers from the next — virtually certain — banking meltdown.
In this light, the Fed’s action is especially meretricious. If it weren’t in such a hurry to juice the stock market and thereby keep the illusion of recovery going, it might have considered extending the regulatory sequester on bank capital for a few more quarters or even years — thereby preserving a shield for the taxpayers until it has been demonstrated by the passage of time, not by the passing of phony stress tests, that the American banking system is truly out of the woods.
After all, the bottled-up profits currently alleged to be resident in the banking system have not been expropriated by the Fed; they have just been temporarily sequestered — a condition these wards of the state should gladly endure in return for continued access to taxpayer backed deposit insurance and the Fed’s borrowing widow, as well as their license to engage in the lucrative business of fractional reserve banking. Indeed, the fast money should be as capable of pricing in any “excess” capital in the banking system, as it has already been in goosing bank stocks in anticipation of higher profit distributions.
And it is here where the historical data on Bernanke’s 12 out of 13 crashing financial dominoes essentially speaks its own cautionary tale. At the peak of the credit and housing boom in 2006, these 13 most important financial institutions booked $110 billion of net income, and disgorged more than $40 billion of that amount in dividends and stock buybacks.
Would that these fulsome profits and attendant distributions had been real and sustainable, but the historical facts inform otherwise. By 2007, the groups’ profits had dropped to $64 billion, and then in 2008, the 10 institutions which survived to year-end reported a staggering loss of $56 billion. Moreover, if the massive loses incurred by the terrible three — Washington Mutual (NYSE:JPM) , Wachovia (NYSE:WFC) and Lehman — during their final, unreported stub quarter is added to the tally, losses for the year would approach $80 billion.
The unassailable truth here is that in 2006 and 2007 the banks were disgorging phantom profits to their shareholders. When the crunch came in 2008, bank capital had been badly depleted by these unwarranted dividends and stock buybacks.
The danger, of course, was buried in the balance sheets all along. Back in their 2006 heyday, the top 13 financial institutions had $10.2 trillion of total assets — and a not inconsiderable portion of that figure was worth far less than book value, as ensuing events proved. Today the nine banks which are the survivors and assigns of these 13 institutions still have $10.1 trillion in asset footings — hardly a measurable reduction despite the goodly amount of write-offs which have been taken in the interim.
The Fed’s foolish wager — and it is foolish because there is no real purpose other than a momentary boost to bank shares — is that this once toxic asset ridden $10 trillion balance sheet is now squeaky clean. Yet why would any sane observer embrace that dubious proposition?
While the banks have been relieved of mark-to-market accounting, they are still knee-deep in the very asset classes whose ultimate recoverable value remains exposed to the real estate meltdown. Residential housing prices are now clearly in the midst of a double dip, and rates of new construction and existing unit sales are spilling off the bottom of the historical charts
Still, the banking system holds $2.5 trillion of residential mortgages and home equity lines — plus $350 billion of construction loans and more than a trillion of mortgage backed securities. Maybe they have enough reserves to cover the remaining sins in this $4 trillion kettle of residential debt, but betting on housing bottom has been a widow-maker for several years now — and there is nothing on the horizon to suggest that this epochal bust will not make a few more.
Likewise, the banking system is carrying $1 trillion of commercial real estate loans, and the open secret is that “extend and pretend” refinancing is the primary underpinning of current book values. Similarly, the Fed has rigged the steepest yield curve in modern times, but it is a fair bet that as it is gradually forced to normalize interest rates, current record net interest margins will be squeezed. And it is also probable that some of the $2.7 trillion of government, corporate and other securities owned by the banking system may be worth less than par in a world where money rates are more than zero.
In short, a banking system that by the lights of the Fed was on the verge of extinction just 28 months ago could not possibly have gotten well in the interim. In shades of 2006, the nine survivors did report net income of $54 billion in the year just ended, and it is these retained earnings that have purportedly brought bank capital ratios to the pink of health. Then again, the cynic might wonder whether the trading book and yield curve profits of 2010 might not disappear as fast as did the mortgage origination, securitization and trading profits of 2006-2007.
One thing is certain, however, and that is that these behemoths are now truly too big to fail. At the end of 2006, the asset footings of the Big Six — J.P. Morgan, Bank of America (NYSE:BAC)  , Wells Faro (NYSE:WFC)  , Citigroup (NYSE:C) , Goldman Sachs (NYSE:GS)   and Morgan Stanley (NYSE:MS)  — were $7.1 trillion. Saving the system through shotgun marriages in the interim, our financial overloads have permitted the group to grow its assets by 30% to $9.2 trillion.
If you believe that these massive financial conglomerates are a clear and present danger to the American economy, you might opine that they are too big to exist, as well. But even from a more quotidian angle — unless you are in the banking index for a trade — it’s pretty easy to see that so-called banking profits should have remained under regulatory sequester for a few more economic seasons, at least.
David Stockman is a former member of the House of Representatives and a member of the Reagan administration. He currently owns his private equity fund, Heartland Industrial Partners, L.P .
Tuesday, March 15, 2011

John Hussman: Anatomy of a Bubble

Great analysis by John Hussman. No one is better!

Over the past decade, investors have seen near-parabolic advances in a variety of assets, followed by crashes. These have included dot-com stocks (which peaked and crashed well before the general market peak in 2000), technology stocks, housing, commodities, and stocks in a variety of emerging markets. These experiences have made investors somewhat more attuned to the destructive potential for speculative bubbles in various assets, but has also created something of a "casino economy" where a great deal of resources are directed in hopes of participating in these bubbles.

What exactly is a "bubble?" Informally, we can think of a bubble as an advance in an asset's price to levels that are "detached from fundamentals" - essentially, the primary motive for investing ceases to be the expectation of future cash flows or consumption, and instead centers on the expectation of further increases in price. From this perspective, a bubble emerges at the point where a continual increase in the ratio of prices to fundamentals is required in order for investors to achieve satisfactory returns.
Formally, a bubble can be defined as a "non-fundamental" component of price which grows exponentially. Think about stocks. Let "k" be the long-term return that investors expect stocks to achieve. If these expectations are correct, then next year's price Pt+1 will just be (1+k) times today's price Pt, minus whatever dividend Dt will be paid. The next year's price is determined the same way. If you write this out and solve the difference equation, you'll get a solution that looks like this: Pt = Vt + Bt, where Vt is just the discounted value of expected future dividends, and Bt is an arbitrary constant. It can be anything, so long as it obeys Bt+1 = (1+k)Bt.
Mathematically, Bt is a "bubble component" of prices. If that component Bt is not zero, the price will gradually "explode" away from any relationship with fundamentals. Moreover, the present discounted value of the future price will not tend toward zero no matter how far into the future you look. Ultimately, this sort of price path is ruled out by the fact that the value of stocks cannot grow infinitely larger than the economy, so bubbles ultimately crash. But over the short-run, there is little to prevent investors from putting a little bit of "B" into prices from time to time. This becomes pathological when the sustained price gains expected by investors diverge significantly from the growth rate of the overall economy.
In short, a bubble is an advance in prices that "substitutes" for fundamentals, in the sense that the realized return on the investment continues to be positive even after the asset is no longer priced to achieve satisfactory returns on the basis of expected future cash flows (or in the case of housing and commodities, future consumption value or other services).
The effect of valuation levels and valuation changes on S&P 500 total returns
When valuations are reasonable, investors can expect satisfactory long-term returns simply on the basis of the stream of cash flows they receive over time. But once valuations are elevated, investors become increasingly reliant on pure increases in prices and valuations in order to achieve satisfactory returns. This is easily seen in historical data for the S&P 500.
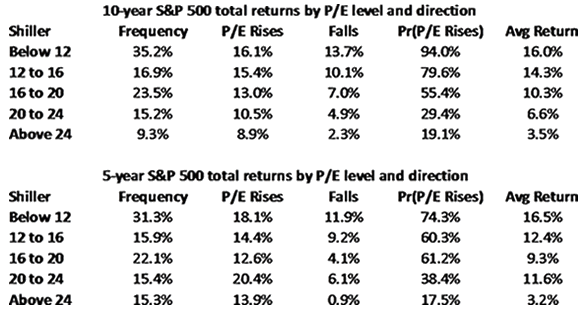
The chart below is based on post-war U.S. data, and illustrates the interaction between valuation levels and valuation changes in producing long-term total returns for the S&P 500, and expands on some of Mike Shedlock's recent observations on valuations and prospective returns. As I've frequently noted, Depression-era data is far more hostile than post-war data, as is data surrounding other historical and international credit crises, so investors would have needed more stringent valuation criteria in order to accept market risk during these periods. Still, post-war data is sufficient to convey some important ideas.
The first two columns below reflect the Shiller P/E (also known as the "cyclically adjusted" price/earnings ratio), and the frequency of various P/E ranges in historical data. The next two columns show the average annual total return of the S&P 500 Index, based on whether the Shiller P/E rose to a higher level during the 10- or 5-year horizon, or whether it fell to a lower level by the end of that horizon. The next column is the percentage of observations where the P/E was higher at the end of the horizon, and the last column is the weighted average return for each level of Shiller P/Es.
Notice that regardless of whether P/E ratios rose or fell during these investment periods, subsequent returns were substantially higher from low valuations than from high ones. Of course, subsequent returns were higher for horizons where the P/E increased than for those where the P/E fell. It is also important, though not surprising, that low initial valuations were associated with a far higher probability of rising valuations in the future. With low valuations, investors have enjoyed the prospect for high expected returns even if valuations contracted further, and also faced a high probability that a future increase in P/E multiples would add further to their returns. In contrast, high valuations have been associated with poor average returns, and a low probability of further increases in valuation multiples.
Since data is available for 5-year returns through 2006, but only through 2001 for 10-year returns, the two tables cover slightly different horizons since 1940. Notably, the frequency of Shiller P/Es greater than 24 is 15.3% in 5-year data but only 9.3% in 10-year data. This is because extreme valuations have been the norm in recent years (where the P/E has exceeded 24 over half the time, interrupted only briefly by the recent plunge and rebound).
Presently, the Shiller P/E stands at 24. Be careful how you interpret the data in the table for Shiller P/E's above 24, since these levels were almost never observed in data prior to the late-1990's market bubble. You can see the odd effect of the bubble on the P/E categories above 20. The recent tendency for high valuations to move even higher over the short-term, coupled with the rapid recovery of much of the 2008-2009 loss, creates a "hump" in the 5-year profile - average returns first decline as valuations increase, and then actually improve for the 20-24 bracket. This is an artifact of recent years, and appears neither in pre-1995 data nor in 10-year return data.
Indeed, outside of the bubble period since the late 1990's, the only historical instance of Shiller P/Es materially above 24 was between August and early-October of 1929. The closest we got to 24 in post-war data was in mid-1965. While prices went on to achieve moderately higher levels (lagging earnings growth, so that the Shiller multiple fell), the mid-1965 valuation peak is widely viewed as the starting point for a 17-year "secular" bear market during which the S&P 500 achieved total returns of less than 5% annually through 1982, despite severe inflation. That's a good reminder that stocks are not a very good inflation hedge during periods when inflation is rising, particularly when stock valuations are already elevated and are priced to achieve poor returns. Stocks only "benefit" from inflation during hyperinflations and during sustained and anticipated inflations. In other cases, the eventual adjustments in economic activity and valuations overwhelm the "beneficial" effect of inflation on earnings.
The implication of this data for long-term returns is clear. With the Shiller P/E presently at 24, we observe about the same implications for 10-year S&P 500 total returns as we obtain from our broader valuation methods (expected total returns averaging about 3.5% annually). Still, the actual course of total returns will depend on whether valuations become even more extended over the next 5-10 years, or if they contract instead. Even if one includes data from the late-1990's bubble, the probability of rising P/E multiples from these levels is less than 1-in-5.
Still, if one wishes to bet on a bubble, there is no reason set in stone that the market cannot achieve further gains. The question investors should ask, however, is whether confident prospects for a radiant economic future are likely to capture the imaginations of investors to anywhere near the extent that we observed during the late 1990's. The answer matters, because if we exclude the bubble period, the historical probability of rising P/E multiples from present levels effectively drops to zero - similar valuations were always followed by a contraction in multiples.
Long-term versus near-term
I want to emphasize that the arguments above relate to 5-year and 10-year horizons, and not how the market may perform over the next several months or quarters. Over shorter periods of time, the strength and uniformity of market internals conveys important information about the willingness of investors to accept risk. Even if we observe rich valuations, there can be some justification for accepting market risk during periods when market internals are uniformly strong, provided that the environment is not also characterized by a syndrome of overbought, overbullish and rising-interest rate conditions. Accordingly, if we can clear at least one component of that syndrome (most likely the overbought or overbullish aspect) without also provoking a broader deterioration in market internals, we'll have a reasonable window in which to accept a moderate exposure to market fluctuations. A correction to the lower-1100's on the S&P 500, without a material breakdown in broader market internals, would likely open that window.
Here and now, market conditions imply a negative average return/risk profile for stocks, but clearing some component of that syndrome (again, barring a broader breakdown in market internals) should shift the expected return profile to a modestly favorable average, allowing us to reduce the extent of our hedges. Of course, we're likely to retain a "line" of defense with index put options, to protect against any abrupt further declines or broad deterioration in market internals. But it's important to emphasize that despite our dour view of long-term return prospects, those views don't necessarily translate into an avoidance of moderate exposure to market fluctuations over the short- and intermediate-term. We're very mindful of risk here, but shareholders can also expect us to accept moderate, periodic exposure to market fluctuations more frequently, on the basis of the expanded set of Market Climates we introduced last year.
For now, we're defensive and tightly hedged (though we've reduced the number of our short call options in recent weeks in response to market weakness). That tight defensiveness may only persist for another week, possibly several weeks, but probably not months unless we observe a material breakdown in market internals. We'll take our evidence as it comes. In any event, our longer-term view of market prospects is quite restrained, and we remain concerned about latent economic risks, so even if we have constructive opportunities over the intermediate term, we expect to maintain a line of defense against more serious downside risks.
Classic bubbles - parabolic advances and log-periodic fluctuations
From our perspective, there is at least a small "bubble" component at play when markets advance over the short run, despite being priced to achieve poor returns in the long-run. In effect, investors in these markets are taking on speculative risk, in the expectation that other investors will be willing to pay even higher prices. Whatever one wishes to say about the rationality of investors during these periods, the historical evidence is that certain features of market action (particularly broad uniformity of market internals) is a useful metric of investors' willingness to speculate. As I've frequently noted, neither market action, nor trend-following measures, nor an easy Fed has been sufficient once the overvaluation is coupled with overbought, overbullish, rising-interest rate conditions. But even during post-credit crisis periods, some combinations of market conditions have warranted at least a moderate speculative exposure to market fluctuations despite rich valuations.
In the stock market, I believe that there is indeed a "bubble" component in current prices, but it is not nearly as large as we observed in the approach to the 2000 peak, nor as extreme as we observed on the approach to the 2007 peak. My hope is that investors have learned something. That's not entirely clear, but we'll be as flexible as we can while also being mindful of the risks.
While my view is that bubble components can come and go in the markets, they sometimes become so large and well-defined that they take on a very distinct profile. Such bubbles included the advance to the 2000 stock market peak, the housing bubble, the advance in oil prices to their peak in 2008, the advance in the Nikkei in the late 1980's, and other clearly parabolic advances.
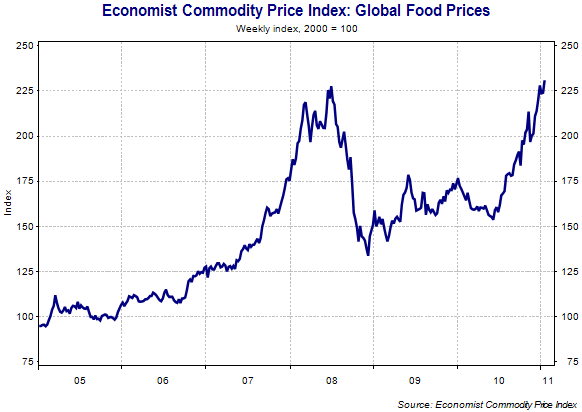
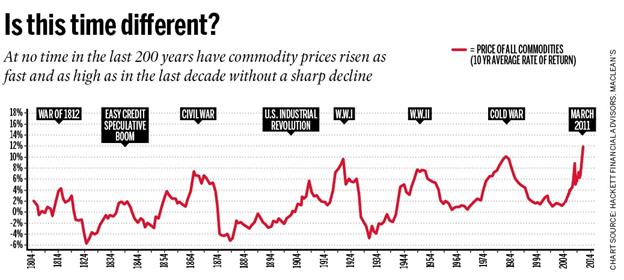
On that note, it's clear to me that we're seeing classic bubbles in a variety of commodities. It is very unlikely that this is simply due to global demand growth. Even with an exhaustible resource, it is a well-known economic result (Hotelling's rule) that the optimal extraction rule is one where the price rises at a rate not much different from the interest rate. What we've seen lately is commodity hoarding, predictably resulting from negative real interest rates provoked by the Fed's policy of quantitative easing.
http://financialinsights.files.wordpress.com/2011/03/commodity-chart1.jpg
Fortunately for the world's poor, the speculative dynamic that has created a massive surge in commodity prices appears very close to running its course, as we see very similar "microdynamics" in agricultural commodities as we saw with oil in 2008. That's not to say that we have a good idea of precisely how high prices will move over the short term. The blowoff phase of a bubble tends to be steep, but so short-lived that it affords little opportunity to exit. As prices advance in an uncorrected parabola, the one-sided nature of the speculation typically gives way to a frantic effort of speculators to exit simultaneously. Crashes are always a reflection of illiquidity in two-sided trading - the inability of sellers to find eager buyers at nearby prices.
As physicist Didier Sornette has observed, major parabolic bubbles also tend to include shorter-term fluctuations that are increasingly "chaotic" - specifically, there is a tendency for price dynamics to include a "log-periodic" component (which essentially looks like a cosine wave fluctuating at increasing frequency), so that corrections become shallower and more frequent within the parabolic trend. Eventually, these periods culminate in what Sornette calls a "finite-time singularity," which is about the point where the market crashes.
In my view, it's somewhat ambitious to use these self-similar fluctuations as the basis to time the end of a bubble, but it's clear that weakly corrected parabolic advances do tend to be unsustainable, and often produce deep and abrupt losses. As I wrote in July 2008 just as oil was spiking to $150 a barrel and headed toward $40 (see The Outlook for Inflation and the Likelihood of $60 Oil ), "When you have to fit a sixth-order polynomial to capture price history because exponential growth is too conservative, you're probably close to a peak."
On the subject of commodities, it's a natural question whether gold falls into the same category as agricultural commodities. After all, gold and other hard assets have an important role as an alternative to money to store value, and it appears clear that the world is monetizing in a way that is unlikely to be fully reversed even if policy makers wish to do so down the road.
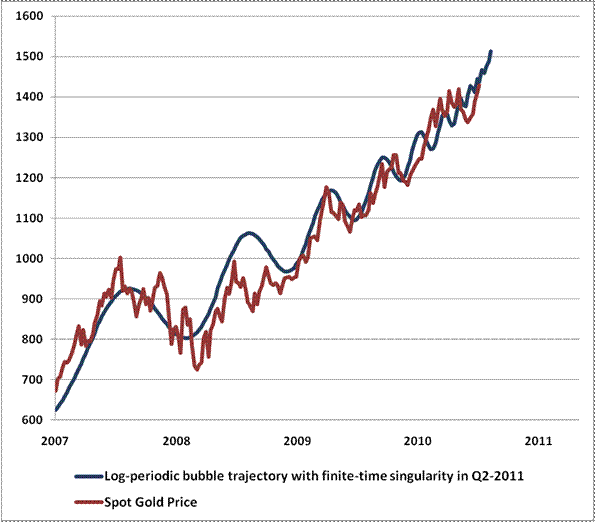
In my view, it's not clear that gold is in a bubble here, but it will be important to watch for the earmarks of a classic bubble. Below, I've plotted the price of gold against a "canonical" log-periodic bubble. Already, we're seeing some behavior that is characteristic of a bubble-type advance. A Sornette-type analysis generates a finite-time singularity as early as April, but there are other fits that are consistent with a more sustained advance. If we observe a virtually uncorrected advance toward about 1500 in the next several weeks, the steep and uncorrected advance would imply an increasing hazard probability.

Again, for my part, I think it's a bit ambitious to use log-periodic functions and other purely mathematical tools to identify bubbles and gauge crash hazards. We prefer more fundamental approaches. While I don't view gold stocks as overvalued relative to the metal (which gives us some margin of safety in the gold shares we own in Strategic Total Return), we have to view the rate and character of the advance in gold with some suspicion. If gold continues a parabolic advance toward 1500, the risk of a very sharp decline in precious metals would increase substantially, in my view. Classic bubbles tend to have a "signature" - parabolic advances with shallow and increasingly frequent corrections. Eventually, you begin to see price spikes at one-day, one-hour and even ten-minute intervals. That's a danger sign to monitor. Remember, if emerging markets stocks have taught investors one thing, it's that it's very possible for a long-term thesis to remain intact and yet have prices suffer significant declines over the intermediate-term.
Market Climate
As of last week, the Market Climate for stocks remained characterized by an overvalued, overbought, overbullish, rising-interest rate syndrome that has historically been associated with negative returns per unit of risk, on average. Both the Strategic Growth Fund and the Strategic International Equity Fund remain well hedged, though this will change in response to any clearing of this syndrome that does not also produce a significant breakdown in market internals.
In the Strategic Total Return Fund, yield pressures improved on a number of measures last week, and we responded by modestly increasing the duration of the Fund to about 3.5 years (meaning that a 100 basis point change in interest rates would affect the Fund by about 3.5% on the basis of bond price fluctuations). The Fund continues to hold about 8% of assets in precious metals shares, and we continue to view those shares as reasonably priced in relation to the metal itself. That said, the near-parabolic rise in gold prices is of some concern, as noted above, so we are comfortable with a modest but not aggressive exposure to this asset class.

Saturday, February 19, 2011

In an unprecedented move, the number of investors fearing a catastrophic stock market crash is rising even with the stock market at 2 ½ year highs.

The unusual dislocation comes from two distinct reasons: a lack of trust in the U.S. financial markets following the so-called Flash Crash last May and the collapse of Lehman Brothers in 2007.
This means the Flash Crash Advisory Commission that met on Friday has a long way to go in restoring confidence to the point that will bring the individual investor back into a market still ruled by high frequency trading, exchange-traded funds and leveraged hedge funds.
The Yale School of Management since 1989 has asked wealthy individual investors monthly to give the “probability of a catastrophic stock market crash in the U.S. in the next six months.”
In the latest survey in December, almost 75 percent of respondents gave it at least a 10 percent chance of happening. That’s up from 68 percent who gave it a 10 percent probability last April, just before the events of May 6, 2010.
“Even though the market is firing on all cylinders, that fear of big losses still looms large for investors in a way that it didn’t prior to the last bear market,” wrote analysts from Bespoke Investment Group in a report citing the Yale data. “Clearly, the financial crisis and the collapse it caused has impacted investor psyche in a big way.”
In the past, fears of a stock market crash in the Yale survey rose as the market declined because investors lost confidence in the economy and companies as share prices declined, and expected a capitulatory end to a bear market. For example, in March 2009 close to 85 percent of investors gave a crash at least a 10 percent chance of occurring. That record high in distrust and low in confidence marked a 12-½ year low in the S&P 500.
(.SPX)
Loading...       (%)

The benchmark has doubled since that low, but investors are not worrying about the prospects for individual stocks as much now now. Instead they are worrying about the still-unchanged system set up by Wall Street and regulators in which equities trade.
The Flash Crash Commission – containing members of the CFTC and SEC – made a series of recommendations for improving market structure Friday, including single stock circuit breakers, a more reliable audit trail on trades, and curbing the use of cancelled trades by high-frequency traders. They still don’t know what actually caused the nearly 1,000-point drop in the Dow Jones Industrial Average in a matter of minutes.
“Nine months after the Flash Crash and the committee is just about getting around to discussing a few things,” said Joe Saluzzi, co-founder of Themis Trading and market infrastructure expert. “This is just the way the high-frequency trading community and their supporters like it. Grind that reform train to a halt. After all, the market has come roaring back and if you didn't sell on May 6th, then nobody got hurt.”
For the agile professional investor, fear of another crash is not really a concern right now. Surveys show bullish sentiment high among the pros. Hedge funds have increased leverage again to pre-Lehman levels. Wall Street banks paid out large year-end bonuses and are about to start paying dividends again. This professional confidence has been reflected in a steady stock market climb since the summer that’s barely experienced a major 1-day drop, let alone crash.
“Though we find the current steady, upward grind in the market to be very unusual, it is important to realize that these low volatility conditions can persist,” said Andrew Barber of Waverly Advisors, in a note. “For instance, from January 2004 to July 2007, 90 day realized volatility in the S&P 500 traded in a range roughly bounded by 7 percent to 13 percent, averaging just above 10 percent for most of that period. Yes, this is 3 1/2 years of volatility roughly equivalent to what we are seeing now.”
Overall volume has been very light in the market though, as the individual investor put more money into bonds last year than stocks in spite of the gains. Strategists said this has been one of the longer bull markets (starting in March 2009) with barely any retail participation. Flows into equity mutual funds did turn positive in January and have continued this month however, according to ICI and TrimTabs.com. Yet the fear of a crash persists.
“Belief in a coming Flash Crash is Chicken Soup for the Underinvested Soul," said Josh Brown, money manager and author of The Reformed Broker blog. “They aren't so much expecting one as hoping for one - so they can rationalize buying into a market that's left them behind.”

Wednesday, February 9, 2011

It's Not a Commodity Bubble! It's Just High Prices!

High prices do not mean a bubbles. High prices are just high prices. Humans are horrible at best in predicting either the frequency or the magnitude of such moves, yet novices (and some pros) are dazzled and entertained with the white noise of predictions. Don't be one of them.
Prediction as an art in the US is miserably unsuccessful, and unfortunately we have to deal with the endless barrage of prediction that floods our senses via social media. That is the downside of the ease of internet publishing for sure.
If you make the mistake of reading some of the recent articles that I've seen stating that we have a bubble in commodities, you may sell your longs fearing that we have put in the tops for these markets. Don't be fooled and get psyched out of your long positions. I believe it was Paul Tudor Jones who said, 'prices move first, and the fundamentals follow." As long as the price charts are positively sloped stay long.
There is a long way to go before we see the type of inflation and hyperinflation that the massive printing of US dollars can cause. There is no economist within 1,000 miles of the White House who can predict how high markets can go. After that, you can use the Sperandeo 123 Trend Reversal pattern to trade these same markets short.
Part of the problem is that the msm report price changes, and not percent changes. If wheat has doubled in price, then a 10% pull back is going to be twice as large as it had been. So if you're using prices for position sizing, you might consider trimming the position so your equity does not get whipped around. Keep in mind that this is as much an emotional decision as a financial one for you to make.
A word about short selling: if you put up 5% of the notional value as margin, all you need is a 5% move down for your to double your money or earn a 100% RoR on your position. If the number was 8%, then the same will hold. There are articles out there that have suggested that you can only make 100% by being short. That is not true and you can earn several hundred % by being short wheat, for example, from $9.00 to $4.50.
Position sizes will dictate what impact these moves have on your overall equity. In high volatility markets, as well as the potential for inflation or hyperinflation, you don't need large positions in commodity trading to earn out-sized gains. That's my prediction.