Monday, January 30, 2012
Wednesday, December 28, 2011
Wednesday, November 23, 2011
Monday, September 19, 2011
Stocks Begin Day Deep in Red
Friday, September 9, 2011
Wednesday, August 24, 2011
Friday, August 19, 2011
Monday, August 8, 2011
True Market Mayhem!
Friday, June 17, 2011
Charles Hugh Smith: From Here, a Dead Cat Bounce
This is what I've been expecting. Wall Street is determined to rally stocks despite the atrocious economic news in the past three months.
Submitted by Charles Hugh Smith from Of Two Minds
The Turning Point
Some technical analysts are calling for a major rally from here, but the massive injections of financial insulin don't seem to be reviving the sagging global economy.
The stock market and economy are both at a turning point. Analyst Martin Armstrong's Economic Confidence Model (tm) set the turn date as June 13/14, 2011.
In the stock market, a number of technical analysts are issuing strong buys based on the negative sentiment of so-called "dumb money"--small investors--and the number of stocks below their 50-day moving averages.
Others such as Armstrong are predicting that Greece has no alternative to default and the Euro is untenable as "one size does not fit all."
It is rare to find a market where the technical evidence is so compelling for a strong rally yet the fundamental basis for such a rally so lacking. Exactly where do Bulls think the growth and rising profits are going to come from?
The answer for the past few years has been massive Federal Reserve/Federal intervention and stimulus, and a weakening U.S. dollar that boosted overseas profits via the legerdemaine of currency devaluation.
But three years of these policies have accomplished nothing but load the taxpayer with staggering amounts of debt: none of the causes of the 2008 implosion have been fixed or even addressed. As Armstrong notes, the massive interventions did not shorten the crisis, they have prolonged it.
This reality has filtered down to the political swamp, and now the politicos are hesitant to bet their own futures on additional trillions in stimulus and quantitative easing. For the first time in memory, the Federal Reserve is on the defensive. Simply put, its policies have failed to accomplish anything except prop up a rotten, insolvent banking sector that needs to be declared bankrupt and swept into the dustbin of history.
As I have noted here before, the next round of QE (quantitative easing) will fail to inflate the stock market regardless of its size or tricks. The fact that QE3 is needed will spook everyone who understands that it is a last-ditch effort to keep the Status Quo financialization from imploding, and since QE2's sugar-high was so brief, others will be spooked by the possibility that the next high will be even shorter.
This is the dreaded Diabetes Financial Syndrome--the Fed is pouring ever larger amounts of financial insulin into the system, but the financial "body" no longer responds to this insulin. The financial system then goes into toxic shock and implodes.
Let's look at two charts for context. Here is the S&P 500 from 1965 to 2011. Hmm, are there any aberrations visible here, any gigantic spikes of speculative frenzy? Just because these spikes of speculative, financialized frenzy have been normalized doesn't mean they are no longer speculative, financialized frenzies.
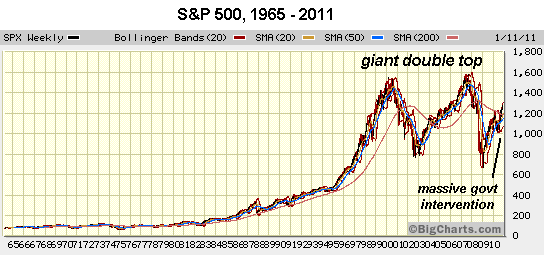
Has the economy really been healed? If not, then what is the basis of the market's spectacular rebound since 2009? We all know the answer: $6 trillion in Federal financial insulin and another $2 trillion in Federal Reserve insulin. The entire rally, in other words, is an artifact of Central bank/State intervention.
Courtesy of dshort.com, here is an inflation-adjusted chart of the S&P 500. This chart clearly illustrates that unprecedented Central State stimulus and intervention/manipulation have juiced the market higher than previous post-crash highs.

But the whole financial-insulin project is looking a bit long in tooth compared to previous post-crash markets. In the long run, perhaps we can attribute this extension of the euphoric high of "recovery" to the Fed's QE2, which pumped half a trillion dollars into stocks in a matter of months.
Short of the Fed simply buying trillions of dollars in stocks outright, then it looks like this "recovery" rally is about to have a Wiley E. Coyote moment, as it has raced off the solid ground provided by the Fed's QE2 injections and is now poised in thin air.
Of course the market could rally from here, but it's hard to see on what basis other than a technical dead-cat bounce. The Fed could announce another round of intervention, and that would certainly give the comatose body a jolt. But for how long?
If it does respond to gravity, then we might want to re-visit the definition of "dumb money:" small investors have been pulling money out of the stock market all during the QE2 insulin-rush rally while the "smart money" has been piling in, blubbering piously about the key tenet of their religious faith, "don't fight the Fed."
So which do you think is all-powerful, smart money--the Fed or gravity? We're about to find out.
Thursday, June 16, 2011
Market Sentiment: Choppy Going Up, Hard and Fast Going Down
 When I see this candlestick pattern (see description next paragraph), I take it as a reading of market sentiment. The S&P 500 is now back to flat for the day. The Dow is lagging behind and is still positive; since the Dow was up much higher in percentage terms, this is not surprising.
Notice on this chart that the uptrend was choppy and sloppy going up, but hard and fast going down. This tells me that traders are uneasy taking a long position, but quick to liquidate and/or short when the market turns. Note on the left the frequency of red, downward candles and long wicks in an uptrend. Note also on the right the lack of green candles and the rapidity of the downward move.
Monday, June 13, 2011
Thursday, May 5, 2011
Stocks Fall Through the Floor
I really expected the market to rally and sustain it. This is why I must relentlessly work hard to maintain control over my biases and trade what the market and the charts say instead of what my bias or opinion is.
Monday, May 2, 2011
Stocks Rise On bin Laden Killing, Fall on Crude Oil Rise
This price for crude oil will ultimately bring a recession.
Tuesday, April 19, 2011
Monday, March 21, 2011
Hussman: Perspective on Recent Market Weakness
from John Hussman of Hussman Funds. I nominate John Hussman to be the next Fed chairman. That monthly chart speaks volumes about where we're at. Even devastating earthquake, tsunamis, Arab world unrest, and catapulting crude oil prices, can't dampen the bubblishness of Wall Street.
Good analysis and perspective:
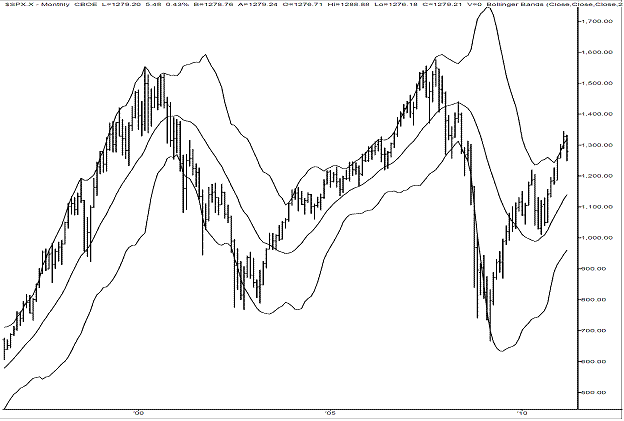
The market action of the past two weeks contrasts with the generally uncorrected advance of recent months. The chart below places this pullback in perspective, relative to the "big picture" for the S&P 500, showing monthly bars since 1996. I suppose it's possible for investors to characterize the recent decline as a "panic" if they press their noses directly against their monitors, but in that case, they really do have a short memory. The pullback has been negligible even relative to the action of the past several months, and is indiscernible in the big picture. As of Friday, the market remained in an overvalued, overbought, overbullish, rising-yields syndrome that has typically been cleared much more sharply than anything we saw last week.
Wednesday, January 19, 2011
Thursday, December 2, 2010
Stocks Grossly Overvalued on a Historical Basis
by John Hussman:
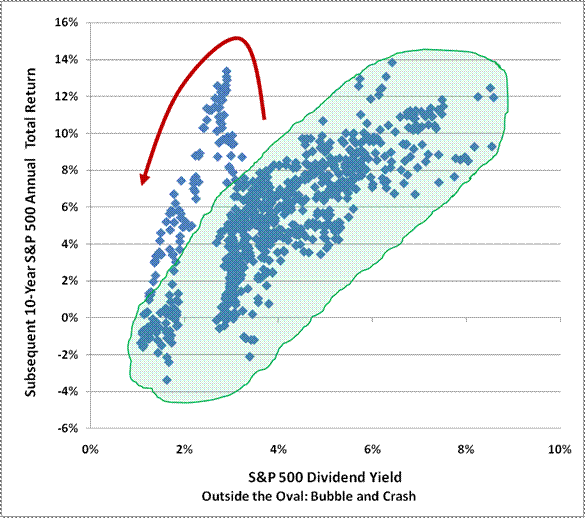
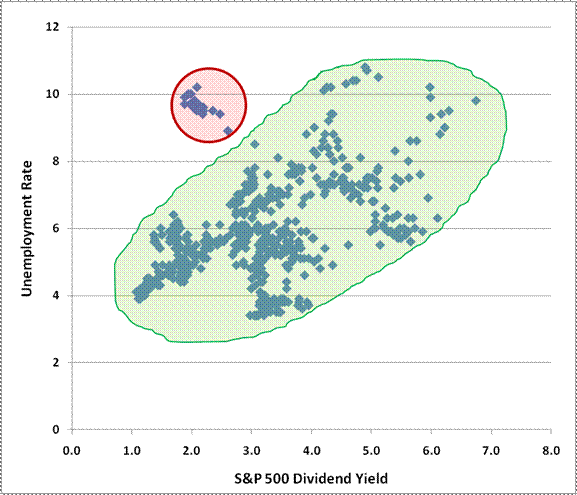
When we analyze historical relationships between economic and financial variables, it's important to examine the data for "outliers" that significantly depart from typical behavior. Very often, these outliers are corrected over time in a way that creates profit opportunities. In the office, we usually refer to these observations as being "outside the oval," because they diverge from the cluster that describes the majority of the data.
Thursday, August 26, 2010
SocGen Strategist Forecasts Stock Market "Rude Shock", S&P 500 Plunging to 450 Level
Albert Edwards, whose opinion, of all macro economists, is among the most respected by Zero Hedge staff, has just thrown down the gauntlet. In his just released piece he mocks the Black Knight, compares the market to a Polish dude with a bullet stuck in his head, makes fun of koolaid drinking permabulls, and sets his estimate for the S&P... at 450.
Investors cannot move for the weight of broker research comparing the current conjuncture in the US with Japan a decade ago. While bond markets at least, move to discount deflation, most sell-side analysts still say the current situation is unlike Japan a decade ago. They are right. Things now in the US are much, much worse than Japan a decade ago.In case anyone needs a graphic summary of all that was just said, the chart below summarizes it best:
Equity investors are in for a rude shock. The global economy is sliding back into recession and they are still not even aware that these events will trigger another leg down in valuations, the third major bear market since the equity valuation bubble burst.
This lack of awareness reminds me of reports this week that a 35 year old Polish man hadn?t noticed for five years that he had a bullet lodged in his head. Like the equity market in 2000, the Polish man had been partying too hard to notice that he had been shot. The BBC report the police as saying "He told us he remembered having a sore head, but that he wasn't really one for going to the doctor."
As the equity bloodbath of the last decade enters its final, even bloodier phase, investors continued optimism also reminds me of the Black Knight in Monty Python & the Holy Grail - link. Despite being grievously wounded by King Arthur, the Black Knight makes light of his injuries which he dismisses as a flesh wound. The vast bulk of the investment industry fails to appreciate that we are locked in a structural bear market and about to enter Act III.
Some more observations:
This year has already seen a dramatic flip-flop in sentiment as the market has begun to acknowledge it is sinking into the deflationary quicksand. For this year outperformance in the US, for example, is over 20 percentage points (see chart below).Another pet peeve of the SocGen strategist, as demonstrated repeatedly by Zero Hedge when we show that bonds imply stocks should be at about 750-800, is why have stocks not followed bonds down into the deflationary abyss. His conclusion:
So far the equity market has shrugged off much of the weaker data that abounds, and has not joined the bond market in a perceptive move. The equity market will though crumble like the house of cards it is, when the nationwide manufacturing ISM slides below 50 into recession territory in coming months. Indeed the new orders data for August, already reported in regional ISM?s suggests the equity market is going to get some sentiment crushing data in the very near term. But never mind the last standing optimist will tell us ? it is only a flesh wound!Yet all logic aside, we know readers are just waiting for the punchline. So here it is:
The structural bear market has not reached the end. We have long said that the de-bubbling process would end only when equities became very cheap and revulsion in equities as an asset class hangs in the air like a fog. The problem remains more of excess valuation within the US rather than Europe, but that will not prevent the bear market hurting other cheaper markets as much. We will return to the valuation nadir last seen in 1982 with the S&P bottoming around 450 (see chart below).


