by John Hussman:
When we analyze historical relationships between economic and financial variables, it's important to examine the data for "outliers" that significantly depart from typical behavior. Very often, these outliers are corrected over time in a way that creates profit opportunities. In the office, we usually refer to these observations as being "outside the oval," because they diverge from the cluster that describes the majority of the data.
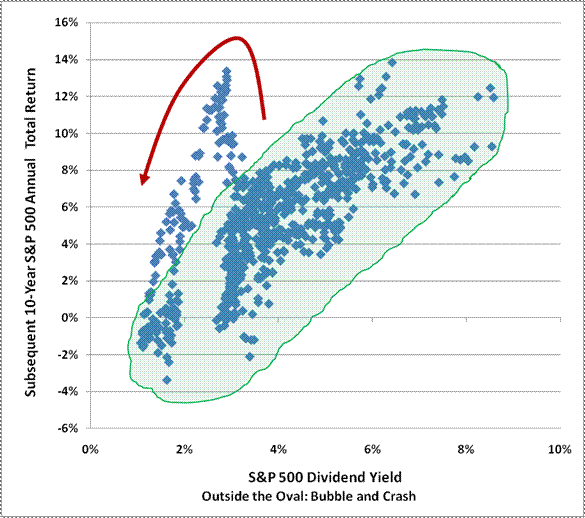
Failing to recognize data that is outside the oval can lead investors to learn dangerous lessons that aren't valid at all. A good example of this is the relationship between valuations and subsequent market returns. The chart below presents the historical relationship between the S&P 500 dividend yield and the actual annual total return achieved by the S&P 500 over the following decade. The majority of the points cluster nicely - higher yields are associated with higher subsequent returns. But there is a clear segment of the data that breaks away from the oval. I should note that the same departure is evident on the basis of P/E ratios that reflect normalized (full cycle) earnings, so this is not simply a dividend story.

Prior to about 1995, the lowest yield ever observed on the S&P 500 was 2.65%, and then only at the three most extreme valuation peaks in history - August 1929, December 1972, and August 1987. But in the mid-1990's, valuations broke free of their prior norms. As the bubble continued and yields fell further, investors observed that poor dividend yields were actually accompanied by high returns over the following decade anyway. By the time the market reached its peak in 2000, the dividend yield on the S&P 500 had declined to just 1.07%, and dividend yields were almost universally discarded as a measure of stock valuation. The intellectual case was seemingly reinforced by the idea that stock repurchases had made dividend yields an obsolete measure of valuation, even though the calculations made by Standard and Poors for both the level and the growth rate of index dividends for the S&P 500 properly reflect the impact of repurchases.
Unfortunately, discarding the information from dividend yields was the wrong lesson. As you can see in the chart, the data points eventually came back into the oval: the extraordinarily low yields observed at the tail of the bubble were followed by a decade of negative total returns, including two separate declines of more than 50% each.
Despite this outcome, investors have failed to recognize the wrong lesson that they learned. With the exception of the market bubble that took the relationship between yields and subsequent returns outside the oval, the historical evidence is very consistent that low yields (elevated valuations) are accompanied by dismal subsequent returns. At present, the yield on the S&P 500 is just 1.95%. This level can be expected to be followed with S&P 500 total returns of about 2.2% annually over the coming decade, with a confidence interval that easily includes zero. Based on normalized earnings, our projections are somewhat better, at about 4.8%. Meanwhile, our estimate based on forward operating earnings (see Valuing the S&P 500 Using Forward Operating Earnings) gives a 10-year total return projection of about 4.7% annually. Again, this is not simply a dividend story.
In recent months, we've heard a related, but also mistaken lesson from various corners of the investment community. This one suggests that poor market returns over a 10-year period, in and of themselves, can be taken as evidence that market returns over the following decade will be glorious. The problem is that this argument fails to take valuations into account. Historically, poor 10-year periods have invariably terminated with very low valuations and very high yields. It is the low valuations that resulted in high subsequent long-term returns, not the poor preceding market returns per se.
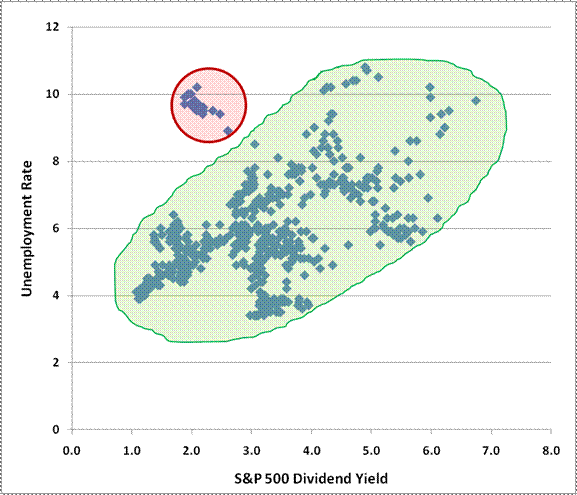
Likewise, high unemployment rates cannot be taken, in and of themselves, as a signal that subsequent market returns will be strong. Look at the relationship between the unemployment rate and the dividend yield, and what you'll find today is that the current dividend yield is way outside of the oval. Historically, high unemployment has been associated with high subsequent returns, but only because high unemployment was associated with high stock yields and depressed valuations. Not today.

Our estimates for S&P 500 total returns remain below 5% at every horizon shorter than a decade. One can argue that 5% is "attractive" relative to less than 3% on a 10-year Treasury bond, but that assumes a static world where stocks are risk-free and securities deliver their returns smoothly. If investors decide that they are no longer ecstatic about these low prospective rates of return a year or two from now, they will promptly re-price the assets to build in higher rates of expected return. Unfortunately, the way you increase the future expected rate of return is to drop the current price, and the amount by which prices would have to drop in order to normalize expected returns is enormous.
From our standpoint, it isn't likely that investors will get their expected 5% return over the coming decade in a smooth, diagonal line. Our guess is that they will instead see a large negative return over the first two years or so, followed by subsequent returns that are much closer to the historical norm. The third alternative, of course, is the bubble scenario, where stocks achieve returns above 5% annually in the immediate few years, followed by flat or negative returns for the remainder of the decade. That is certainly the pattern we observed beginning in the late-1990's.
We'll take our evidence as it comes. As I noted at the beginning of this year, as move toward 2011, we are increasingly weighting post-1940 data in setting expectations about prospective returns and risks, in the expectation that there is a wide enough range in that data to manage the residual economic risks we observe.
Presently, we have a combination of overvalued, overbought, overbullish, rising yield conditions that have been very hostile for stocks even in post-1940 data. We also have not cleared our economic concerns sufficiently to lift that depressing factor on the expected return/risk profile for stocks. It follows that changes in some combination of those factors - valuation, overbought conditions, sentiment, and economic conditions, provided that those changes aren't accompanied by a clear deterioration in market internals - would prompt us to remove a portion of our hedges (most probably covering short calls and leaving at least an out-of-the money index put option exposure in place). Unfortunately, with stocks overvalued, a shallow decline that simply clears the overbought condition would not leave much room to advance until stocks were overbought again, so the latitude for a constructive position would be limited. Ideally, we'd prefer a very substantial improvement in valuation, that is, significant price weakness that would also be accompanied by internal deterioration. In that event, as in 2003, we would look for early divergences and internal strength as an indication to remove the short-call portion of our hedges, and possibly more depending on the status of valuations and other factors at the time.
For now, we remain defensive, even purely on the basis of post-1940 relationships.
