Unfortunately, we are seeing the soon arrival of both food price hyperinflation coupled with the destruction of the value of the US dollar, as depicted in these two charts. The first depicts the devaluation of the US Dollar over the past several weeks, and the second chart shows the latest update of the price of corn and other food commodities.
Saturday, May 8, 2021
Monday, June 24, 2019
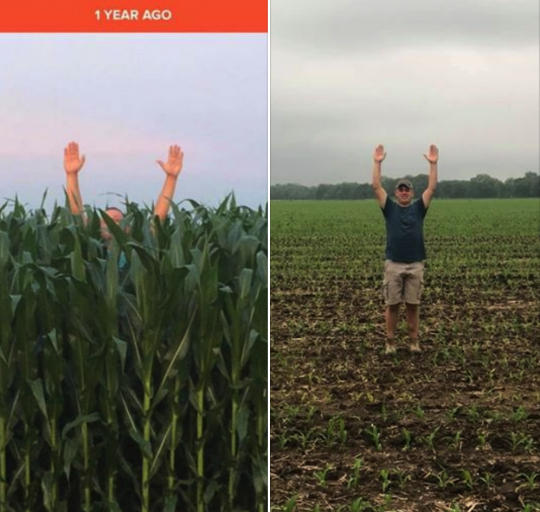
One Year's Difference in Crop Growth Hints Higher Food Prices
This photo shows a one-year difference taken of the same person in the same spot on the same date one year apart. The one on the right is this year. What will happen if fall or winter weather begins before the crop on the right can be harvested? Food prices would be sharply higher!
Wednesday, June 19, 2019
Thursday, June 13, 2019
Tuesday, May 28, 2019
Food Crop Prices Accelerate Higher
Each day, I hope that farm crops will get planted and prices will reverse. However, instead of reversing, close attention to the last few candles on this chart show an acceleration higher instead!
Food Commodity Prices Continue to Climb
I wonder when we'll begin to see food prices rise this sharply in t\he grocery stores. Corn is up another 8+ cents (32+ ticks) today. Other food commodities are up also.
Monday, May 27, 2019
Crop Catastrophe Coming?
Another scary headline. Wake up, America!
Sunday, May 26, 2019
Are We Facing a Food Crop Crisis Soon?
This is the latest headline that I saw today that portends a possible food crisis by late this summer.
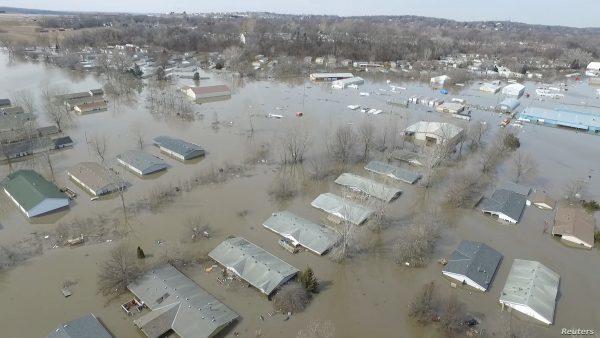
The main reason for this is that North America has been very wet this spring. Much of America's midwest farm land is flooded.
Why isn't this in the news headlines?
Tuesday, May 21, 2019
Food Inflation Run Amok!
Agricultural commodity prices continue to rise sharply. This is the price of corn over the past several days. Other agricultural commodities are rising as well. I wonder when food prices in the stores will begin to reflect this sharp rise. Flooded farms are the cause! Much of the United States has had a very wet spring this year, and many farms are flooded. Planting is only at 30%. It is typically more than double that amount by this time in May.
This first chart is the 4 hour chart:


