
Margin debt suggests that the stock market has topped out. It is a reliable leading indicator that points at a subsequent decline on a consistent basis.
Mark Hulbert on Marketwatch said this morning that "...margin debt typically peaks in advance of the stock market itself. In
2007, for example, margin debt peaked in July, three months before the
bull market topping out in October. As Wolf Richter of the Wolf Street
investment blog bluntly put it: Margin debt “has a bone-chilling habit
of peaking right around the time stocks crash.”
A word to the wise is sufficient!
Tuesday, October 11, 2016
Ominous Sign Stocks Have Peaked
Tuesday, September 6, 2016
Ouch! Fed's Own Labor Market Indicator Declines 7 of 8 Months!
Nevertheless, stocks are higher today1 What a bubble!


Wednesday, August 24, 2016
Central Bankers Make Bubbles Much Worse
"...Recessions are a normal condition to a market
economy as they are regulating any excess, bankrupting the weakest
players or those with the highest leverage. However, one of the
mandates of central banking is to fight a process
(business cycles) that occurs "naturally". The interference of
central banks such as the Federal Reserve appear to be exaggerating
the amplitude of bubbles and the manias that fuel them. It could be
argued that business cycles are being replaced by phases of booms
and busts, which are still displaying a cyclic behavior, but subject
to much more volatility. Although manias and bubbles have taken
place
many times before in history under very specific circumstances
(Tulip Mania, South Sea Company, Mississippi Company, etc.), central
banks appear to make matters worst by providing too much credit and
being unable or unwilling to stop the process with things are
getting out of control (massive borrowing). Instead of economic stability regulated by
market forces, monetary intervention creates long term instability
for the sake of short term stability."
--Professor Dr. Jean-Paul Rodrigue, Hofstra University
Monday, August 15, 2016
When Is a Bubble Not a Bubble?

Stock Valuations At Bubble Levels
The outcome of years of yield-seeking speculation induced by central banks is that investors across the globe have now locked in zero prospective total returns in virtually in every asset class for the coming decade... We actually view this period as the extended top-formation of the third speculative bubble in the past 16 years, not as a representative sample of things to come. -- Dr. John Hussman, PhD, August 15, 2016
Tuesday, August 2, 2016

Saturday, July 30, 2016
US GDP Growth -- Just Half of What Was Forecaast!
Deutsche Bank's Dominic Konstam summarized GDP data yesterday:
The latest GDP release favors our hypothesis of an imminent
endogenous labor market slowdown over a more optimistic scenario in
which productivity will replace employment as the engine for growth.
With real GDP growing at just 1.2%, there is little evidence that productivity is ready to do the heavy lifting. We are particularly concerned because annual nominal growth has slowed to 2.4%, essentially a cyclical trough.
Deutsche Bank calculates, on an annual basis, the non-consumer
portion of the economy is shrinking, i.e., in a recession, not only in
real terms but also in nominal terms.
Business spending is in recession. Equipment
spending fell -3.5% in the quarter and is down nearly -2% over the last
year. At the same time, spending on structures was down -7.9% in the
quarter and -7.0% over the last four quarters. The only pocket of
strength within the nonresidential fixed investment sector was
intellectual property products; this category, which includes software,
R&D, and entertainment, literary and artistic originals, advanced a
modest 3.5% in the quarter, and at a similar rate over the last year.
While some of the weakness in investment spending has been due to the
collapse in oil prices, non-energy-related spending has been soft, too,
reflecting weak internal and external demand, excess slack and corporate
uncertainty regarding the outcome of this year’s Presidential Election.
While investment spending may get a slight boost over the next couple
of quarters as the energy investment drag abates, we expect corporate
outlays to remain stagnant until next year.
Housing stumbles. Residential investment declined
-6.1% last quarter following a 7.8% in the previous quarter. Since the
sector bottomed in Q3 2010, it has grown at an annualized rate of 8.6%.
Elevated housing affordability coupled with low vacancy rates tells us
that residential investment should rebound this quarter and next.
We should expect a sharp pullback in spending this quarter. Indeed,
the recent softness in motor vehicles sales, which are one of our five
favorite economic indicators, may be hinting as much. We can see
in the chart below that the toppyness in vehicle sales does not bode
well for the underlying trend in consumer spending. Besides, as
we have written on numerous occasions, gains in consumer spending alone
are not enough to prevent a broader economic downturn. There
have been numerous economic cycles when year-over-year consumer spending
was positive but the economy still entered a downturn. Witness what happened during the 1981 to 1982 and 2001 recessions.
And, monetary policy has
effectively exhausted itself, so there is little that policymakers
can do to offset any further slowing in demand. With respect to the
second half, we continue to project sub-2% growth, a view that we
have held for some time.
Saturday, July 16, 2016
Race To The Bottom
"To understand what’s happening in the financial markets, it’s important to recognize the sequential nature of yield-seeking speculation....
With every extension of quantitative easing, the public is left with a lower-quality stock of speculative assets...
Ultimately, all that quantitative easing does is to remove
higher-quality interest-bearing securities from public hands, replace
them with zero-interest cash, and leave a remaining stock of
lower-quality speculative assets that then have to compete with that
cash...
"...the global economic outlook has experienced a downward
shock in recent weeks, largely as a result of the “Brexit” referendum
where British citizens voted to exit the European Union, coupled with
deterioration in China that has led it to accelerate the depreciation
of its currency. That combined deterioration, coupled with expectations
of further central bank easing, has resulted in a plunge in global
interest rates...
This advance in asset prices isn’t a reflection of economic health. To
the contrary, it is a yield-seeking race to the bottom resulting from a
downward shock to the global economy."
--Dr. John Hussman PhD.
Friday, July 15, 2016

Wednesday, June 15, 2016
Fed Leaves Rates Unchanged

Friday, June 10, 2016
Thursday, June 9, 2016
Bill Gross: Supernova of Debt Will Explode


Wednesday, June 8, 2016
Who's Buying All Those Bad-News Dips?
V-rallies everywhere! Who is buying all those dips as the news becomes more and more morose in recent months? Some suggest the Fed is behind it. After all, there is no limit to how much electronic money they can create out of thin air!

Another tell-tale sign of manipulation: the buying halts almost the moment stocks get to 2,100 on the S&P 500. At this point the manipulation ends. And because there are few REAL investors buying stocks at these levels, the market immediately retreats.
Could it be that the Fed or Plunge Protection Team is aware that earnings are collapsing… signaling that this stock market bubble is ready to burst? -- Phoenix Capital Research
Monday, June 6, 2016
Central Bank Delusions
"This is the market we have now: dominated by delusional, irrational central planners with unlimited powers to create money out of thin air to fund their manipulations.Read the rest here!
The only rational response is to trade accordingly: anticipate constant manipulation, anticipate constant bombastic propaganda of the "whatever it takes" variety, and anticipate massive selling of volatility to maintain the ever-so-important illusion that global risks have been disappeared by central banks and central planners.
Until the central planning madness destroys markets' ability to discover price and allocate capital. Then you end up with Venezuela: a failed state and a broken economy that can no longer feed its people despite the nation's vast oil wealth.
Volatility has been chosen as a "signaling device" by central planners. A low VIX signals all is well and risk is non-existent, so central planners suppress VIX.
In a world roiled by staggeringly large risks, can VIX be suppressed forever? That's a difficult question in a market dominated by irrational central planners." -- Charles Hugh Smith, Of Two Minds blog.
Thursday, June 2, 2016
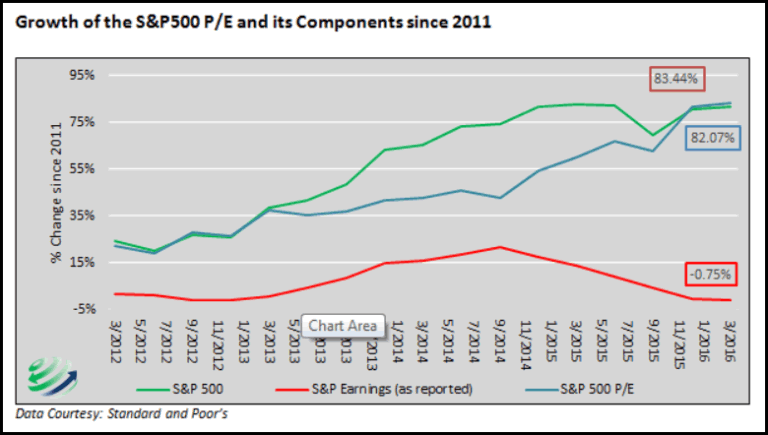
Growing Gap Between Earnings and Stock Valuations
According to Michael Lebowitz of 720 Global Research (quoted in the article):
Since October 1, 2011, the S&P 500 has risen 82% on the heels of a 0.75% decline in earnings. The price to earnings ratio over that time period has risen 83%, with price gains contributing 99% to the increase. Prices have risen substantially, while earnings have actually fallen. The chart below highlights the growing gap between earnings and the S&P 500.”
Wednesday, May 25, 2016
Services PMI Near Record Lows As Stocks Approach Record Highs

“A
deterioration in the survey data for May deal a blow to hopes that the
US economy will rebound in the second quarter after the dismal start to
the year." -- Chris Williamsen at Markit, commenting on this data.
Tuesday, May 24, 2016
Correlation Between USDJPY Currency Pair and Stocks
This correlation between the Japanese Yen and stocks has been demonstrated for a very long time. Does the Bank of Japan control the US stock market? It sure looks like it!

Richmond Fed Contracts Most Ever Recorded

Friday, May 20, 2016

Thursday, May 19, 2016

Tuesday, May 17, 2016
Another Sign of Stagflation
On Marketwatch this morning:

Low wages combined with high rents. Let's try a little math:
high rent + stagnating wages = stagflation
Industrial Production Stuck In a Slump... Even As Inflation Rises... And Wages Slide!!
This spells S-T-A-G-F-L-A-T-I-O-N to me!

But the central bankers are doing everything they can to increase inflation to meet their inflation GOAL! Yes, the Fed has an inflation GOAL! (They then doctor the inflation data to understate the actual inflation!)


Recession Lurks? A Word to the Wise...
Key indicators, especially the leading ones, have been flashing red for the past year. This headline today was on Marketwatch:

Suffice it to say... a word to the wise is sufficient!
Friday, May 13, 2016
The Equity Exodus
Marketwatch has an article today showing heavy volume among investors that are running for cover. Fear is back! And the price of Federal bonds confirms it also. Treasuries have been rising steadily since late April!


Sunday, May 8, 2016
Albert Edwards: "It ends badly."
"Let me tell you how all this ends.
"It ends with investors accepting that they can pretend no longer and profits are sliding into recession.
"It ends as the equity market spirals into a deep bear market as
company management reach the end of the road in the face of the
recessionary conditions and 'kitchen sink' years of EPS manipulation.
"It ends as corporate bond spreads explode as years of excess debt
accumulation lead to widespread corporate bankruptcies, making the
recession much deeper.
"It ends with social unrest and double digit budget deficits (again).
"It ends with investors losing faith with the Fed as the resumption of QE proves ineffective in reviving the economy.
"It ends in deeply negative interest rates, currency and trade wars, helicopter money and ultimately inflation.
"In a nutshell, it ends badly."
--- Albert Edwards, Societe Generale
Tuesday, April 26, 2016
Economic Headlines for April 26, 2016
Ouch all the way around. Let's begin with the doctored data from the Atlanta Fed:


Bank of America's largest institutional, private clients are net sellers:
"Bank of America's "smart money" (institutional, private and hedge funds) clients, simply refused to buy anything, and in fact had continued to sell stocks for a near-record 12 consecutive weeks. In fact, the selling continued despite what we said, namely that "at this point it was about time for the selling to stock, if purely statistically, otherwise said "smart money" would be sending the clearest signal yet that the market rally from the February lows is nothing but a huge gift to sell into.""BofAML clients were net sellers of US stocks for the thirteenth consecutive week last week—making it the longest uninterrupted selling streak in our data history (since 2008) as clients continued to doubt the market rally."
According to BofA, "net sales were $3.8bn, the biggest in three weeks but the sixth-largest in our data history (since ’08), with sales from hedge funds, private clients and institutional clients alike. This follows a week of net buying by hedge funds the prior week; institutional and private clients have both been consistent net sellers since February. Clients sold stocks in all three size segments, and year-to-date only small caps have seen cumulative inflows."
Friday, April 22, 2016
Global Anarchy Coming When Central Bankers' Shennigans Blow Up?
Societe Generale's Global Strategist Albert Edwards said today that he feels "utterly
depressed". He proclaims that he hasn't "one scintilla of doubt that these
central bankers will destroy the enfeebled world economy with their
clumsy interventions and that political chaos will be the ugly result. The
only people who will benefit are not investors, but anarchists who will
embrace with delight the resulting chaos these policies will bring!"
Wow!
Monday, April 18, 2016
Dow Tops 18,000 Even As Earnings Hit 12-Month Lows
Who needs an economy? Who needs jobs? In a world of digital money, who even needs reality? We have digital prosperity now!


Friday, April 8, 2016
Look Out Belooooow! Fed Slashes GDP Estimate!
Recession alert:
Last month, the Fed slashed the Q1 2016 GDP estimate from 1.2% to just .4%. Now today, it slashed it even further to just .1%! That's barely breathing!


Monday, April 4, 2016
Headlines for April 4, 2016


Sunday, April 3, 2016
The Illusion Continues, With Support By Central Bankers


And when will this happen? I don't know! My best guess is that it will occur during the next recession as the following happens:
1) Revenues to the US government collapse due to lay-offs and fewer people are working.
2) Demands for entitlement spending skyrocket, and more and more people require help with housing and food.
Of this I am certain:
1) The interest on US government debt is now about $1/2 trillion per year.
2) The US government will borrow an additional $1/2 trillion this fiscal year.
3) The Congressional Budget Office forecasts that by the end of the next president's first term of office, the US will be borrowing $1 trillion/year! That's about 1/4 of the budget!
This guarantees a debt crisis sometime in the next few years! It will collapse the bond market and the US Dollar. It will bring a depression that will dwarf the Great Depression of the 1930s. It will likely also bring horrible bloodshed as desperate people engage in desperate behavior to survive.
Tuesday, March 29, 2016
The Power of One Central Banker

Should any one person have that kind of power to manipulate the market? It doesn't change the magnitude of risk to investors. It only changes the perception of risk, and the willingness to take greater and greater risk. When investors are once again forced to acknowledge that risk, the consequences will be calamitous!
Tuesday, March 22, 2016
A US Government Debt Crisis Is Ineluctable!
I placed this comment on a finance website earlier today:
- US Government debt is growing more than 2 times faster than GDP. Q4 2015 GDP = 1.2%, debt growth this year is 2.6%.
- Interest alone on the debt is $.5 trillion this year! And that's with central bank interest rate suppression!
- The US CBO says that by the end of the next president's first term, the US will begin to incur $1 trillion debt per year -- indefinitely.
- If interest rates on the 2-yr bond return to just 2% per year, the interest will consume virtually ALL US government revenue just to pay the interest on the national debt.
- There are now more recipients of government assistance, than there are taxpayers paying for those benefits! And it's not even close!

Friday, March 18, 2016
The Bubble Is Back!


Thursday, March 17, 2016
Economic DIchotomy -- Stocks Soar As Earnings Crash
I couldn't help noticing the contradiction today between stocks, which just went positive for 2016, and both employment and corporate earnings! This is what a bubble looks like!


Wednesday, March 2, 2016

Tuesday, March 1, 2016


Hey Reuters! How About Some Propaganda?

Less than 2 hours later, it was revised to this:

The folks at Google caught on to the tomfoolery:

Subscribe to:
Posts (Atom)


