May I nominate this man for Treasury Secretary, or better yet, Fed Chairman?
John P. Hussman, Ph.D.
For investors who don’t rely much on historical
research, evidence, or memory, the exuberance of the market here is
undoubtedly enticing, while a strongly defensive position might seem
unbearably at odds with prevailing conditions. For investors who do
rely on historical research, evidence, and memory, prevailing conditions
offer little choice but to maintain a strongly defensive position.
Moreover, the evidence is so strong and familiar from a historical
perspective that a defensive position should be fairly comfortable
despite the near-term enthusiasm of investors.
There are few times in history when the S&P
500 has been within 1% or less of its upper Bollinger band (two
standard deviations above the 20-period moving average) on daily,
weekly and monthly resolutions; coupled with a Shiller P/E in excess of
18 – the present multiple is actually 22.3; coupled with advisory
bullishness above 47% and bearishness below 27% - the actual figures
are 51% and 24.5% respectively; with the S&P 500 at a 4-year high
and more than 8% above its 52-week moving average; and coupled, for good
measure, with decelerating market internals, so that the
advance-decline line at least deteriorated relative to its 13-week
moving average compared with 6-months prior, or actually broke that
average during the preceding month. This set of conditions is
observationally equivalent to a variety of other extreme syndromes of
overvalued, overbought, overbullish conditions that we've reported over
time. Once that syndrome becomes extreme - as it has here - and you get
any sort of meaningful "divergence" (rising interest rates,
deteriorating internals, etc), the result is a virtual Who's Who of
awful times to invest.
Consider the chronicle of these instances in
recent decades: August and December 1972, shortly before a bull market
peak that would see the S&P 500 lose half of its value over the
next two years; August 1987, just before the market lost a third of its
value over the next 20 weeks; April and July 1998, which would see the
market lose 20% within a few months; a minor instance in July 1999
which would see the market lose just over 10% over the next 12 weeks,
and following a recovery, another instance in March 2000 that would be
followed by a collapse of more than 50% into 2002; April and July 2007,
which would be followed by a collapse of more than 50% in the S&P
500, and today.
The prior instances were sometimes followed by
immediate market losses, and were sometimes characterized by extended
top formations - which produce a sort of complacency as investors say
“see, the market may be elevated and investors may be over-bullish, but
the market is so resilient that it’s ignoring all that, so
there’s no reason to worry.” Ultimately, however, the subsequent plunges
wiped out far more return than investors achieved by remaining
invested once conditions became so extreme. We are in familiar
territory, but that territory generally marks the mouth of a vortex.
Based on ensemble methods that capture a century
of evidence – from Depression-era data, through the New Deal, World
War, the Great Society, the electronics boom, the energy crisis,
stagflation, the great moderation, the dot-com bubble, the tech crash,
the housing bubble, the credit crisis, and even the more recent period
of massive central bank interventions – our estimates of prospective
market return/risk have been negative since April 2010 and have
remained negative even as new data has arrived. Since early March, those
estimates have plunged into the most negative 0.5% of historical
instances.
It’s worth noting that the S&P 500 posted a
negative total return between April 2010 and November of last year. Of
course, the market has also enjoyed a risk-on mode since then. Through
Friday, the S&P 500 has achieved a total return of nearly 25% since
our return/risk estimates turned negative in early 2010. Defensiveness
has clearly been taxing in that respect. But this doesn’t remove the
question of whether the market’s recent gains are durable, much less
whether they will be extended. Corporate insiders certainly don’t seem
to think so – their sales have tripled since July, to a rate of six
shares sold for each share purchased.
Far from being some novel “new era” environment,
present conditions – rich valuations, overbought trends, lopsided
bullishness, heavy insider sales, and lagging market internals – are
part of a historical syndrome that is very familiar in the sense that
we’ve repeatedly seen it prior to the worst market declines on record.
But as the chronicle above should make clear, this doesn’t make our
short-term experience any easier, because these conditions can emerge,
go dormant for a few months while the market retreats modestly, and
then reappear as the market registers a marginal new high. The ultimate
outcome has historically been spectacularly bad, but it still takes
patience and discipline to stay on the sidelines during late-stage,
high-risk advances. Of course, the present instance may turn out
differently than every prior instance has – it’s just that we have no
basis to expect that outcome.
Economic Notes
The most interesting feature of last week’s
“decision” by the European Central Bank was the continued eagerness of
investors to hear what they want to hear, rather than what is actually
said. With little doubt, what investors think they heard was
that the ECB has finally decided to launch a new program by which it
will begin purchasing Italian and Spanish debt in unlimited – unlimited – amounts, putting an emphatic end to European debt strains, and decisively ensuring the future unity of the Euro.
Here is what the European Central Bank
actually said:
“A necessary condition for Outright Monetary
Transactions is strict and effective conditionality attached to an
appropriate European Financial Stability Facility/European Stability
Mechanism (EFSF/ESM) programme. Such programmes can take the form of a
full EFSF/ESM macroeconomic adjustment programme or a precautionary
programme (Enhanced Conditions Credit Line), provided that they include
the possibility of EFSF/ESM primary market purchases. The involvement
of the IMF shall also be sought for the design of the country-specific
conditionality and the monitoring of such a programme.”
If you wondered why Angela Merkel and the whole of
Germany was not immediately up in arms, it is because prior to
transactions by the ECB, the receiving country would have to submit to
an adjustment program, ideally involving the IMF. This is nothing like
what Spain has been asking for, which is for the ECB to make unconditional
purchases. To benefit from the proposed OMT program, these countries
have to subordinate their fiscal policy to outside conditionality.
What if they don’t?
“The Governing Council will consider Outright
Monetary Transactions to the extent that they are warranted from a
monetary policy perspective as long as programme conditionality is
fully respected, and terminate them once their objectives are achieved
or when there is non-compliance with the macroeconomic adjustment or
precautionary programme.”
But assuming these countries accept the
adjustment programs, at least they can be assured that the ECB will buy
their debt in unlimited amounts, can’t they?
“No ex ante quantitative limits are set on the size of Outright Monetary Transactions.”
Read carefully – the ECB did not promise
“unlimited” financing. Rather, it refused to specify an amount in
advance (ex-ante), because it doesn’t want the markets to look at some
inadequately small and fixed number and begin to speculate against the
ECB as soon as that particular number is approached. By refusing to set
a specific amount in advance, Draghi said in his press conference that
he wanted the policy to be perceived as fully effective. But
perception substitutes for reality only for so long. If Merkel, Monti
and Rajoy were stranded on a mountaintop and Merkel was the only one
with a bag of muesli, she might offer some to the other two without
specifying an amount in advance, but there’s no doubt she’d be slapping
it out of their hands if things got out of control.
Finally, “The liquidity created through Outright Monetary Transactions will be fully sterilised.”
This last provision is likely to both calm
Germans and inflame them. Sterilization means that for every euro of
Spanish or Italian bonds the ECB buys (creating new euros in the process), it will drain euros by selling
some other security – most likely bonds of Germany, Holland, Finland,
or other stronger European nations. This will help to calm Germans
because it indicates that the overall supply of euros will not expand.
It will also inflame them, however, because the existing stock of euros
will now have been created to provide fiscal support to Spain, Italy
and other troubled countries, while Germany, Holland, Finland and
stronger countries will not have benefited at all from the money
creation.
It will be interesting how this plays on
September 12, when the German Constitutional Court is set to decide on
the legality of the European bailout funds, the EFSF and the ESM
(technically, the Court will rule on an injunction against even passing
it into law, but will not formally rule on constitutionality until
possibly next year). My expectation is that they will rule that these
mechanisms are in fact allowable and consistent with the
German Constitution. Where it gets interesting is whether they will
rule that it is allowable to leverage these mechanisms or operate with a
banking license (which would make Germany’s existing contribution
“capital” that could be wiped out, leaving Germany on the hook for
much, much larger amounts - which essentially cedes fiscal authority
from the German people to the ESM). I suspect that there is a fair
chance that the Court will add language in their ruling to reject that
possibility, which may force the idea of a “big bazooka” back to square
one. We’ll see.
---
Here in the U.S., Friday’s August employment
report was surprisingly weak relative to Wall Street’s expectations,
though hundreds of thousands of workers abandoned the labor force,
which allowed the unemployment rate to decline. Relative to our own
expectations, the figure was elevated, as I expect that the August
employment figure will ultimately be revised to a negative reading. This would be consistent with revisions that we’ve seen around prior recession starting points.
For example, if you look at the originally
reported data for May through August 1990, you’ll see 480,000 total
jobs created (see the October 1990 vintage in
Archival Federal Reserve Economic Data). But if you look at the revised data as it stands today, you’ll see a
loss
of 81,000 jobs for the same period. Look at January through April
2001, at the start of that recession. The vintage data shows a total
gain of 105,000 jobs during those months, while the revised data now
shows a
loss of 262,000 jobs. Fast forward to February through
May 2008, and though you’ll actually see an originally-reported job
loss during that period of 248,000 jobs, the revised figures are still
dismal in comparison, now reported at a loss of 577,000 jobs for the
same period. As other good economic analysts have recognized, economic
time series tend to be revised after-the-fact, with upward revisions in
periods just before the recession begins, and downward revisions in
periods just after the recession begins. I continue to believe that the
U.S. joined an unfolding global recession, most probably in June of
this year.
---
Ahead to QE3. A week ago, The Wall Street Journal ran a piece by Jon Hilsenrath titled
Will Fed Act Again? Sizing Up Potential Costs.
The article reviewed concerns about additional quantitative easing,
noting that inflation has remained muted and the dollar has remained
firm. Both of those outcomes were presented as evidence counter to Fed
Governor Charles Plosser’s concern that “Without appropriate steps to
withdraw or restrict the massive amount of liquidity that we have made
available… the inflation rate is likely to rise to levels that most
would consider unacceptable.”
There is strong evidence to suggest that this is
little but false comfort. While we don’t expect material inflationary
pressures until the back-half of this decade, the Federal Reserve has
increasingly placed itself into a position that will be nearly
impossible to disgorge without enormous disruption. Specifically, the
U.S. economy could not achieve a non-inflationary increase in Treasury
bill yields to even 2% without requiring a nearly 50% reduction in the
Federal Reserve’s balance sheet.
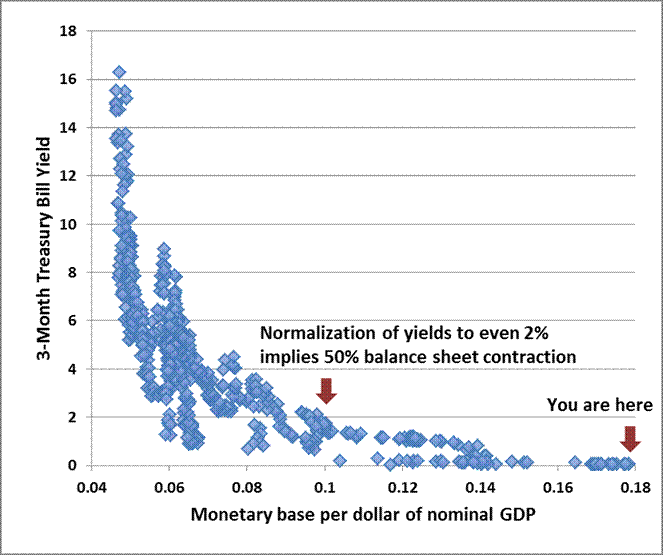
This point is easily demonstrated in data from
1947 to the present. The relationship between short-term interest rates
and the amount of monetary base per dollar of nominal GDP is very
robust, and is widely recognized as the “liquidity preference” curve.
We are already way out on the flat part of this curve. Note that
Treasury bill yields have never been at even 2% except when there was
less than 10 cents of base money per dollar of nominal GDP. There are
only 3 ways to get there from the current 18 cents – dramatically cut
the balance sheet, keep interest rates near zero for the next decade (assuming nominal GDP growth of 5% annually), or accept much higher rates of inflation than most would consider acceptable.
Moreover, with a portfolio duration that we now
estimate at about 8 years, historically low yields on Treasury
securities, and a Fed balance sheet currently leveraged about 53-to-1
against the Fed’s own capital, an increase in long-term yields of
anything more than 20 basis points a year would produce capital losses
sufficient to wipe out interest income, making the Fed effectively
insolvent, and turning monetary policy into fiscal policy.
On the subject of Fed leverage, it is one thing to
purchase long-dated bonds when yields are high. It is another to
purchase them when yields are at record lows and very small yield
changes are capable of wiping out all interest income and leaving the
Fed in a loss position when it is already levered 53-to-1 (2.9 trillion
of assets on 54.6 billion of capital, according to the Fed’s
consolidated balance sheet). At a 10-year Treasury yield of just 1.6%
and a portfolio duration of about 8 years (meaning that a 100 basis
point move causes a change of about 8% in the value of the securities
held by the Fed), it takes an interest rate increase of only about 20
basis points (1.6/8) to wipe out a year of interest on the portfolio
held by the Fed and push it into capital losses. It would then take
another 24 basis points to wipe out all of the capital on the
Fed’s balance sheet. Of course, they don’t mark the balance sheet to
market. So the public might not be aware of those losses, but that
would only mean that we would have an insolvent Fed printing money on
an extra-Constitutional basis to fund its own balance sheet losses
instead of public spending.
Based on a report from UBS (h/t
ZeroHedge),
the Federal Reserve now holds all but $650 billion of outstanding
10-30 year Treasury securities, with UBS warning “a large, fixed size
QE program could cause liquidity to tank”, with a similar outcome in
the event that the Fed pursues mortgage-backed securities instead. A
couple of years ago, Bernanke asserted in a 60 minutes interview that
“We could raise interest rates in 15 minutes if we have to. So there is
really no problem in raising interest rates, tightening monetary
policy, slowing the economy, reducing inflation, at the appropriate
time.” Really? Tell that to Paul Volcker, who had to deal with enormous
inflation at unemployment rates even higher and a monetary base
dramatically smaller than we observe at present.
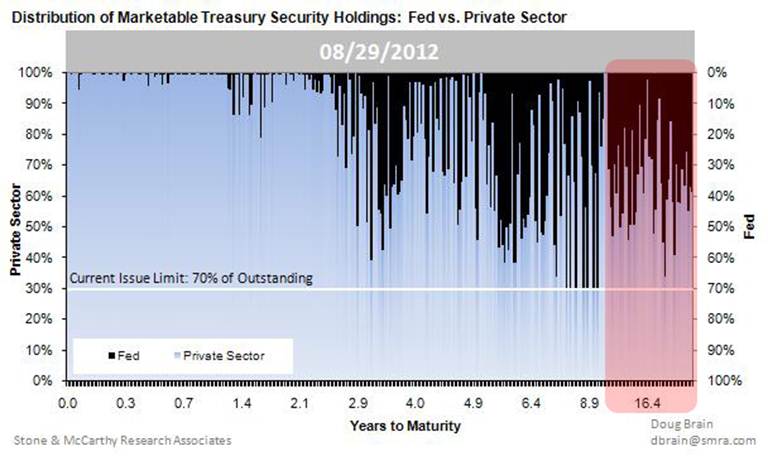
The Fed now holds virtually no Treasury debt of
maturity of less than 3 years, as Operation Twist and other efforts
have been designed to force investors to choke on short-dated paper
yielding next to nothing, in hopes of forcing them into riskier
securities. The chart below shows the distribution of Fed holdings
(dark bars) versus private sector holdings of Treasury debt, at various
maturities. Of course, in equilibrium, someone still has to
hold the short-dated Treasury securities, in addition to about $2.7
trillion in zero-interest cash and bank reserves, until those
securities, currency, and reserves are retired. To believe that an
unwinding of the Fed’s present balance sheet would not be disruptive is
full-metal make-believe.
Good economic policy acts to relieve some binding
constraint on the economy. How does the Fed argue that base money is a
binding constraint? At present, there are trillions of dollars held as
idle reserves on bank balance sheets. While a “portfolio balance”
perspective may well suggest that additional zero-interest reserves
will force more investors into risky assets at the margin (which has
been most effective after significant market declines over the prior
6-month period), so what? There is no historical evidence that changes
in stock market value have a significant effect on GDP. Indeed, a 1%
change in stock market value is associated with a change of only
0.03-0.05% in GDP, largely because individuals consume off of their
expectation of “permanent income”, not off of transitory changes in
volatile securities.
In regard to why inflation has remained low, a
useful way to see the relationship between the monetary base, interest
rates, GDP and inflation is the “exchange equation”: MV = PQ, where M
is base money, V is velocity, P is prices, and Q is real output. As is
evident from the liquidity preference chart, base velocity (PQ/M) is
tightly related to short-term interest rates. In fact, as long as
short-term interest rates fall in response to increases in the monetary
base, those increases have virtually no effect on real output, but
instead translate almost directly into declines in velocity. Again,
some data from 1947 to the present:
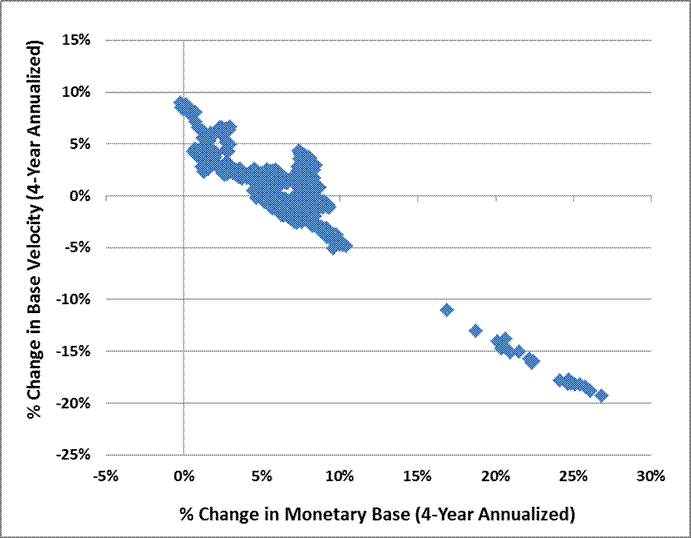
If the decline in velocity exactly offsets the
increase in base money, inflation is not going to explode overnight.
But this happy outcome is brought to you by the passive response of
short-term interest rates and the willingness of the public to
accumulate zero-interest assets, which is in turn the result of strong
and legitimate concerns about credit risk, default risk, and economic
weakness. But remove any of those factors, or allow any other exogenous
upward pressure on short-term interest rates, and the result will be
upward pressure on velocity. Barring enormous rates of real GDP growth,
the only way to counter that, as the first chart suggests, will be
through either massive (and potentially disruptive) contraction of the
Federal Reserve’s balance sheet, or acceptance of undesirable rates of
inflation.
As hedge funds often discover, and JP Morgan
recently learned, it is very easy to get into a position that later
turns out to be nearly impossible to exit smoothly. A significant
reduction in the Fed’s balance sheet is unlikely to be achieved at
long-term interest rates nearly where they are now, which implies
capital losses on the Fed account, which implies that in contemplating a
further round of quantitative easing, the Federal Reserve is
effectively contemplating a fiscal policy action.
Unfortunately, they’re likely to do it anyway.
From an investment perspective, it’s important to
consider the potential effect of additional quantitative easing. As I
noted several weeks ago (see
What if the Fed Throws a QE3 and Nobody Comes?),
the effect of prior rounds of quantitative easing both in the U.S. and
abroad has generally been limited to little more than a recovery of
the loss that the stock market sustained over the prior 6-month period.
Presently, the S&P 500 is at a 4-year high, valuations are rich on
the basis of normalized earnings, and advisory sentiment exceeds 50%
bulls – over twice the number of bearish advisors according to Investors
Intelligence. In recent years, each round of QE emerged closely on the
heels of a significant market loss that produced a spike in risk
premiums. In that environment, expanding the stock of zero-interest
rate assets had the effect of bringing those risk premiums back down to
those observed over the prior 6-months or so, and more recent
interventions have shown diminishing returns. At present, risk-premiums
are already depressed and there is no 6-month loss to recover.
In short, even the evidence of the past several
years does not support the automatic assumption that stock prices will
advance in the event of another round of QE at present levels. With
little doubt, the market is likely to enjoy some immediate cheer from
that sort of move, particularly if the Fed refrains from providing a
specific ex-ante limit on its purchases - allowing investors to rejoice
in the perception that the Fed had launched “unlimited” QE. Still,
that cheer may be short-lived. If we examine the way that QE actually
operates, and how and why risk premiums have responded to prior rounds,
it is entirely unclear that a further round will have much effect
beyond an initial spike of enthusiasm. That is, unless one adopts a
superstitious faith that stocks will rise in response to QE, since QE
makes stocks rise, because QE equals stocks rising, with no further
analysis needed.
The foregoing comments represent the
general investment analysis and economic views of the Advisor, and are
provided solely for the purpose of information, instruction and
discourse. Only comments in the Fund Notes section relate specifically
to the Hussman Funds and the investment positions of the Funds.


![[image]](http://si.wsj.net/public/resources/images/OB-UN824_crops0_D_20120912093933.jpg) Reuters
Reuters


