Thursday, November 14, 2013

Stocks Scream As Yellen Promises More Easing

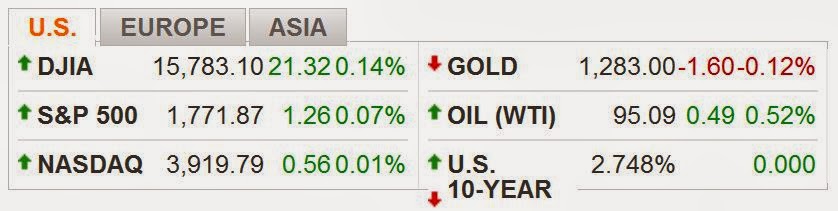
Stocks climb still higher into the Bubble Belt on promises by the new Fed QEeen, Calamity Janet Yellen, that she will continue the Fed's debt roulette indefinitely!


Wednesday, November 13, 2013

THIS Is What a Bubble Looks Like!

Note that in the final stages of a bubble, prices no longer have both ups and downs. They go parabolic -- straight UP! All that is needed to send things crashing through the floor boards is the right trigger event. Only God knows what that will be or when, but it WILL come!

 Another classic manifestation of a bubble is that small investors begin to "pile on", thinking that the bubble asset class is a "sure thing", and that they "can't lose". Data now shows that this pattern is now occurring, with small "retail investors" -- Main St, not Wall St -- shoveling money into the stock market at a record pace.

Wall St insiders know that this is the time to get OUT of the market. They use this last stage of parabolic rises to sell. They "take their money and run". They have also been doing this since this past summer.

Still another classic characteristic of a bubble is that investors are so convinced that the bubble will continue to rise in perpetuity, that they go deep into debt to put the money into the market, thinking that they can't lose. But when the trigger event occurs, they ALL lose because there is no one willing to buy in a collapsing bubble market. Who wants to try to catch a falling knife? And all those highly-leveraged investors get slaughtered as the market collapses. In the past few months, margin debt has reached all-time highs, with investors borrowing record amounts of money to go "all in". They never realize that this behavior is textbook bubble behavior. It's all psychology!

Interestingly, most small investors also have a bad habit of "holding on", even as the market falls further and further, hoping beyond hope that the market will turn around and redeem them in the end. It never does. Small investors ironically tend to sell and leave the market just about the time that the market reaches its nadir and starts going UP again!

It's Another All-Time Record, Uh, BUBBLE!


More Dire Headlines Than Ever Before


Today's Headlines for November 13, 2013

And on these worries, stock futures are modestly lower:

History Repeats Itself! The Similarity Is Eery!

from Zero Hedge:

While chart analogs provide optically pleasing (and often far too shockingly correct) indications of the human herd tendencies towards fear and greed, a glance through the headlines and reporting of prior periods can provide just as much of a concerning 'analog' as any chart. In this case, while these 3 pictures can paint a thousand words; a thousand words may also paint the biggest picture of all. It seems, socially and empirically, it is never different this time as these 1936 Wall Street Journal archives read only too well... from devaluations lifting stocks to inflationary side-effects of money flow and from short-covering, money-on-the-sidelines, Jobs, Europe, low-volume ramps, BTFD, and profit-taking, to brokers advising stocks for the long-run before a 40% decline.
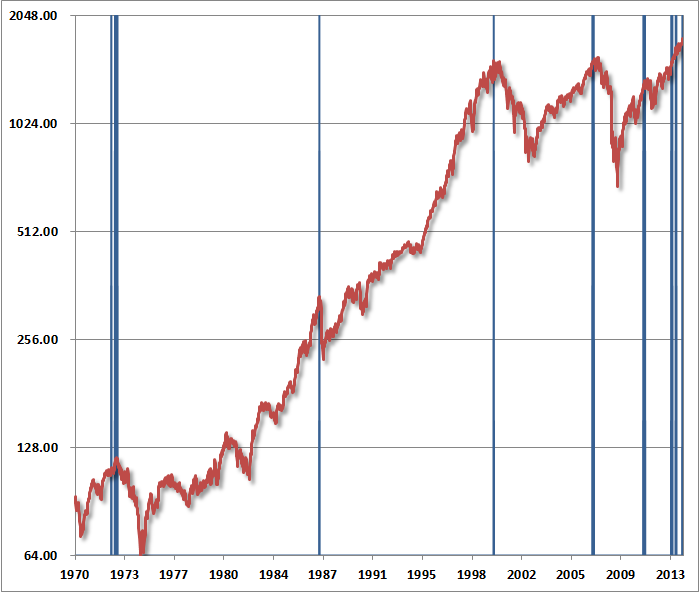
Stocks look eerily similar...

Income inequality has ramped back to the same levels...


and Rates look awfully similar.... (h/t @Not_Jim_Cramer)

and that didn't end well... (War!)
But when we look at the headlines in the Wall Street Journal from mid 1936 to mid 1937 as the market topped out, dipped, was bought back (orange oval), then collapsed 40% in 3 months, nothing ever changes...


Government Bailouts Repaid - Bullish Implications...


N.Y. Central Has Repaid All Government Loans
The Wall Street Journal, 978 words
Dec 1, 1936
WASHINGTON Numerous railroad developments here yesterday were climaxed by the announcement of RFC Chairman Jesse H. Jones that New York Central had repaid all of its government loans, totaling $16,858,950, most of which was not due until 1941.
The Buying Is Not Speculation - Cash On The Sidelines...
 
 
It's Cash Bull Market With Little Inflation, Says Exchange Bulletin
The Wall Street Journal, 169 words
Dec 16, 1936
"This is eminently a cash market, and as such is relatively devoid of that major characteristic of speculative inflation, the use of borrowed money." says the December Bulletin of the N.Y. Stock Exchange.
Inflationary Side-Effects - Buy It All It's Going Up...
 
 
Wheat Prices Soar To 7-Year Highs On Heavy Buying Stimulated by Broad Advances in Foreign Pits
The Wall Street Journal, 1497 words
Dec 19, 1936
CHICAGO An avalanche of buying, encouraged by buoyancy in foreign markets, particularly in Winnipeg, swept wheat prices to the highest levels since December, 1929, Friday.

But... 3 days before...
The Wall Street Journal, 1027 words
Dec 16, 1936
As commodity prices continued to advance yesterday to the accompaniment of increasing public speculation in futures markets, signs of a feeling of caution appeared from widely separated centers.
As Goes The US So Goes The Rest Of The World...
 
 
London Trade Stimulated By Wall Street Strength; Averages at New Highs
The Wall Street Journal, 859 words
Nov 6, 1936
LONDON Overnight strength in Wall Street considerably stimulated the stock market yesterday. Dealers again arrived earlier than usual in anticipation of activity in international issues and found large buying orders in these stocks awaiting execution.
Global Economy To Lift Stocks...
 
 
London, New York Stock Transactions Largest in Months - British Brokers Stand in Queues to Fill Orders Activity Ascribed to World Efforts to Revive Trade
The Wall Street Journal, 956 words
Oct 8, 1936
Growing realization that the determined international effort now being made to sweep away trade barriers will be followed by improved business conditions throughout the world brought a rush of business to the security markets in New York and London yesterday such as not been seen for months.
Devaluation Always A Winner... (Market Prices Prove Economy Likes It)
 
 
Wall Street Weighs Devaluation Effects On U.S. Markets; Sees Little Likelihood of Dumping
 The Wall Street Journal, 1759 words
Sep 28, 1936
Rising security and commodity markets Saturday gave ample indication of the financial district's "bullish" interpretation of the U.S. Anglo-French monetary agreement.
Markets Cheerful Over Devaluation; Morgenthau Not Afraid of Dumping
Selective Buying Here and Abroad Motors and Other Shares Held To Benefit From Improved World Trade Are Strong Commodities Less Responsive International Markets
The Wall Street Journal, 1726 words
Sep 29, 1936
A note of cautious optimism was sounded by leading stock exchanges of the world which were open for business yesterday.
Equity Valuations Irrelevant...
 
 
Earnings Yield of 15 Stocks 4.8%, Compared with 9.4% Ten Years Ago
The Wall Street Journal, 1280 words
Aug 7, 1936
Industrial earning power is valued nearly twice as highly in the current stock market as it was ten years ago.
Europe Ever The Optimist Even In The Face Of Dismal Reality...
 
 
France Optimistic Despite Continuing European Tension - Growing Franco-English Cooperation Inspires Confidence
The Wall Street Journal, 652 words
Dec 5, 1936
Despite the unabated international tension and sudden menace of a constitutional crisis in Great Britain, the continuance of quarrels between Right and Left wings of the Popular Front, and the persistent antagonism between employers and labor, the general feeling in France is rather optimistic than pessimistic.
Short Covering As Ever...
 
 
Active Short Covering Sweeps Grain Prices To New High Levels - Chases Bears
The Wall Street Journal, 1345 words
Dec 2, 1936
New highs for the season were recorded in wheat, corn, rye and oats Tuesday. Spot red winter wheat advanced to the highest level since February, 1929. The sharp upturn, which boosted December corn almost 5 cents, and December wheat about 3 cents, was due principally to short covering by those made uneasy over the sale of an unusually large quantity of spot wheat out of local store, and by generous snowfall over the grain belt. Early in the session the market ruled easy on reports of rain and snow, and predictions for continued unsettled weather.
Government Spending Cuts Cause Concern...
 
 
Sabotaging Federal Economy
The Wall Street Journal, 412 words
Dec 5, 1936
Even the modest beginning which is attempted by WPA officials to reduce cost of government by cutting down the relief roles is encountering strong opposition. It is perhaps only natural that the workers themselves should object, although their methods of protesting through "sitdown" strikes, not to mention the violence which has manifested itself, may be open to question. But much more ...
States And Taxes...
 
 
Sales Tax Repeal May Unbalance Kentucky Finances
The Wall Street Journal, 1002 words
Jan 14, 1936
LOUISVILLE, Ky.--Repeal of Kentucky's 3% sales tax, effective the moment Governor Albert B. Chandler signs it, probably Wednesday will deprive the state of $3,500,000 of revenue budgeted to the expiration of the biennium ending June 30, 1936 and the counties of $1,750,000.
The Foreign Money Will Save Us...
 
 
Financial Centers Expect Greater Foreign Interest in Our Securities As Congress Delays Alien Tax Boost - Foreign Interest Here
The Wall Street Journal, 765 words
Aug 6, 1937
Some resumption of foreign interest...
Money On The Sidelines...
 
 
The Wall Street Journal, 590 words
Jul 1, 1937
While the Street remains in a cautious frame of mind, there are undoubtedly more possible buyers than sellers around, and it would not take a lot of encouragement to get these gentlemen aboard. Feeling in brokerage circles is that stocks are more likely to advance on any break in the unpleasant headlines these days than to decline far on a continuation of current uncertainties.
Jobs And Europe never far from fear...
 
 
The Wall Street Journal, 683 words
Jun 29, 1937
Certainly the market was more active on the downside, which surprised a lot of traders who had expected otherwise. The labor and foreign situations remain the main factors in the picture, and brokers feel that these have not changed one whit for the better thus far.
Buy The F##king Dip...
 
 
The Wall Street Journal, 508 words
Aug 24, 1937
A rather depressed feeling is extant in Wall Street as small volume and lower prices continue. Yet there are not many bears in the Street so far as the long pull is concerned. Traders still are stubborn in their theory that stocks are reactionary at the moment from lack of interest rather than any important liquidation. This is the period of the year when business takes a final breathing spell before the more active Fall and some think the stock market is doing likewise and that better days are ahead.
Rallies had Real Volume Then - No Low Volume Ramps...
 
 
The Wall Street Journal, 564 words
Aug 16, 1937
If Saturday's volume was any indication, revived interest in the stock market is here in the opinion of the Street. Furthermore the scope of trading Friday and Saturday indicated a broadening interest which included medium priced as well as low priced issues on contrast to the extended period wherein so-called "quality" stocks held sway in a limited market with small volume.
And At The Top... Brokers Suggest Stocks For The Long-Run (based on 'expectations')
 
 
The Wall Street Journal, 665 words
Aug 7, 1937
Profit taking for the week-end brought prices down in yesterday's market, but the undertone remained steady and brokers said there was nothing important in the character of the selling. Many houses were advising the purchase of favored issues on any further reactions. Metal shares ended the day with advances in many cases. There was impressive buying reported in the copper issues largely for long pull purposes.
The Wall Street Journal, 649 words
Aug 10, 1937
While volume left much to be desired, the expectation of stronger and more active markets continued to pervade Wall Street. Moreover, the general business picture is regarded as more pleasing than at any time since the so-called Summer "lull" came into force. Incidentally, the seasonal letdown thus far has not proved to be as extensive as many predicted and expected. Brokers say that many clients are away and that there are others who will be replacing their sold-out long positions in coming weeks.
See - it really is never different this time. It merely appears so since - as Kyle Bass so eloquently noted, the brevity of financial memory is about two years...

Tuesday, November 12, 2013

Monday, November 11, 2013

Hussman: It's a Classic Pre-Crash Bubble

This man is the most brilliant mind in economics today. God bless him!

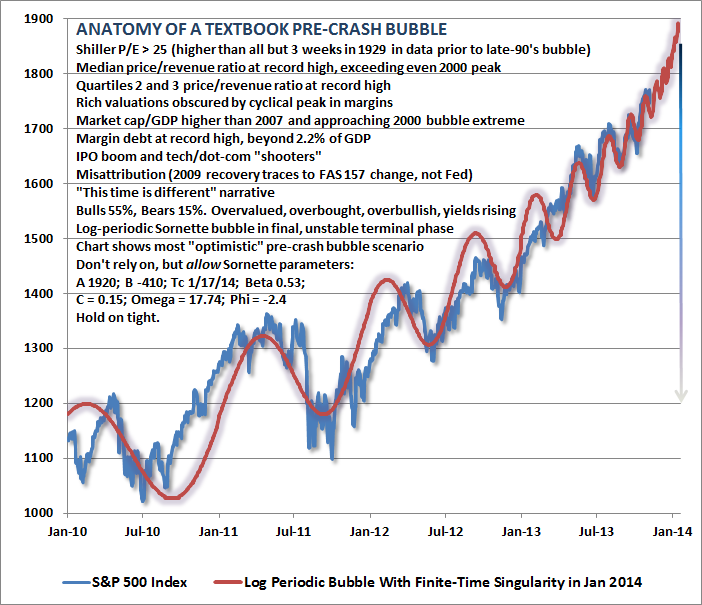
Investors who believe that history has lessons to teach should take our present concerns with significant weight, but should also recognize that tendencies that repeatedly prove reliable over complete market cycles are sometimes defied over portions of those cycles. Meanwhile, investors who are convinced that this time is different can ignore what follows. The primary reason not to listen to a word of it is that similar concerns, particularly since late-2011, have been followed by yet further market gains. If one places full weight on this recent period, and no weight on history, it follows that stocks can only advance forever.

What seems different this time, enough to revive the conclusion that “this time is different,” is faith in the Federal Reserve’s policy of quantitative easing. Though quantitative easing has no mechanistic relationship to stock prices except to make low-risk assets psychologically uncomfortable to hold, investors place far more certainty in the effectiveness of QE than can be demonstrated by either theory or evidence. The argument essentially reduces to a claim that QE makes stocks go up because “it just does.” We doubt that the perception that an easy Fed can hold stock prices up will be any more durable in the next couple of years than it was in the 2000-2002 decline or the 2007-2009 decline – both periods of persistent and aggressive Fed easing.  But QE is novel, and like the internet bubble, novelty feeds imagination. Most of what investors believe about QE is imaginative.
As Ray Dalio of Bridgwater recently observed, “The dilemma the Fed faces now is that the tools currently at its disposal are pretty much used up. We think the question around the effectiveness of QE (and not the tapering, which gets all the headlines) is the big deal. In other words, we’re not worried about whether the Fed is going to hit or release the gas pedal, we’re worried about whether there’s much gas left in the tank and what will happen if there isn’t.”
While we can make our case on the basis of fact, theory, data, history, and sometimes just basic arithmetic, what we can’t do – and haven’t done well – is to disabuse perceptions. Beliefs are what they are, and are only as malleable as the minds that hold them. Like the nearly religious belief in the technology bubble, the dot-com boom, the housing bubble, and countless other bubbles across history, people are going to believe what they believe here until reality catches up in the most unpleasant way. The resilience of the market late in a bubble is part of the reason investors keep holding and hoping all the way down. In this market cycle, as in all market cycles, few investors will be able to unload their holdings to the last of the greater fools just after the market’s peak. Instead, most investors will hold all the way down, because even the initial decline will provoke the question “how much lower could it go?” It has always been that way.
The problem with bubbles is that they force one to decide whether to look like an idiot before the peak, or an idiot after the peak. There’s no calling the top, and most of the signals that have been most historically useful for that purpose have been blaring red since late-2011.
As a result, the Shiller P/E (the S&P 500 divided by the 10-year average of inflation-adjusted earnings) is now above 25, a level that prior to the late-1990’s bubble was seen only in the three weeks prior to the 1929 peak. Meanwhile, the price/revenue ratio of the S&P 500 is now double its pre-bubble norm, as is the ratio of stock market capitalization to GDP. Indeed, the median price/revenue ratio of the S&P 500 is actually above the 2000 peak – largely because small cap stocks were much more reasonably priced in 2000 than they are today (not that those better relative valuations prevented wicked losses in small caps during the 2000-2002 decline).
Despite the unusually extended period of speculation as a result of faith in quantitative easing, I continue to believe that normal historical regularities will exert themselves with a vengeance over the completion of this market cycle. Importantly, the market has now re-established the most hostile overvalued, overbought, overbullish syndrome we identify. Outside of 2013, we’ve observed this syndrome at only 6 other points in history: August 1929 (followed by the 85% market decline of the Great Depression), November 1972 (followed by a market plunge in excess of 50%), August 1987 (followed by a market crash in excess of 30%), March 2000 (followed by a market plunge in excess of 50%), May 2007 (followed by a market plunge in excess of 50%), and January 2011 (followed by a market decline limited to just under 20% as a result of central bank intervention).
These concerns are easily ignored since we also observed them at lower levels this year, both in February (see A Reluctant Bear’s Guide to the Universe) and in May. Still, the fact is that this syndrome of overvalued, overbought, overbullish, rising-yield conditions has emerged near the most significant market peaks – and preceded the most severe market declines – in history:
1. S&P 500 Index overvalued, with the Shiller P/E (S&P 500 divided by the 10-year average of inflation-adjusted earnings) greater than 18. The present multiple is actually 25.
2. S&P 500 Index overbought, with the index more than 7% above its 52-week smoothing, at least 50% above its 4-year low, and within 3% of its upper Bollinger bands (2 standard deviations above the 20-period moving average) at daily, weekly, and monthly resolutions. Presently, the S&P 500 is either at or slightly through each of those bands.
3. Investor sentiment overbullish (Investors Intelligence), with the 2-week average of advisory bulls greater than 52% and bearishness below 28%. The most recent weekly figures were 55.2% vs. 15.6%. The sentiment figures we use for 1929 are imputed using the extent and volatility of prior market movements, which explains a significant amount of variation in investor sentiment over time.
4. Yields rising, with the 10-year Treasury yield higher than 6 months earlier.
The blue bars in the chart below depict the complete set of instances since 1970 when these conditions have been observed.
Our investment approach remains to align our investment outlook with the prospective market return/risk profile that we estimate on the basis of prevailing conditions at each point in time. On that basis, the outlook is hard-defensive, and any other stance is essentially speculative. Such speculation is fine with insignificant risk-limited positions (such as call options), but I strongly believe that investors with a horizon of less than 5-7 years should limit their exposure to equities. At this horizon, even “buy-and-hold” strategies in stocks are inappropriate except for a small fraction of assets. In general, the appropriate rule for setting investment exposure for passive investors is to align the duration of the asset portfolio with the duration of expected liabilities. At a 2% dividend yield on the S&P 500, equities are effectively instruments with 50-year duration. That means that even stock holdings amounting to 10% of assets exhaust a 5-year duration. For most investors, a material exposure to equities requires a very long investment horizon and a wholly passive view about market prospects.
Again, our approach is to align our outlook with the prospective return/risk profile we estimate at each point in time. That places us in a defensive stance. Still, we’re quite aware of the tendency for investors to capitulate to seemingly relentless speculation at the very peak of bull markets, and saw it happen in 2000 and 2007 despite our arguments for caution.
As something of an inoculation against this tendency, the chart below presents what we estimate as the most “optimistic” pre-crash scenario for stocks. Though I don’t believe that markets follow math, it’s striking how closely market action in recent years has followed a “log-periodic bubble” as described by Didier Sornette (see Increasingly Immediate Impulses to Buy the Dip).
A log periodic pattern is essentially one where troughs occur at increasingly frequent and increasingly shallow intervals. As Sornette has demonstrated across numerous bubbles over history in a broad variety of asset classes, adjacent troughs (say T1, T2, T3, etc) are often related to the crash date (the “finite-time singularity” Tc) by a constant ratio: (Tc-T1)/(Tc-T2) = (Tc-T2)/(Tc-T3) and so forth, with the result that successive troughs come closer and closer in time until the final blowoff occurs.
Frankly, I thought that this pattern was nearly exhausted in April or May of this year. But here we are. What’s important here is that the only way to extend that finite-time singularity is for the advance to become even more vertical and for periodic fluctuations to become even more closely spaced. That’s exactly what has happened, and the fidelity to the log-periodic pattern is almost creepy. At this point, the only way to extend the singularity beyond the present date is to envision a nearly vertical pre-crash blowoff.
So let’s do that. Not because we should expect it, and surely not because we should rely on it, but because we should guard against it by envisioning the most “optimistic” (and equivalently, the worst case) scenario. So with the essential caveat that we should neither expect, rely or be shocked by a further blowoff, the following chart depicts the market action that would be consistent with a Sornette bubble with the latest “finite time singularity” that is consistent with market action since 2010.
To be very clear: conditions already allow a finite-time singularity at present, the scenario depicted above is the most extreme case, it should not be expected or relied on, but we should also not be shocked or dismayed if it occurs.
Just a final note, which may or may not prove relevant in the weeks ahead: in August 2008, just before the market collapsed (see Nervous Bunny), I noted that increasing volatility of the market at 10-minute intervals was one of the more ominous features of market action. This sort of accelerating volatility at micro-intervals is closely related to log-periodicity, and occurs in a variety of contexts where there’s a “phase transition” from one state to another. Spin a quarter on the table and watch it closely. You’ll notice that between the point where it spins smoothly and the point it falls flat, it will start vibrating uncontrollably at increasingly rapid frequency. That’s a phase transition. Again, I don’t really believe that markets follow math to any great degree, but there are enough historical examples of log-periodic behavior and phase-transitions in market action that it helps to recognize these regularities when they emerge.
Risk dominates. Hold tight.

Dow Closes At Another Record High


John Mauldin Asks the Questions That MUST Be Asked!

Three cheers for John Mauldin. He's asking the questions that Congress should be asking! I love this man!

The Fed's Dilemma
Conveniently, Ray Dalio and his team at Bridgewater penned an essay this week highlighting the Fed's dilemma. I offer a few key paragraphs and a chart or two as a setup to my list of questions. Turning right to their very prescient comments:
In the old days central banks moved interest rates to run monetary policy. By watching the flows, we could see how lowering interest rates stimulated the economy by 1) reducing debt service burdens which improved cash flows and spending, 2) making it easier to buy items marked on credit because the monthly payments declined, which raised demand (initially for interest rate sensitive items like durable goods and housing) and 3) producing a positive wealth effect because the lower interest rate would raise the present value of most investment assets (and we saw how raising interest rates has had the opposite effect).
All that changed when interest rates hit 0%; "printing money" (QE) replaced interest-rate changes. Because central banks can only buy financial assets, quantitative easing drove up the prices of financial assets and did not have as broad of an effect on the economy. The Fed's ability to stimulate the economy became increasingly reliant on those who experience the increased wealth trickling it down to spending and incomes, which happened in decreasing degrees (for logical reasons, given who owned the assets and their decreasing marginal propensities to consume). As shown in the charts below, the marginal effects of wealth increases on economic activity have been declining significantly. The Fed's dilemma is that its policy is creating a financial market bubble that is large relative to the pickup in the economy that it is producing. If it were targeting asset prices, it would tighten monetary policy to curtail the emerging bubble, whereas if it were targeting economic conditions, it would have a slight easing bias. In other words, 1) the Fed is faced with a difficult choice, and 2) it is losing its effectiveness."
(In the following charts HH stands for "Household.")

We expect this limit to worsen. As the Fed pushes asset prices higher and prospective asset returns lower, and cash yields can't decline, the spread between the prospective returns of risky assets and those of safe assets (i.e. risk premia) will shrink at the same time as the riskiness of risky assets will not decline, changing the reward-to-risk ratio in a way that will make it more difficult to push asset prices higher and create a wealth effect. Said differently, at higher prices and lower expected returns the compensation for taking risk will be too small to get investors to bid prices up and drive prospective returns down further. If that were to happen, it would become difficult for the Fed to produce much more of a wealth effect. If that were the case at the same time as the trickling down of the wealth effect to spending continues to diminish, which seems likely, the Fed's power to affect the economy would be greatly reduced.
What Would Yellen Do?
With that as a setup, let's turn to our hypothetical hearing. (Insert a picture of your favorite senator here.) With the hope that we will get a glimpse of what a Janet Yellen chairmanship of the Fed will actually look like, let's think about what we would like to know:
Vice-Chairman Yellen, thank you for agreeing to attend this hearing. We have already interviewed you extensively for your present position, so I believe that most members of the committee and Senate already believe that you are qualified to be chairperson. Therefore I would like to use this opportunity to learn a little more about the thinking that goes on with regard to Federal Reserve monetary policy. In the spirit of the transparency that has been a hallmark of the Bernanke Federal Reserve, I would like you to shed a little light on the thinking and philosophy that will guide the Federal Reserve under the chairmanship of Janet Yellen. Here are a few questions that I believe we would all like answers to.

  1. There were three papers delivered by highly regarded economists at Jackson Hole this summer that suggested that quantitative easing had no significant effect and that "forward guidance" was the actual effective policy. At about that time, economists from the regional reserve bank at which you were president (San Francisco) also published a paper suggesting the same thing. This past week major Federal Reserve staff economists, as well as other economists, reiterated this view and proposed a different set of policies. This growing discussion begs the following question: Do you agree with these papers and believe the quantitative easing has exceeded its usefulness, especially in its current rather massive form? If not, can you point us to research that supports your view, other than theoretical analysis?
  1. The Federal Reserve balance sheet is currently at $4 trillion. At the current pace it is expanding by roughly $1 trillion per year.
  1. Is there a theoretical limit in your mind as to the size to which the Fed's balance sheet should be allowed to grow? If so, what is that amount? Simply saying that this number would be dependent upon future economic data would imply that you have no true idea of the limit and are making up the rules as you go along. Perhaps we are indeed in unexplored territory for monetary policy and it is appropriate to adjust policies based upon unfolding economic events; but if that is the case, what are the guidelines you would use?
  2. Given the time lag required to realize the impact of monetary policy upon the economy, at what point and by what standard might you determine that the balance sheet of the Federal Reserve had reached its limit and that any further stimulus must be the responsibility of the Congress and the executive branch?
  3. Is there a discussion within the Federal Reserve that balance-sheet expansion has the potential to produce an asset bubble?
  1. There seems to be an emerging consensus that it would be inappropriate for the Federal Reserve to pursue quantitative easing indefinitely at the levels we see today. There must be an endpoint, but the question of course is, when? Last May, Chairman Bernanke suggested that the Fed might begin to taper in the coming months. Market reactions worldwide were decidedly negative, and many members of the FOMC and Board of Governors were at great pains in the following weeks to suggest that tapering would be either very gradual or postponed altogether. Even so, the markets seemed to assume that a small reduction in the amount of quantitative easing would be announced at the September FOMC meeting. There was quite a lot of surprise when there was no tapering at all. The decision not to taper brings up several questions:
  1. What data was the Federal Reserve looking at that caused it to back away from even a small reduction in the amount of quantitative easing?
  2. Given that the balance sheet of the Federal Reserve is $4 trillion, what was the thought behind not reducing the ongoing increase of the balance sheet by a mere $10 billion a month?
  3. All things considered, $10 billion would seem a rather negligible amount. Were you concerned that the economy might not be able to handle even such a small reduction in quantitative easing?
  1. Recent papers from Federal Reserve economists and others suggest that QE (i.e., the large-scale purchase of assets) is not as effective as forward guidance and that the FOMC should indicate that interest rates will be held at very accommodative levels as far out as 2017, in contrast to the current guidance that suggests rates will be allowed to rise gradually beginning in late 2014, or more likely in 2015.
  1. What do you think of this view?
  2. If you agree with this, are you concerned that such a policy shift might encourage a dollar "carry trade"? By that I mean that banks and other financial institutions might be encouraged to borrow in dollars to invest in all manners of financial engineering projects, especially overseas, given that the cost of borrowing would be so cheap. This is different from traditional banking in that it would not foster lending for productive domestic purposes such as the expansion of plants or the purchase of productivity-enhancing equipment.
  3. Given the problems we have seen with carry-trade currencies, especially the Japanese yen, how far out do you think forward guidance should go?
  4. Again, viewing the experience of Japan, carry-trade currencies seem to strengthen unduly, apart from natural trade and investment flows. Further, given the extraordinary developments in energy production in the United States and the reduction in the trade deficit, it is quite possible the dollar could strengthen rather dramatically on its own. Do you agree that positioning the dollar as a potential carry-trade currency would strengthen the dollar? Is that a good thing in your view?
  5. Given that the strength of the dollar is at least nominally (policy-wise) in the purview of the US Treasury Department, what kind of coordination with the Treasury do you think would be appropriate in extending forward guidance for a very-low-rate regime into 2017?
  1. Chairman Bernanke and others have clearly hoped there would be a wealth effect from current monetary policy. By wealth effect I mean that if asset prices rise, people are encouraged to spend money, and the positive effects trickle down to the lower echelons of the economy.
  1. There has been a significant amount of research which suggests that the wealth effect is no longer operative in the United States. Do you agree with this?
  2. If you do believe in the wealth effect, where is the research, beyond theoretical models, that supports your view?
  3. If you do not agree that current monetary policy is in effect a trickle-down monetary policy, then what do you believe is the transfer mechanism from quantitative easing to the general public?
  1. Chairman Ben Bernanke has explicitly taken credit for the rise in the stock market from his policies of quantitative easing. Do you think he's right? In pursuing QE, has the Federal Reserve taken upon itself an implicit third mandate, that is, to support the level of the stock market? Should that be the Fed's responsibility?
  1. When the Federal Reserve begins to taper, or even suggests it will begin to taper, it appears that the markets will react negatively; yet reactions from Federal Reserve Board of Governors members seem to suggest that the Fed is extraordinarily concerned about a negative market reaction and subsequent negative effects on the economy. UBS strategist Beat Siegenthaler wrote this last week:
The Fed seems to be facing two major risks: first, premature tapering disrupting markets and triggering global turmoil across asset classes, thereby threatening the fragile economy recovery; second, delayed tapering further fueling asset price bubbles, which could burst eventually and do major damage.
The September decision suggested a Fed more worried about the fragile recovery than about the potential for asset bubbles and other longer term problems associated with extended liquidity injections. Whereas it had originally assumed that a gradual tapering would result in a gradual market reaction, it now appears that the situation is much more binary. If so, the hurdles for tapering might be substantially higher than originally thought.
  1. Do you agree with that assessment, and if not, why?
  2. The Bank of England published the following chart in Q3 2011. It tells the story of their expectation that while QE was in operation there would be a massive rise in real asset prices, but that this would dissipate and unwind over time, starting at the point at which the asset purchases were complete. It also suggests that they felt it possible that real asset prices would fall after the withdrawal of quantitative easing. Did the Federal Reserve hold internal discussions (such as those evidently held at the Bank of England) regarding what would happen with the withdrawal of QE? Given the recent market response to the suggestion of tapering, was the possibility of a fall in asset prices accounted for in your decision to pursue quantitative easing?

  1. Has the Federal Reserve has, in reality, created a form of "monetary trap" for itself through its extensive use of quantitative easing? That is, do you see a way in which the Federal Reserve can exit QE without having a negative effect on the stock market, at least initially? And should the Federal Reserve care?
  1. The current philosophy of the Federal Reserve seems to be that monetary easing is stimulative of consumer spending and therefore of the economy in general. This improvement is apparently supposed to be transmitted through lower interest rates for housing and for leveraged borrowing that facilitates consumer spending (on autos and other durable goods) as well as lower interest rates for businesses, which hopefully encourage spending on plants and facilities to increase productivity and boost employment.

    However, lower interest rates also mean that investors and pensioners get less income, so they must reduce their spending. I assume it is not the policy or the suggestion of the Federal Reserve that retired individuals should increase the level of risk they take on in the deployment of their retirement savings; but if the Fed seeks to increase the assets of those who hold equity in the stock market, an unintended consequence may be to penalize savers at the very moment in their lives when they need higher interest rates to be able to maintain their lifestyles.
  1. Explain to us the economic rationale behind artificially lowering rates for an extended period of time, which penalizes savers at the expense of equity holders.
  2. Do you believe that consumer spending fostered by quantitative easing is greater than the consumer spending lost by decreased returns to savers and investors on their fixed-income investments? Is there any data that suggests this is turning out to be the case?
  3. If there is a greater good for the economy at large in pursuing massive QE, can you show us the research that proves it and explain why retirees should be content with your policies?
  4. Do you have suggestions for those who have saved all their lives and are now being forced to either reduce their standard of living or dip into their savings?
  1. If reserve injections by the Federal Reserve were evenly distributed throughout the economy, then the money multiplier would be higher and more stable. This has not happened, as evidenced by the graph below. Further, the availability of loans to middle-level banks and businesses does not seem to have risen. How has QE helped these banks and firms?

  1. The Federal Reserve has a dual mandate to achieve the stability of the purchasing value of money and to foster an environment that affords full employment. If the money multiplier is inordinately low and if it should begin to revert to what was its norm prior to the Great Recession, there would seem to be a serious potential for the return of higher-than-acceptable inflation.
  1. As chairperson of the Federal Reserve, which of the two mandates would you consider to be a higher priority in a time of rising inflation?
  2. Are you prepared, as Chairman Volcker was in the early '80s, to raise interest rates in order to protect the value of money, in spite of the harm it caused to employment? As a follow-on, I would also like to know what, if anything, you would have done differently from Chairman Volcker.
  1. Federal Reserve economic forecasts have proven notoriously inaccurate, historically speaking. Indeed, some have suggested that random models would have produced better results than those upon which the Fed relies.
  1. How can we trust your models and your policy projections when the Fed’s forecasts have been so wrong for so many years? Why does the Fed persist, to this day, in the use of models that have been so consistently bad at predicting the future?
  2. Will you be basing your monetary policy on projections generated by existing, clearly faulty models, or do you anticipate a change in the construction of your models?
  1. Finally, let us turn to the employment mandate.
  1. Can you explain to us precisely how monetary policy is supposed to work to improve employment? What is the transfer mechanism from quantitative easing to higher employment?
  2. If you were designing a central bank system from scratch, would you include an employment mandate? Where do you think the primary responsibility for establishing an environment for full employment should rest, with the federal government or the Federal Reserve?
The Questions That Will Not Be Asked
The above questions will start the discussion, but I'm well aware that some of the questions I would really like to ask will have no chance to make it into the dialogue. These go to the very concept of a central bank. In my latest book, Code Red, I fully acknowledge the need for a central bank, but my view of its purpose is quite a bit more limited than is envisioned in the current manifestation. How can 12 men and women sit on a committee and think they can fine-tune the economy without creating imbalances and unintended consequences? Central banks should be for emergencies and for regulating banking institutions and making sure the playing field is level. They should not be responsible for the fate of the players on the field.
Current central bank policy has rewarded bankers and holders of assets. In an environment where everyone seems to be increasingly worried about the divide between the 1% and the 99%, our central bank has designed and implemented a policy that is explicitly rewarding the 1% to the detriment of savers and retirees. It is the rich who have assets and the poor who have liabilities. If you are looking for a reason why the spread between the rich and the poor is widening, one driver (and I admit there are others) is the central bank policies of the developed world.
Let me end by sharing the sentiments expressed by Ben Hunt this week after he had read the numerous academic papers that have recently been released. I totally share this sentiment, and he expresses it well:
I started writing this email as a detailed analysis of three monetary policy papers recently published by various Fed functionaries, papers that give a peek into how the Fed thinks about their role in the world and that have received some significant attention this week by our media arbiters of taste in articles such as "Fed Forward Guidance Proves Effective, NY Fed Research Says" and "Fed Study: Rate Peg Off Mark." Interpreting the meaning and impact of papers like this (and the media narrative around them) is a bread and butter topic for Epsilon Theory posts, as I feel a duty to read and report on these papers so you don't have to. It's not a pleasant duty.
Frankly, these papers frustrate me to tears, as they are written as post hoc "scientific" justifications of value-laden social assumptions and policy conclusions, not as an honest search for a truth that's larger than the local bureaucratic imperative. They're also … boring. As is the long analysis I wrote. So let's skip all that and go straight to the conclusion.
Spoiler Alert! The Fed believes that they are saving the world, and that any problems that persist in the world can be eliminated by doing more of what they've been doing and doing it for longer. I know this comes as a complete surprise to anyone who's been paying the least amount of attention over the past few years, but there you have it. That's what these papers say.
These papers say nothing that is terribly novel or interesting in terms of their content or intended purpose. The only interesting thing is how much media attention they are receiving and what that means. The triumphal procession of these papers is a reminder that the academic and bureaucratic capture of the Fed is complete, and that leads to what are (to me, anyway) much more interesting questions than the inside baseball topics of what these papers might imply for Yellen's policy preferences:
1) Has the academic and bureaucratic capture of US monetary policy been duplicated in other policy areas, such as national security and healthcare?
2) Is there a common academic and bureaucratic response across these policy areas to the economic and political duress of the past 10 years, such that emergency policy actions against immediate threats have been transformed into permanent insurance programs against future and potential threats?
3) Is this the common thread woven through the three most important and controversial policies of our day: QE, Obamacare, and NSA eavesdropping?
4) Are there useful lessons to be drawn from the last time we went through such a wholesale redefinition of the *meaning* of government policy, back in the 1930s?
5) What are the structural consequences for markets and investing that stem from this redefinition?
My answers: yes, yes, yes, yes, and I'm trying to figure it out.