Showing posts with label GDP. Show all posts

Wednesday, September 2, 2020

Stocks Soar 450 Points Even As US Debt Exceeds GDP

 It's hard to believe that this is news that would lead stocks to rally to a fresh new all-time record high, but it has. The Wall St Journal today has an article with the below headline:

The Wall St Journal says that, "U.S. government debt is on track to exceed the size of the economy for the 12 months ended Sept. 30, a milestone not hit since World War II." The US is taking on a staggering amount of debt this year, and the total is more than the entire amount of GDP for the year! This is a calamity in the making!

Friday, May 29, 2020

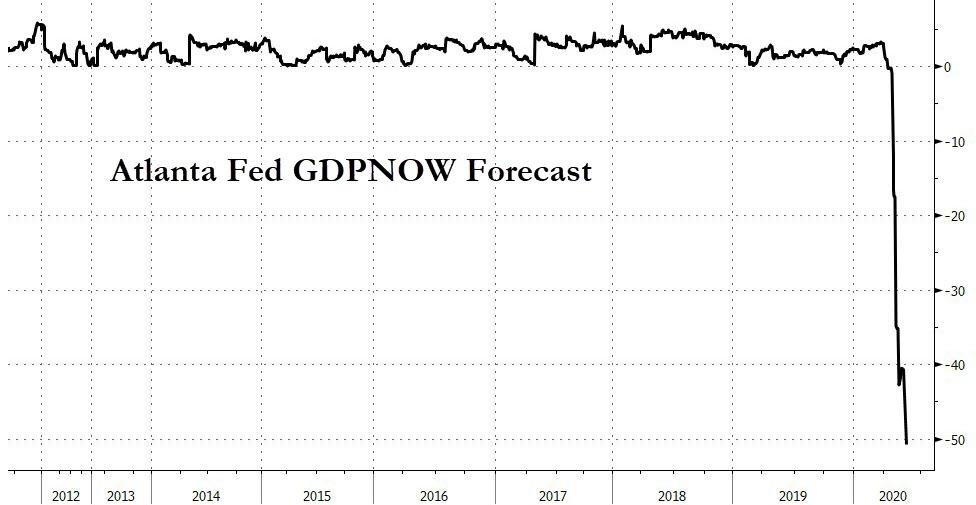
Fed Figures Staggering Drop In GDP

"...the Atlanta Fed's closely followed GDPNow tracker confirmed this worst case scenario, when the latest model estimate for real GDP growth in the second quarter of 2020 crashed to -51.2% on May 29, down from -40.4% on May 28, which would be the biggest drop on record."

Thursday, May 28, 2020

Saturday, July 30, 2016

US GDP Growth -- Just Half of What Was Forecaast!

Deutsche Bank's Dominic Konstam summarized GDP data yesterday:

The latest GDP release favors our hypothesis of an imminent endogenous labor market slowdown over a more optimistic scenario in which productivity will replace employment as the engine for growth. With real GDP growing at just 1.2%, there is little evidence that productivity is ready to do the heavy lifting. We are particularly concerned because annual nominal growth has slowed to 2.4%, essentially a cyclical trough.

Deutsche Bank calculates, on an annual basis, the non-consumer portion of the economy is shrinking, i.e., in a recession, not only in real terms but also in nominal terms.

Business spending is in recession. Equipment spending fell -3.5% in the quarter and is down nearly -2% over the last year. At the same time, spending on structures was down -7.9% in the quarter and -7.0% over the last four quarters. The only pocket of strength within the nonresidential fixed investment sector was intellectual property products; this category, which includes software, R&D, and entertainment, literary and artistic originals, advanced a modest 3.5% in the quarter, and at a similar rate over the last year. While some of the weakness in investment spending has been due to the collapse in oil prices, non-energy-related spending has been soft, too, reflecting weak internal and external demand, excess slack and corporate uncertainty regarding the outcome of this year’s Presidential Election. While investment spending may get a slight boost over the next couple of quarters as the energy investment drag abates, we expect corporate outlays to remain stagnant until next year.

Housing stumbles. Residential investment declined -6.1% last quarter following a 7.8% in the previous quarter. Since the sector bottomed in Q3 2010, it has grown at an annualized rate of 8.6%. Elevated housing affordability coupled with low vacancy rates tells us that residential investment should rebound this quarter and next.

We should expect a sharp pullback in spending this quarter. Indeed, the recent softness in motor vehicles sales, which are one of our five favorite economic indicators, may be hinting as much. We can see in the chart below that the toppyness in vehicle sales does not bode well for the underlying trend in consumer spending. Besides, as we have written on numerous occasions, gains in consumer spending alone are not enough to prevent a broader economic downturn. There have been numerous economic cycles when year-over-year consumer spending was positive but the economy still entered a downturn. Witness what happened during the 1981 to 1982 and 2001 recessions.

 And, monetary policy has effectively exhausted itself, so there is little that policymakers can do to offset any further slowing in demand. With respect to the second half, we continue to project sub-2% growth, a view that we have held for some time.

Tuesday, March 22, 2016

Delusional Markets

And this is what bubbles are made of!

Wednesday, December 9, 2015

Wholesale Inventories Weaken GDP Forecast

But stocks are up sharply regardless!


Thursday, February 14, 2013

Sagging GDP Slams Euro

The Euro is down nearly 1% this morning, which is a large move for the currency markets.


After trending gently higher for the first half of the week, the euro has been sold to new three week lows in response to the disappointing Q4 GDP figures. The GDP figures are of course backward looking and more recent data, such as the PMI figures and German factory orders suggest the regional economy is stabilizing here in early Q1.
There is a middle step to go from the GDP figures to the euro and that is the interest rate channel.  There has been some speculation that the passive tightening of the euro area financial conditions (including the shrinking of the ECB's balance sheet) and the strength of the euro would prompt the ECB to cut the refi rate later in Q1.  The poor GDP readings bolster such expectations and this can be seen in short-term interest rates.  The March Euribor futures contract is now implying 0.24% rate, having matched the lowest rate since Jan 23, or before the early repayment of LTRO I was announced.

Another way to see this is in the US-German 2-year interest rate differential, which continues to track the euro-dollar exchange rate.    Recall the sequence of events.  In early Dec 12, the US was offering about 32 bp more than Germany on 2-year obligations. By late January, the US was at a  2 bp discount.  However, this month it has been trending back toward the US and today, at 8 bp, the US premium is the largest since mid-Jan.  
The euro's drop today indicates the downside correction to the euro began earlier this month is not complete.  A break of $1.3310 signals a potentially quick move toward $1.3270.    Sterling's slide has been extended and it briefly dipped below $1.55 for the first time since August.  The unwinding of long euro-sterling positions is helping sterling steady against the greenback.
The day of disappointment actually began in Asia, where Japan reported a 0.1% contraction in Q4 GDP.  The consensus had called for a small increase.  It is the third consecutive quarterly contraction.  Exports, which fell for seven months through Dec was an obvious drag and business investment was also a drag.  The BOJ concluded its two day meeting, leaving policy unchanged.  It assessment was tweaked higher as it recognized that the "economy appears to have stopped weakening".   The yen is largely sidelined today as the dollar continues to consoldiate within Monday's range.
Fro the first time in more than a week, a Japanese official cited specific dollar-yen rates.  Iwata, who is thought to be vying for the BOJ governor position, suggested the JPY95 area was appropriate.  He opined that a correction of the yen's strength is vital to achieving the 2% inflation target and was sympathetic to changing the BOJ charter.  He has also been an advocate of foreign bond purchases.  While his comments may play well in Japan, they probably are not helpful in securing international standing, which was also a criteria cited by senior government officials. 
Some press reports are playing up comments by the Riksbank governor yesterday that seemed to accept the krona's strength and suggesting Sweden entering the "currency war" on the other side.  This seems to be an exaggeration. First, this is essentially what Weidmann and Draghi have said about the euro.  It is near long-term averages.  That means that the current rate is acceptable.  Second, about 7 months ago when the euro was at $1.20, the US did not complain about the dollar's strength. 
In fact, outside of one Fed official expressing some misgivings about what Japanese officials were saying about the yen, and Treasury Secretary designate Lew endorses of a strong dollar policy, the US has been as usual quiet about the exchange rate.   Easing monetary policy when one's inflation is low and the output gap is large is not a shot in currency war.
The euro zone area GDP contacted by 0.6% in Q4.  The market expected a 0.4% contraction.   Most countries, including Germany, France and Italy's contractions were more than expected.  Canada looks to be fastest growing in the G7 at the end of last year.  A combination of construction spending, retail sales, trade figures and the latest inventory data suggest that the contraction in Q4 US GDP may be revised to show a small uptick.  The revision is due Feb 28.

Wednesday, October 24, 2012

Calculation for GDP

GDP = C + I + G + Net Exports, or GDP is equal to Consumption (Consumer and Business) + Investment + Government Spending + Net Exports (Exports – Imports). This is true for all times and countries.

Wednesday, March 7, 2012

Data Divergence

John Hussman has been predicting precisely this kind of data divergence in anticipation of the next stock market correction. 

Morgan Stanley's David Greenlaw addresses this in a recent note to clients:

There has been an unusual divergence in the data flow in the US. Last week, our tracking estimate of Q1 GDP slipped all the way from +2.2% to +1.0% in response to disappointing reports on durable goods, construction spending and personal consumption. At the same time, jobless claims continued to improve, consumer sentiment showed a decent pickup, chain store reports were positive, and motor vehicle sales surprised to the upside. The sharp divergence between the GDP arithmetic and better-than-expected performance from a range of indicators is unusual, but not unheard of. Most importantly, the economy's underlying growth trend still seems to be in the neighborhood +2.0% – consistent with both the +3.0% outcome seen in Q4 and a +1.0% tracking estimate for Q1.
Other economists who have had to make some big revisions to their GDP estimates include Goldman's Jan Hatzius who last week revised his Q1 GDP estimate from 2.4 percent to 2.3 percent, then again to 2.0 percentBank of America also recently cut its estimate from 2.2 percent to 1.8 percent.

Wednesday, December 21, 2011

National Association of Liars

I wonder if they'll revise GDP lower accordingly. I doubt it!

Tuesday, November 22, 2011

Lovely Headlines, Bond Market Take Infusion From Spain

S&P 500 now down 13 points!

Friday, August 26, 2011

GDP Weakness Edges U.S. Closer to Recession

Europe is literally right on the edge of recession, with GDP barely in the positive, and a likely next-month revision that will push them over the edge.

Here from Zero Hedge on US GDP:
The first revision to Q1 GDP printed at 1.0%, down from the preliminary Q2 GDP print of 1.3%, and as expected was worse than Wall Street consensus of -1.1%, although it was certainly not as bad as the miss to the preliminary number.

Stocks have dipped into the red as a result, but only moderately.

Next up: Ben Bernanke's Jackson Hole speech in just over an hour.

Tuesday, August 16, 2011

ES Dips 17 Point on Disappointing Eurozone Data

from Zero Hedge:
Economic growth is faltering in all major economies with data this morning showing Eurozone and German GDP growth slowing. Eurozone GDP rose 0.2% from the first quarter, when it increased 0.8% while German GDP growth fell by more than expected in the second quarter, dropping to a derisory 0.1%. Double dip recessions involving inflation and therefore stagflation seem increasingly likely.The conditions today are far more bullish than in the 1970’s as in the 1970’s the U.S. was the largest creditor nation in the world whereas today the U.S. is the largest debtor nation the world has ever seen. Gold went parabolic in the 1970’s after a period of stagflation. Today, we appear to be on the verge of a period of stagflation.

Sunday, July 31, 2011

John Mauldin: GDP Trend Growth Down -- An Economy at Stall Speed

There is no way to spin the GDP report that came out this morning as anything but very bad. It was just last May that the consensus was that second-quarter GDP would be 3.3%. That had been revised down to 2.7%, but the number came in at 1.3%. Normally, at this time in a recovery we are growing at close to 3 times that number, or 3.6%. (You can read the press release and see the data I write about at http://www.bea.gov/newsreleases/national/gdp/gdpnewsrelease.htm.)
Even worse, the first-quarter number was revised down from 1.9% to an anemic 0.36%. For new readers, note that the first estimate of a quarter’s growth is just that, an estimate. There are three monthly revisions that follow, and after a few years it is revised yet again with the aid of hindsight. And the 4th quarter of 2010 was taken down from 3.1% to 2.35%!
If you are looking for something (anything) that can explain the new number, then you could attribute a small portion to the effects from the Japan earthquake and tsunami, as “durable goods” from motor vehicles and parts reduced GDP by about .2%.
And it gets worse. It seems that BEA went back and revised the numbers for the recession. Would it surprise you to learn that the recession was worse than we thought at the time? The peak-to-trough decline was 5.1% instead of 4.1%. That means that in real terms the economy has not yet recovered back to the pre-recession levels. David Rosenberg notes that in his research “going back to 1947 and never before have we seen this dynamic of the level of overall economic activity lower on the second birthday of the recovery than it was at the prior cycle peak. Typically two years into a recovery, real GDP is already 9.5% above the pre-recession high.”
Look at this chart from the St. Louis Fed. It is real Gross Domestic Product going back five years. This is just ugly. More on this later, as I made this point with the Senators (I wish I’d had this data when I was there!)

Now, notice the direction of the revisions. Care to wager the over/under on where the revisions will go when the second quarter is revised? Dare we say it could go negative? Say it ain’t so, Joe!
I don’t have time to cover it this week, but global growth is slowing. China’s PMI came in at 48.9 in July. Korean exports are slowing.
Joan McCullough notes:
“Working from Q309, forward, read GDP as follows:
“1.7, 3.8, 3.9, 3.8, 2.5, 2.3 … now here it comes: 0.4 … and then today’s 1.3%.
“I won’t keep you in suspense any more. Here’s my take: MOMENTUM IS BROKEN. A big, ol’ monkey wrench, courtesy of input arising from the change in inventory and Imports. And once momentum stumbles, then H2 growth becomes a wild card, right?”

Is There a Recession in Our Future?

I mentioned a chart from Rich Yamarone, Chief Economist at Bloomberg (who I’m having dinner with next Tuesday in NYC). I previously wrote:
“And the last chart is one I had not seen before, and is interesting. Rich notes that if year-over-year GDP growth dips below 2%, a recession always follows. It is now at 2.3%.”
Growth is clearly decelerating. Look at the growth numbers from the St. Louis Fed website for the last six quarters:
2009-10-01 13019.012
2010-01-01 13138.832
2010-04-01 13194.862
2010-07-01 13278.515
2010-10-01 13380.651
2011-01-01 13444.301
It will be very interesting to see, at the end of the month, what the numbers are for the second quarter. Another quarter like the first quarter and we should either be close to or actually dip below 2%.

Oops. Today David Rosenberg updated that chart. This from Rosie:

If Rich is right, then the next revisions will be down. And the growth in the second half is not going to be all that good for jobs and consumer spending.
And this from Rosie as well:


The economy is at stall speed, it is quite possible we’ll see further downward revisions to the already anemic growth numbers, and Congress and the President are dithering over the debt ceiling. It will not take much to push us into an outright recession. We can go a few days, I think, with the latter problem, but not too long or the markets will throw up.
I should note that the Congressmen and Senators I met with were a very wired-in bunch. Many of them are in the leadership. And they had no clue as to how the debt-ceiling snafu would play out. Lots of speculation, but no real idea. And they were worried.
But enough on the GDP. Suffice it to say that the stock market drops about 40% on average in a recession. Just sayin’.

What I Told the Senators

It started when a friend gave Senator Dan Coats a copy of Endgame. He read it and underlined, highlighted, and scored it. The Senator Rob Portman took it off his hands and read it. They asked me to come to DC and meet a few Senators. You don’t say no to such a request, but the only free day I had was Monday. I met with nine of them for about 90 minutes and Senator Cornyn (from Texas) privately beforehand for an hour. I offered him a copy of the book, but he said he was already reading it on the iPad he was carrying. I gave him one anyway. ;-)
I met with several chiefs of staff before the meeting, and they decided I should not use the typical PowerPoint approach but just talk, and gave me advice on how to go about it. Evidently, Coats and Portman had worked the room, because nine guys showed up more or less on time. Two Democrats, six Republicans, and an independent (Lieberman). Jon Kyl was there, as well as Gang of Six member, Tom Coburn from Oklahoma. Also Corker, Lugar, Coats, Portman, and Mike Lee, the “Tea Party” senator from Utah, who took the most notes. But there were a lot of them taking notes. And asking questions, some rather pointed. Overall, I was very impressed with the level of knowledge in the room and the candor.
I started by explaining what I meant by the debt supercycle and how deleveraging recessions are fundamentally different from business-cycle recessions, which is why we are not seeing a normal recovery. And it is happening all over the developed world. I think I surprised them by jumping to Europe first, noting that Europe appeared to be imploding even as we were meeting. I made the point that we could see a banking and credit crisis coming from Europe that might be worse than the subprime crisis. I noted that it was not just Greece, Ireland, and Portugal. Spain and Italy have their own share of problems, and the markets have taken their interest rates up by 1% in just the last month, just as a large rollover of debt is coming due.
We’d better stay with this Europe thing for a few minutes. A few weeks back, I talked about Italy and said I thought their debt was longer-duration, and so they might not go critical quite so fast. I got this note from London partner Niels Jensen, pointing out to me how wrong I was:
“Wrong! Italy average debt duration is in fact quite short, as illustrated in the chart below. Within Europe, only the UK has really long average debt duration (about 13 years). Most countries are averaging 5-7 years. Italy is no exception. Best, Niels.”

Then today I get this note from Bluemont Capital Advisors, written by Harald Malmgren, Global Economic Strategist, and Mark Stys, Chief Investment Officer. It is short but important, so I am going to quote it in full. Thanks, guys.

Escalating Eurozone Interbank Liquidity Crisis: Dollar-Euro Impact?

“Italian and Spanish interbank lending is freezing up. French Finance Ministry officials and banks have been in emergency meetings this week regarding Eurozone interbank market stress. IMF and EU officials are warning that France might also face downgrade if greater spending cuts are not made. Finance Ministry staff have been warned to be available 24/7 (irrespective of sacred August holidays!) as contagion may soon affect French banks and sovereign debt.
“In spite of last week’s Eurozone Summit agreement on Greece and EFSF ‘flexibility’, Italian and Spanish sovereign debt yields have resumed escalation this week. Moreover, the Italians had to cancel issuance of longer maturity debt as demand was insufficient. German Finance Minister Schauble damaged confidence Wednesday when he said the EFSF would not have a blank check to purchase Eurozone sovereign debt in the secondary market.
“Eurozone banks’ primary holding of capital is in the form of Eurozone sovereign debt. It is obvious that the EFSF is not large enough to handle crises on the scale of Italian and Spanish
sovereign debt. Schauble’s statement is interpreted as indicating precarious support within the
German parliament for the recent Summit package for Greece and the EFSF, and that an increase
in EFSF is unlikely. (Schauble is personally powerful within the CDU, so his statements most
likely carry more political weight than Merkel’s at present.)
“Meanwhile, US money market funds have been withdrawing from Eurozone bank commercial paper, leaving Eurozone banks with a big gap in availability of short-term funding and a severe shortage of dollars.
“In the background, the Fed has quietly advised the ECB and some other central banks that Congress has warned the Fed not to repeat the huge liquidity support to Europe and Asia that it provided in 2008. European officials believe the Fed would be less able to come to the rescue again with increased swap lines and direct loans to Eurozone banks, as it did post-Lehman.
“Thus, in parallel with the US debt ceiling uncertainties, the Eurozone appears to be entering into renewed crisis of breakdown in interbank trust and escalating borrowing costs for Italy and Spain, and maybe even France. Whatever happens with the US debt ceiling, attention will soon turn back to Eurozone sovereign debt problems and threats to the viability of Eurozone banks from debt contagion.
“It is increasingly possible that the ECB may not be able to function as lender of last resort on the scale required to cope with an interbank lending breakdown. It is also thus likely that the Eurozone will suffer a shortage of dollars for its interbank credit markets. Demand for dollars will likely escalate, while confidence in Eurozone financial institutions falls. This could force Eurozone banks to purchase dollars in the open market and drive the dollar higher.”
I made some similar points to the Senators about why the euro is going to parity – if it survives. Then I went into my “Japan is a bug in search of a windshield” spiel, pointing out that the yen will fall in half.
All this to say is that the bond markets are going to get spooked sooner than we are prepared for. If the US does not show up with a credible deficit-reduction program by the end of 2013, we could see interest rates rising even in the face of a deflationary recession. If we do nothing, we become Greece.
And the $4 trillion they are talking about? That is a down payment. We need $10-12 trillion in cuts over ten years, which I explained would put us into a slow-growth-at-best, Muddle Through economy with high unemployment and tough tax policies. I pointedly showed Senator Mike Lee why we could not cut spending too fast (as the Tea Party wants) – unless we want Depression 2.0 and 20% unemployment. It has to be my “glide-path” option. As I said, Lee was taking notes fast and furious. And asking the right questions. I like him. Lieberman was also engaged (I really do like him), and they were all very candid about the political problems they were facing. And it was a very sober group as we ended the meeting. But they all politely thanked me for coming and talking frankly. Even the Dems (I confess I think I know the name of one, but the website picture does not look like him, so I don’t want to get it wrong. But he was impressive with his questions as well.)
I could go on, but long-time readers know by now my Endgame scenario. I got a lot of promises that the Senators would read my book. Coats and Portman got extra copies to give out on the floor.
I have to tell you, gentle reader, that leaving that meeting I was very sober as well. They made it clear that getting it done is going to be very hard, and it will take real commitment from men and women like them to get us through this. They all noted that their mail was running 100 to 1 against cutting Medicare. Every one of them. They know that they cannot close the deficit gap just with the elimination of the Bush tax cuts. And I think I convinced any who weren’t already, that not getting the deficit under control means Depression 2.0 and a disaster.
The debate in 2012-13 will be, how much Medicare do we want and how do we want to pay for it? Sadly, I think the only way is with a VAT (value-added tax), since less than 50% of citizens pay any income taxes now. Want to run on a program of taxing the “middle class?” Didn’t think so. Want to run on a platform of cutting Medicare? That is not a winner either. We are at an impasse.
We need a massive restructuring of our entire tax code to be more encouraging of creating jobs. But that is another story for another week. It is time to hit the send button.

Friday, July 29, 2011

Economy Sours!


The U.S. economy grew less than expected in the second quarter as consumer spending barely rose, and growth braked sharply in the prior quarter, a government report showed on Friday.

Growth in gross domestic product—a measure of all goods and services produced within U.S. borders—rose at a 1.3 percent annual rate, the Commerce Department said.
First-quarter output was sharply revised down to a 0.4 percent pace from 1.9 percent.
Economists had expected the economy to expand at a 1.8 percent rate in the second quarter.

Sunday, May 29, 2011

GDP Fraud

John Mauldin quoted this in his newsletter:

Gaming the GDP Numbers
I know I should quit, but this one quick note, as this just really annoys me. I get the methodology and rationalization of how GDP is calculated, but it does have the appearance of being “gamed.” This from my friends at Consumer Metrics. Link to the full report after.
“The importance of the price deflater used by the BEA cannot be overstated. In calculating the "real" GDP the BEA continued to use an overall 1.9% annualized inflation rate, which is substantially lower than the inflation rates being reported by any of the BEA's sister agencies. The mathematical implications of the deflater are simple: a lower deflater creates a higher ‘real’ GDP reading. If April's CPI-U (as reported by the Bureau of Labor Statistics) of 3.2% year-over-year inflation is used as the deflater, the reported 1.84% annualized growth rate shrinks to a 0.56% annualized rate, and the ‘real final sales of domestic products’ is actually contracting at a 0.63% rate. If instead of the year-over-year CPI-U we were to use the annualized CPI-U from just the first quarter (5.7%), the ‘real’ GDP would be shrinking at a 1.82% annualized rate, and the ‘real final sales of domestic products’ would be contracting at a recession-like 3.01%.” ( http://www.consumerindexes.com/)

Thursday, May 26, 2011

Correlated: GDP and Job Losses

GDP Revised Lower, Jobless Claims Rise, Stock Futures Go Red

GDP was revised lower to 1.8% on expectations of 2.2%, and new unemployment claims rose to 424,000, with a rising moving average. Both bad! But Pollyanna was partying all night long!

Tuesday, May 17, 2011

Double Bump Lower

The morning’s lousy economic data have nudged a couple of obscure but noteworthy needles on the dashboard just a little bit lower.
First, the fed-funds futures market, where two guys trade bets back and forth on what the Fed’s policy rate will be next year, has cut the chances of a May 2012 rate hike to less than 50%, from a sure thing earlier this year, Howard Packowitz reports. The market is starting to whittle away at the odds of a July rate hike, too, down to 82% from 100% as recently as Friday. Note, however, that this illiquid market is volatile.
Second, Macroeconomic Advisers have trimmed their forecast for second-quarter GDP to 3.2%, down from 3.3%. I’m a little surprised they didn’t cut their outlook more than that, but they’ve got the model, so there you have it. The forecast keeps nudging ever closer to that 3-handle on GDP that many people see as the dividing line between trend and below-trend growth.

Tuesday, May 10, 2011

Two Alternative and More Meaningful Measurements of GDP

by Rob Arnott of Agora Financial:


Gross Domestic Product is used to measure a country’s economic growth and standard of living. It measures neither. Unfortunately, the finance community and global centers of power are wedded to a measure that bears little relation to reality, because it confuses prosperity with debt-fueled spending.
Washington is paralyzed by fears that any withdrawal of stimulus, whether fiscal or monetary, whether by the Administration, the Fed, or the Congress, may clobber our GDP. And they’re right. But, GDP is the wrong measure.
Without an alternative, we will continue to make bad policy choices based on bad data. Eventually, our current choices may wreak havoc with our future prosperity, the future purchasing power of the dollar, and the real value of U.S. stocks and bonds.

What is GDP?

GDP is consumer spending, plus government outlays, plus gross investments, plus exports minus imports. With the exception of exports, GDP measures spending. The problem is GDP makes no distinction between debt-financed spending and spending that we can cover out of current income.
Consumption is not prosperity. The credit-addicted family measures its success by how much it is able to spend, applauding any new source of credit, regardless of the family income or ability to repay. The credit-addicted family enjoys a rising “family GDP”—consumption—as long as they can find new lenders, and suffers a family “recession” when they prudently cut up their credit cards.
In much the same way, the current definition of GDP causes us to ignore the fact that we are mortgaging our future to feed current consumption. Worse, like the credit-addicted family, we can consciously game our GDP and GDP growth rates—our consumption and consumption growth—at any levels our creditors will permit!
Consider a simple thought experiment. Let’s suppose the government wants to dazzle us with 5% growth next quarter (equivalent to 20% annualized growth!). If they borrow an additional 5% of GDP in new additional debt and spend it immediately, this magnificent GDP growth is achieved! We would all see it as phony growth, sabotaging our national balance sheet—right? Maybe not. We are already borrowing and spending 2% to 3% each quarter, equivalent to 10% to 12% of GDP, and yet few observers have decried this as artificial GDP growth because we’re not accustomed to looking at the underlying GDP before deficit spending!
From this perspective, real GDP seems unreal, at best. GDP that stems from new debt—mainly deficit spending—is phony: it is debt-financed consumption, not prosperity. Isn’t GDP, after excluding net new debt obligations, a more relevant measure? Deficit spending is supposed to trigger growth in the remainder of the economy, net of deficit-financed spending, which we can call our “Structural GDP.” If Structural GDP fails to grow as a consequence of our deficits, then deficit spending has failed in its sole and singular purpose.1
Of course, even Structural GDP offers a misleading picture. Our Structural GDP has grown nearly 100-fold in the last 70 years. Most of that growth is due to inflation and population growth; a truer measure of the prosperity of the average citizen must adjust for these effects. Accordingly, let’s compare real per capita GDP with real per capita Structural GDP.

A New Measure of Prosperity

Real per capita GDP has recovered to within 2.5% of the 2007 peak of $48,000 (in 2010 dollars). So, why do we feel so bad? For one thing, after two recessions, we’re up barely 6% in a decade. Furthermore, this scant growth is entirely debt-financed consumption. The real per capita Structural GDP, after subtracting the growth in public debt, remains 10% below the 2007 peak, and is down 5% in the past decade. Net of deficit spending, our prosperity is nearly unchanged from 1998, 13 years ago.
As a diagnostic for why this has happened, let’s go one step further. Few would argue that a healthy economy can grow without the private sector leading the way. The real per capita “Private Sector GDP” is another powerful measure that is easy to calculate. It nets out government spending—federal, state, and local. Very like our Structural GDP, Private Sector GDP is bottom-bouncing, 11% below the 2007 peak, 6% below the 2000–2003 plateau, and has reverted to roughly match 1998 levels.
Figure 1 illustrates the situation. Absent debt-financed consumption, we have gone nowhere since the late 1990s.
Figure 1. Real GDP, Structural GDP, and Private Sector GDP, Per Capita, 1944-2011

Source: Research Affiliates
As the private sector has crumbled, and Structural GDP has lost 13 years of growth, tax receipts have collapsed. Real per capita federal tax receipts have tumbled to levels first achieved in 1994, and are fully 25% below the peak levels of 2000.2 The 2000 peak in tax receipts was, of course, bolstered by unprecedented capital gains tax receipts following the wonder years of the 1990s. But this surge in tax receipts fueled a perception—even in a Republican-dominated government!—that there was money to burn, as if the capital gains from the biggest bull market in U.S. stock market history would continue indefinitely!
What does this mean for the citizens and investors in the world’s largest economy? If we continue to focus on GDP, while ignoring (and even facilitating) the decay of our Structural GDP and our Private Sector GDP, we’ll continue to borrow and spend, mortgaging our nation’s future. The worst case result could include the collapse of the purchasing power of the dollar, the demise of the dollar as the world’s reserve currency, the dismantling of the middle class, and a flight of global capital away from dollar-based stocks and bonds.
None of these consequences is likely imminent. But, few would claim today that they are impossible. Most or all of these consequences can likely still be avoided. But, not if we hew to the current path, dominated by sheer terror at the thought of a drop in top-line GDP.
After World War II, the U.S. Government “downsized” from 43.6% of GDP to 11.6% in 1948 (under a Democrat!). Did this trigger a recession? Measured by GDP, you bet! From 1945 to 1950, the nation convulsed in two short sharp recessions as the private sector figured out what to do with all the talent released from government employment, and real per capita GDP flat-lined. But, underneath the pain of two recessions, a spectacular energizing of the private sector was underway. From the peak of government expenditure in 1944 until 1952, the per capita real Structural GDP, the GDP that was not merely debt-financed consumption, soared by 87%; the Private Sector GDP, in per capita real terms, jumped by more than 90%.
Was the recent 0.5% drop in GDP in the United Kingdom a sign of weakness, or was this drop merely the elimination of 0.5% of debt-financed GDP that never truly existed? Spending dropped by over 1% of GDP; Structural GDP was finally improving!
We must pay attention to the health—or lack of same—for our Structural GDP and our Private Sector GDP before they lose further ground.

Conclusion

Government outlays were not reined in by either political party for most of the past decade. Real per capita government outlays now stand some 50% above the levels of just 10 years ago, even with Structural GDP and Private Sector GDP down over the same span. Federal spending is more than 40% of the Private Sector GDP for the first time since World War II.
Even our calculation of the national debt burden (debt/GDP) needs rethinking. Is the family that overextends correct in measuring their debt burden relative to their income plus any new debt that they have accumulated in the past year? Isn’t it more meaningful to compute debt relative to Structural GDP, net of new borrowing?! Our National Debt, poised to cross 100% of GDP this fall, is set to reach 112% of Structural GDP at that same time, even without considering off-balance-sheet debt.3 Will Rogers put it best: “When you find yourself in a hole, stop digging.”
While many cite John Maynard Keynes as favoring government spending during a recession, he never intended to create structural deficits. He recommended that government should serve as a shock absorber for economic ups and downs. He prescribed surpluses in the best of times, with the proceeds serving to fund deficits in the bad times, supplemented by temporary borrowings if necessary. And he loathed inflation and currency debasement, which he correctly viewed as the scourge of the middle class.
GDP provides a misleading picture and a false sense of security. Instead of revealing an economy that we all viscerally know is weaker than a decade ago, it suggests an economy that is within hailing distance of a new peak in prosperity for the average American. Top-line GDP has recovered handily from its lows, on the back of record debt-financed consumption. But, our Structural GDP and Private Sector GDP are both floundering. Focusing on top-line GDP tempts us all to rely on ever more debt-financed consumption, until our lenders say “no más.”
The cardiac patient on the gurney has had his shot of adrenaline and is feeling better, but he is still gravely ill—more so than before his latest heart attack—as these two simple GDP measures amply demonstrate.

Endnotes

1. A “correct” measure would subtract all new debt that is backed only by future income, lacking collateral. Very little private debt lacks collateral, and very little public debt is backed by anything other than future income. So, for simplicity’s sake in this article, we subtract only net new government debt.
2. Despite no change in tax rates since 2003, this situation is often blamed on the perfidy of the affluent, not the evaporation of capital gains, hence capital gains taxes. We should recognize that the enemy is not success, it is poverty. But, when we rue the latter, we too often blame the former.
3. See the November 2009 issue of Fundamentals, entitled “The ‘3-D’ Hurricane Force Headwind,” for more details on the daunting levels of off-balance-sheet debt. Our debt/GDP ratio may be poised to cross 100% of GDP this fall, but our GAAP accounting debt burden is already well past 400% of GDP and well past 500% of Structural GDP.