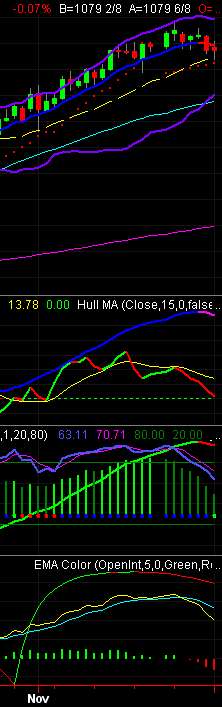
Soybeans closed at a new lower daily close today (Dec 3 2007), but just barely. More significantly, perhaps, is that prices spent the entire day below the previous day's close, only rising to nearly reach Friday's closing price just in the closing minutes of today's trading session. Not only that, but soybean prices also reached a new low price (for the day) that was lower than the past few days. Prices haven't been this low since Nov. 20th. Note also that prices are getting quite close to a crossover of the Bollinger Moving Average (a 20-period Simple Moving Average).
Note in the 2nd subgraph that selling activity continues, as soybeans are being distributed. This Klinger+ATR indicator is a wonderful leading indicator for when big money is selling, even before prices themselves reverse.
I included the other subgraphs in this picture because I wanted to show that the Hull Moving Average (2nd subgraph, blue and magenta) has turned negative.
In the third subgraph, note that the Bollinger Squeeze indicator has turned from bright green to dark green, indicating a loss of volatility and momentum. Likewise, the Gaussian indicator (green and red in the same 3rd subgraph) has also turned down.
In the bottom subgraph, the MACD has also turned down! This is all in the daily chart. This is rather strong signaling of more bearish soybean activity to follow.
However:
The weekly chart is still bullish, although the Bollinger Squeeze indicator has just turned from bright green to dark green. I have not posted the weekly chart.
skip to main |
skip to sidebar


Portfolio Manager, Head Strategist
About Me

- S Benard
- United States
- I am a student of economics, financial analyst, and futures trader, specializing in agricultural commodities, and especially grains, but I also trade gold and other metals, soft commodities, treasuries, and stock index futures. I began trading spot Forex currency crosses in May 2003, and in August 2006, I met a futures trader who has been making a living in futures for more than 20 years, and he became my futures mentor. I've never looked back, and I am now head trader for Global Capital Reserves, my own firm. I also have both Bachelors and Master of Science degrees in business. I really enjoy trading futures, and hope to share my successes, a few failures, and methodologies.
My Other Blogs:
Blog Archive
-
►
2022
(1)
- ► 08/07 - 08/14 (1)
-
►
2021
(4)
- ► 05/02 - 05/09 (2)
- ► 04/18 - 04/25 (2)
-
►
2020
(52)
- ► 09/13 - 09/20 (1)
- ► 08/30 - 09/06 (3)
- ► 08/23 - 08/30 (2)
- ► 08/16 - 08/23 (8)
- ► 08/02 - 08/09 (1)
- ► 07/26 - 08/02 (1)
- ► 07/12 - 07/19 (3)
- ► 06/28 - 07/05 (2)
- ► 06/21 - 06/28 (2)
- ► 06/14 - 06/21 (3)
- ► 06/07 - 06/14 (2)
- ► 05/31 - 06/07 (3)
- ► 05/24 - 05/31 (3)
- ► 05/17 - 05/24 (2)
- ► 05/10 - 05/17 (3)
- ► 05/03 - 05/10 (3)
- ► 04/26 - 05/03 (1)
- ► 04/19 - 04/26 (1)
- ► 04/12 - 04/19 (1)
- ► 04/05 - 04/12 (2)
- ► 03/29 - 04/05 (1)
- ► 03/15 - 03/22 (1)
- ► 01/12 - 01/19 (3)
-
►
2019
(48)
- ► 11/17 - 11/24 (1)
- ► 10/06 - 10/13 (1)
- ► 09/29 - 10/06 (1)
- ► 08/25 - 09/01 (1)
- ► 08/18 - 08/25 (1)
- ► 08/11 - 08/18 (3)
- ► 08/04 - 08/11 (2)
- ► 07/21 - 07/28 (1)
- ► 07/14 - 07/21 (1)
- ► 07/07 - 07/14 (3)
- ► 06/30 - 07/07 (3)
- ► 06/23 - 06/30 (8)
- ► 06/16 - 06/23 (5)
- ► 06/09 - 06/16 (3)
- ► 06/02 - 06/09 (4)
- ► 05/26 - 06/02 (5)
- ► 05/19 - 05/26 (3)
- ► 04/14 - 04/21 (1)
- ► 04/07 - 04/14 (1)
-
►
2018
(22)
- ► 12/16 - 12/23 (1)
- ► 10/07 - 10/14 (2)
- ► 08/19 - 08/26 (1)
- ► 07/22 - 07/29 (1)
- ► 07/08 - 07/15 (1)
- ► 07/01 - 07/08 (1)
- ► 06/24 - 07/01 (3)
- ► 06/17 - 06/24 (1)
- ► 06/03 - 06/10 (4)
- ► 05/27 - 06/03 (2)
- ► 05/06 - 05/13 (2)
- ► 04/08 - 04/15 (1)
- ► 03/25 - 04/01 (1)
- ► 01/07 - 01/14 (1)
-
►
2017
(22)
- ► 12/31 - 01/07 (1)
- ► 12/17 - 12/24 (2)
- ► 11/12 - 11/19 (1)
- ► 10/15 - 10/22 (1)
- ► 10/01 - 10/08 (2)
- ► 09/24 - 10/01 (1)
- ► 09/10 - 09/17 (1)
- ► 09/03 - 09/10 (2)
- ► 08/27 - 09/03 (2)
- ► 08/13 - 08/20 (2)
- ► 08/06 - 08/13 (1)
- ► 07/30 - 08/06 (1)
- ► 06/18 - 06/25 (1)
- ► 06/11 - 06/18 (1)
- ► 06/04 - 06/11 (2)
- ► 05/14 - 05/21 (1)
-
►
2016
(55)
- ► 10/09 - 10/16 (1)
- ► 09/04 - 09/11 (2)
- ► 08/21 - 08/28 (1)
- ► 08/14 - 08/21 (2)
- ► 07/31 - 08/07 (1)
- ► 07/24 - 07/31 (1)
- ► 07/10 - 07/17 (2)
- ► 06/12 - 06/19 (1)
- ► 06/05 - 06/12 (4)
- ► 05/29 - 06/05 (1)
- ► 05/22 - 05/29 (3)
- ► 05/15 - 05/22 (5)
- ► 05/08 - 05/15 (2)
- ► 04/24 - 05/01 (1)
- ► 04/17 - 04/24 (2)
- ► 04/03 - 04/10 (4)
- ► 03/27 - 04/03 (1)
- ► 03/20 - 03/27 (2)
- ► 03/13 - 03/20 (2)
- ► 02/28 - 03/06 (3)
- ► 02/14 - 02/21 (2)
- ► 02/07 - 02/14 (3)
- ► 01/24 - 01/31 (7)
- ► 01/10 - 01/17 (2)
-
►
2015
(94)
- ► 12/06 - 12/13 (2)
- ► 11/29 - 12/06 (4)
- ► 11/22 - 11/29 (3)
- ► 11/15 - 11/22 (4)
- ► 11/08 - 11/15 (1)
- ► 11/01 - 11/08 (5)
- ► 10/25 - 11/01 (2)
- ► 10/11 - 10/18 (1)
- ► 09/13 - 09/20 (2)
- ► 08/23 - 08/30 (4)
- ► 08/16 - 08/23 (3)
- ► 08/09 - 08/16 (1)
- ► 08/02 - 08/09 (2)
- ► 07/05 - 07/12 (1)
- ► 06/28 - 07/05 (1)
- ► 06/21 - 06/28 (1)
- ► 06/14 - 06/21 (1)
- ► 06/07 - 06/14 (1)
- ► 05/31 - 06/07 (1)
- ► 05/24 - 05/31 (3)
- ► 05/17 - 05/24 (5)
- ► 05/03 - 05/10 (2)
- ► 04/19 - 04/26 (3)
- ► 04/12 - 04/19 (5)
- ► 04/05 - 04/12 (4)
- ► 03/29 - 04/05 (10)
- ► 03/22 - 03/29 (3)
- ► 03/15 - 03/22 (3)
- ► 03/08 - 03/15 (1)
- ► 02/22 - 03/01 (2)
- ► 02/15 - 02/22 (2)
- ► 02/08 - 02/15 (2)
- ► 02/01 - 02/08 (5)
- ► 01/25 - 02/01 (1)
- ► 01/18 - 01/25 (1)
- ► 01/11 - 01/18 (1)
- ► 01/04 - 01/11 (1)
-
►
2014
(139)
- ► 12/07 - 12/14 (1)
- ► 11/30 - 12/07 (4)
- ► 11/16 - 11/23 (1)
- ► 11/09 - 11/16 (2)
- ► 10/05 - 10/12 (1)
- ► 09/28 - 10/05 (1)
- ► 09/21 - 09/28 (1)
- ► 09/14 - 09/21 (1)
- ► 09/07 - 09/14 (4)
- ► 08/31 - 09/07 (3)
- ► 08/24 - 08/31 (1)
- ► 08/10 - 08/17 (4)
- ► 08/03 - 08/10 (3)
- ► 07/27 - 08/03 (3)
- ► 07/20 - 07/27 (2)
- ► 07/13 - 07/20 (2)
- ► 07/06 - 07/13 (3)
- ► 06/22 - 06/29 (2)
- ► 06/08 - 06/15 (1)
- ► 06/01 - 06/08 (1)
- ► 04/27 - 05/04 (4)
- ► 04/20 - 04/27 (1)
- ► 04/13 - 04/20 (3)
- ► 04/06 - 04/13 (1)
- ► 03/30 - 04/06 (3)
- ► 03/23 - 03/30 (1)
- ► 03/16 - 03/23 (4)
- ► 03/09 - 03/16 (2)
- ► 03/02 - 03/09 (2)
- ► 02/23 - 03/02 (6)
- ► 02/16 - 02/23 (7)
- ► 02/09 - 02/16 (10)
- ► 02/02 - 02/09 (13)
- ► 01/26 - 02/02 (6)
- ► 01/19 - 01/26 (2)
- ► 01/12 - 01/19 (14)
- ► 01/05 - 01/12 (19)
-
►
2013
(448)
- ► 12/29 - 01/05 (15)
- ► 12/22 - 12/29 (12)
- ► 12/15 - 12/22 (12)
- ► 12/08 - 12/15 (8)
- ► 12/01 - 12/08 (16)
- ► 11/24 - 12/01 (10)
- ► 11/17 - 11/24 (14)
- ► 11/10 - 11/17 (11)
- ► 11/03 - 11/10 (13)
- ► 10/27 - 11/03 (7)
- ► 10/20 - 10/27 (3)
- ► 10/13 - 10/20 (2)
- ► 10/06 - 10/13 (14)
- ► 09/29 - 10/06 (9)
- ► 09/22 - 09/29 (4)
- ► 09/15 - 09/22 (8)
- ► 09/08 - 09/15 (2)
- ► 08/25 - 09/01 (1)
- ► 08/18 - 08/25 (7)
- ► 08/11 - 08/18 (2)
- ► 08/04 - 08/11 (1)
- ► 07/28 - 08/04 (1)
- ► 07/21 - 07/28 (3)
- ► 07/14 - 07/21 (2)
- ► 07/07 - 07/14 (5)
- ► 06/30 - 07/07 (9)
- ► 06/23 - 06/30 (11)
- ► 06/16 - 06/23 (14)
- ► 06/09 - 06/16 (6)
- ► 06/02 - 06/09 (14)
- ► 05/26 - 06/02 (4)
- ► 05/19 - 05/26 (3)
- ► 05/12 - 05/19 (14)
- ► 05/05 - 05/12 (2)
- ► 04/28 - 05/05 (5)
- ► 04/14 - 04/21 (8)
- ► 04/07 - 04/14 (1)
- ► 03/31 - 04/07 (10)
- ► 03/24 - 03/31 (9)
- ► 03/17 - 03/24 (14)
- ► 03/10 - 03/17 (4)
- ► 03/03 - 03/10 (14)
- ► 02/24 - 03/03 (16)
- ► 02/17 - 02/24 (24)
- ► 02/10 - 02/17 (16)
- ► 02/03 - 02/10 (24)
- ► 01/27 - 02/03 (11)
- ► 01/20 - 01/27 (14)
- ► 01/13 - 01/20 (10)
- ► 01/06 - 01/13 (9)
-
►
2012
(346)
- ► 12/30 - 01/06 (4)
- ► 12/23 - 12/30 (14)
- ► 12/16 - 12/23 (8)
- ► 12/09 - 12/16 (11)
- ► 12/02 - 12/09 (11)
- ► 11/25 - 12/02 (20)
- ► 11/18 - 11/25 (23)
- ► 11/11 - 11/18 (14)
- ► 11/04 - 11/11 (12)
- ► 10/28 - 11/04 (15)
- ► 10/21 - 10/28 (14)
- ► 10/14 - 10/21 (13)
- ► 10/07 - 10/14 (4)
- ► 09/30 - 10/07 (17)
- ► 09/23 - 09/30 (4)
- ► 09/16 - 09/23 (3)
- ► 09/09 - 09/16 (9)
- ► 09/02 - 09/09 (13)
- ► 08/26 - 09/02 (4)
- ► 08/19 - 08/26 (7)
- ► 08/12 - 08/19 (1)
- ► 08/05 - 08/12 (5)
- ► 07/29 - 08/05 (4)
- ► 07/22 - 07/29 (4)
- ► 07/15 - 07/22 (2)
- ► 07/08 - 07/15 (7)
- ► 07/01 - 07/08 (7)
- ► 06/24 - 07/01 (3)
- ► 06/17 - 06/24 (5)
- ► 06/10 - 06/17 (6)
- ► 06/03 - 06/10 (5)
- ► 05/27 - 06/03 (6)
- ► 05/20 - 05/27 (2)
- ► 05/06 - 05/13 (5)
- ► 04/29 - 05/06 (11)
- ► 04/22 - 04/29 (6)
- ► 04/15 - 04/22 (2)
- ► 04/08 - 04/15 (1)
- ► 04/01 - 04/08 (4)
- ► 03/25 - 04/01 (1)
- ► 03/11 - 03/18 (1)
- ► 03/04 - 03/11 (4)
- ► 01/29 - 02/05 (4)
- ► 01/22 - 01/29 (6)
- ► 01/15 - 01/22 (7)
- ► 01/08 - 01/15 (10)
- ► 01/01 - 01/08 (7)
-
►
2011
(1155)
- ► 12/25 - 01/01 (12)
- ► 12/18 - 12/25 (13)
- ► 12/11 - 12/18 (10)
- ► 12/04 - 12/11 (5)
- ► 11/27 - 12/04 (3)
- ► 11/20 - 11/27 (11)
- ► 11/13 - 11/20 (8)
- ► 11/06 - 11/13 (9)
- ► 10/30 - 11/06 (15)
- ► 10/23 - 10/30 (11)
- ► 10/16 - 10/23 (5)
- ► 10/09 - 10/16 (8)
- ► 10/02 - 10/09 (10)
- ► 09/25 - 10/02 (13)
- ► 09/18 - 09/25 (22)
- ► 09/11 - 09/18 (18)
- ► 09/04 - 09/11 (18)
- ► 08/28 - 09/04 (26)
- ► 08/21 - 08/28 (30)
- ► 08/14 - 08/21 (34)
- ► 08/07 - 08/14 (46)
- ► 07/31 - 08/07 (36)
- ► 07/24 - 07/31 (25)
- ► 07/17 - 07/24 (8)
- ► 07/10 - 07/17 (21)
- ► 07/03 - 07/10 (25)
- ► 06/26 - 07/03 (23)
- ► 06/19 - 06/26 (27)
- ► 06/12 - 06/19 (34)
- ► 06/05 - 06/12 (10)
- ► 05/29 - 06/05 (33)
- ► 05/22 - 05/29 (25)
- ► 05/15 - 05/22 (45)
- ► 05/08 - 05/15 (24)
- ► 05/01 - 05/08 (40)
- ► 04/24 - 05/01 (46)
- ► 04/17 - 04/24 (38)
- ► 04/10 - 04/17 (39)
- ► 04/03 - 04/10 (32)
- ► 03/27 - 04/03 (17)
- ► 03/20 - 03/27 (30)
- ► 03/13 - 03/20 (37)
- ► 03/06 - 03/13 (24)
- ► 02/27 - 03/06 (29)
- ► 02/20 - 02/27 (25)
- ► 02/13 - 02/20 (14)
- ► 02/06 - 02/13 (21)
- ► 01/30 - 02/06 (22)
- ► 01/23 - 01/30 (22)
- ► 01/16 - 01/23 (14)
- ► 01/09 - 01/16 (16)
- ► 01/02 - 01/09 (26)
-
►
2010
(1302)
- ► 12/26 - 01/02 (40)
- ► 12/19 - 12/26 (10)
- ► 12/12 - 12/19 (20)
- ► 12/05 - 12/12 (31)
- ► 11/28 - 12/05 (22)
- ► 11/21 - 11/28 (27)
- ► 11/14 - 11/21 (28)
- ► 11/07 - 11/14 (36)
- ► 10/31 - 11/07 (54)
- ► 10/24 - 10/31 (24)
- ► 10/17 - 10/24 (31)
- ► 10/10 - 10/17 (48)
- ► 10/03 - 10/10 (29)
- ► 09/26 - 10/03 (35)
- ► 09/19 - 09/26 (44)
- ► 09/12 - 09/19 (37)
- ► 09/05 - 09/12 (32)
- ► 08/29 - 09/05 (52)
- ► 08/22 - 08/29 (78)
- ► 08/15 - 08/22 (34)
- ► 08/08 - 08/15 (48)
- ► 08/01 - 08/08 (43)
- ► 07/25 - 08/01 (33)
- ► 07/18 - 07/25 (19)
- ► 07/11 - 07/18 (38)
- ► 07/04 - 07/11 (27)
- ► 06/27 - 07/04 (25)
- ► 06/20 - 06/27 (8)
- ► 06/13 - 06/20 (11)
- ► 06/06 - 06/13 (16)
- ► 05/30 - 06/06 (27)
- ► 05/23 - 05/30 (28)
- ► 05/16 - 05/23 (38)
- ► 05/09 - 05/16 (22)
- ► 05/02 - 05/09 (17)
- ► 04/25 - 05/02 (12)
- ► 04/18 - 04/25 (3)
- ► 04/11 - 04/18 (4)
- ► 04/04 - 04/11 (6)
- ► 03/28 - 04/04 (9)
- ► 03/21 - 03/28 (10)
- ► 03/14 - 03/21 (7)
- ► 03/07 - 03/14 (8)
- ► 02/28 - 03/07 (10)
- ► 02/21 - 02/28 (13)
- ► 02/14 - 02/21 (17)
- ► 02/07 - 02/14 (11)
- ► 01/31 - 02/07 (27)
- ► 01/24 - 01/31 (20)
- ► 01/17 - 01/24 (7)
- ► 01/10 - 01/17 (14)
- ► 01/03 - 01/10 (12)
-
►
2009
(1809)
- ► 12/27 - 01/03 (32)
- ► 12/20 - 12/27 (15)
- ► 12/13 - 12/20 (22)
- ► 12/06 - 12/13 (16)
- ► 11/29 - 12/06 (17)
- ► 11/22 - 11/29 (36)
- ► 11/15 - 11/22 (29)
- ► 11/08 - 11/15 (11)
- ► 11/01 - 11/08 (22)
- ► 10/25 - 11/01 (40)
- ► 10/18 - 10/25 (21)
- ► 10/11 - 10/18 (26)
- ► 10/04 - 10/11 (16)
- ► 09/27 - 10/04 (26)
- ► 09/20 - 09/27 (26)
- ► 09/13 - 09/20 (25)
- ► 09/06 - 09/13 (25)
- ► 08/30 - 09/06 (35)
- ► 08/23 - 08/30 (35)
- ► 08/16 - 08/23 (35)
- ► 08/09 - 08/16 (16)
- ► 08/02 - 08/09 (37)
- ► 07/26 - 08/02 (35)
- ► 07/19 - 07/26 (39)
- ► 07/12 - 07/19 (47)
- ► 07/05 - 07/12 (58)
- ► 06/28 - 07/05 (34)
- ► 06/21 - 06/28 (34)
- ► 06/14 - 06/21 (32)
- ► 06/07 - 06/14 (34)
- ► 05/31 - 06/07 (31)
- ► 05/24 - 05/31 (50)
- ► 05/17 - 05/24 (60)
- ► 05/10 - 05/17 (45)
- ► 05/03 - 05/10 (24)
- ► 04/26 - 05/03 (26)
- ► 04/19 - 04/26 (36)
- ► 04/12 - 04/19 (51)
- ► 04/05 - 04/12 (49)
- ► 03/29 - 04/05 (37)
- ► 03/22 - 03/29 (89)
- ► 03/15 - 03/22 (61)
- ► 03/08 - 03/15 (40)
- ► 03/01 - 03/08 (56)
- ► 02/22 - 03/01 (36)
- ► 02/15 - 02/22 (48)
- ► 02/08 - 02/15 (48)
- ► 02/01 - 02/08 (36)
- ► 01/25 - 02/01 (29)
- ► 01/18 - 01/25 (28)
- ► 01/11 - 01/18 (34)
- ► 01/04 - 01/11 (19)
-
►
2008
(1439)
- ► 12/28 - 01/04 (5)
- ► 12/21 - 12/28 (18)
- ► 12/14 - 12/21 (64)
- ► 12/07 - 12/14 (50)
- ► 11/30 - 12/07 (41)
- ► 11/23 - 11/30 (42)
- ► 11/16 - 11/23 (4)
- ► 09/14 - 09/21 (32)
- ► 09/07 - 09/14 (26)
- ► 08/31 - 09/07 (28)
- ► 08/24 - 08/31 (13)
- ► 08/17 - 08/24 (39)
- ► 08/10 - 08/17 (37)
- ► 08/03 - 08/10 (53)
- ► 07/27 - 08/03 (35)
- ► 07/20 - 07/27 (29)
- ► 07/13 - 07/20 (45)
- ► 07/06 - 07/13 (35)
- ► 06/29 - 07/06 (17)
- ► 06/22 - 06/29 (17)
- ► 06/15 - 06/22 (30)
- ► 06/08 - 06/15 (29)
- ► 06/01 - 06/08 (38)
- ► 05/25 - 06/01 (24)
- ► 05/18 - 05/25 (35)
- ► 05/11 - 05/18 (25)
- ► 05/04 - 05/11 (24)
- ► 04/27 - 05/04 (44)
- ► 04/20 - 04/27 (23)
- ► 04/13 - 04/20 (31)
- ► 04/06 - 04/13 (52)
- ► 03/30 - 04/06 (44)
- ► 03/23 - 03/30 (41)
- ► 03/16 - 03/23 (31)
- ► 03/09 - 03/16 (49)
- ► 03/02 - 03/09 (36)
- ► 02/24 - 03/02 (47)
- ► 02/17 - 02/24 (34)
- ► 02/10 - 02/17 (36)
- ► 02/03 - 02/10 (31)
- ► 01/27 - 02/03 (27)
- ► 01/20 - 01/27 (28)
- ► 01/13 - 01/20 (25)
- ► 01/06 - 01/13 (25)
-
▼
2007
(137)
- ► 12/30 - 01/06 (27)
- ► 12/23 - 12/30 (19)
- ► 12/16 - 12/23 (23)
- ► 12/09 - 12/16 (35)
-
▼
12/02 - 12/09
(24)
- Friday 12-7 Soybean Trade #1
- Friday 12-7 Soybean Trade #2
- Friday 12-7 Soybean Trade #3
- Friday 12-7 Soybean Trade #4
- Friday 12-7 Soybean Trade #5
- Thursday 12-6 Soybeans Trade
- Wednesday Trading
- Wednesday Soybeans Trade #1
- Wednesday Soybeans Trade #2
- Wednesday Soybeans Trade #3
- Wednesday Soybeans Trade #4 and #5
- Wednesday Soybeans Trade #6
- Wednesday Soybeans Trade #7
- Wednesday Soybeans Trade #8
- Agricultural real estate ETF
- Soybeans bullishness reasserts itself
- Foreign vs. domestic stock ETFs
- Trading - prices don't ONLY move up and down
- Quotes: Gold (the only real money) vs. fiat money
- Commodity prices supported by likely Fed rate cuts
- Lower daily close for soybeans
- Chart Triptych
- Indicator settings
- Indicators usage explanation
- ► 11/25 - 12/02 (9)
Recommended Book List
- Analyse Technique et Volatilite (english version here)- Philippe Cahen
- Analyse Technique et Volatilite - Philippe Cahen
- Bollinger on Bollinger Bands - John Bollinger
- Candlesticks Explained - Martin Pring
- Creature from Jekyll Island, The - G. Edward Griffin
- Creature from Jekyll Island, The - G. Edward Griffin
- Disciplined Trader, The: Developing Winning Attitudes - Mark Douglas
- Dynamic Technical Analysis - Philippe Cahen
- Enclyclopedia of Technical Market Indicators, The - Robert Colby
- High Probability Trading - Marcel Link
- Phantom's Gift
- Psychology of Risk, The - Ari Kiev
- The Ascent of Money - Niall Ferguson
- Trading in the Zone - Ari Kiev
- Trading in the Zone - Mark Douglas
- Trading to Win - Ari Kiev
Labels
- . (2)
- "The Buzz" (7)
- 200-day moving average (6)
- 30-year (1)
- accounting standards (3)
- Adam Smith (1)
- ADP (2)
- adults not in workforce (1)
- agriculture (41)
- agriculture ETFs (1)
- alternative exchanges (1)
- Argentina (1)
- Arlan Suderman (1)
- Art Simpson (1)
- asset overvaluation (2)
- atheism (1)
- attitude (1)
- auction rates (1)
- Aussie (10)
- Australia (1)
- Australian Dollar (10)
- Austrian School of Economics (2)
- auto sales (1)
- automated trading (1)
- B2B Index (1)
- backwardation (2)
- bad bank (3)
- bad trades (1)
- bailouts (45)
- baltic dry index (9)
- Bank of International Settlements (1)
- Bank of Japan (6)
- bank runs (1)
- bank stress test (4)
- banking crisis (20)
- banking industry (1)
- bankruptcies (2)
- Bart Chilton (1)
- bear market (4)
- Bear Stearns (2)
- bearish (2)
- behavioral finance (1)
- beige book (1)
- Bernanke (60)
- bias (1)
- bid ask spread (5)
- big business (1)
- Bill Fleckenstein (1)
- BIll Gross (2)
- Bill Hester (1)
- Bill Williams (1)
- Billion Prices Index (2)
- biofuels (5)
- black swan (4)
- blog (1)
- Bob Janjuah (1)
- BOJ (1)
- Bollinger (1)
- Bollinger Bands (28)
- Bollinger Moving Average (5)
- Bollinger Squeeze (14)
- bond bubble (5)
- bond market (14)
- bond vigilantes (22)
- bonds (44)
- bounds and conditions (1)
- Brazil (2)
- brazilian real (2)
- break-out (2)
- Brett Steenbarger (104)
- brief therapy (11)
- British Pound (10)
- brokerages (1)
- bubble (56)
- budget deficit (125)
- bull market (8)
- bullish (1)
- Bureau of Economic Analysis (1)
- Business Conditions Index (1)
- California (3)
- Canadian Dollar (10)
- candlestick pattern (4)
- Cap and Trade (26)
- capacity utilization (3)
- CAPE (1)
- capital expenditures (1)
- capital gains (1)
- capitalism (1)
- carry trade (2)
- Case Shiller (12)
- cash reserves (2)
- Caterpillar (1)
- CBO (3)
- central banking (14)
- CFTC (10)
- Chamber of Commerce (1)
- chaos theory (2)
- character (1)
- chart patterns (2)
- Chicago Mercantile Exchange (3)
- China (61)
- Chris Martenson (3)
- Christine Lagarde (1)
- civil unrest (1)
- clawback (1)
- close (1)
- closing high (1)
- Cloward -Piven (1)
- CME (10)
- coal (2)
- cocoa (15)
- coffee (7)
- coincident indicators (2)
- Colombia (1)
- commercial real estate (6)
- commodities (224)
- commodity indexes (36)
- communism (1)
- Community Reinvestment Act (1)
- competitiveness (1)
- Congress (1)
- consolidation (5)
- consumer confidence (61)
- consumer spending (2)
- contagion (2)
- contango (2)
- contract month (3)
- copper (17)
- corn (352)
- coronavirus (6)
- corporate bonds (3)
- corporate earnings (6)
- correction (2)
- correlation (1)
- COT (1)
- cotton (41)
- counter-party risk (2)
- Covid-19 (4)
- CPI (17)
- creative destruction (1)
- credit (3)
- credit crisis (42)
- credit default swaps (8)
- credit rating (10)
- crop report (5)
- crude oil (443)
- currencies (39)
- currency devaluation (1)
- currency reserves (4)
- currency war (7)
- daily charts (3)
- Dallas Fed Survey (4)
- David Rosenberg (11)
- David Stockman (4)
- David Walker (1)
- day trading (3)
- death cross (2)
- debt (125)
- debt ceiling (7)
- debt crisis (165)
- debt default (26)
- debt deflation (8)
- debt rating (10)
- debt to GDP (5)
- deficits (45)
- definition (1)
- deflation (26)
- democrat party (1)
- depression (21)
- derivatives (6)
- Deutsche Bank (2)
- Dimirtri Medvedev (2)
- discipline (6)
- distribution (2)
- divergence (6)
- dollar (60)
- Doug Kass (6)
- Dow (126)
- downtrend (4)
- drought (1)
- DTA (1)
- DTAFM (1)
- durable goods (19)
- dynamic support and resistance (3)
- dynamic technical analysis (1)
- DZZ (1)
- earnings (7)
- earnings estimates (1)
- earnings season (9)
- ECB (25)
- economic activity (1)
- economic crisis (3)
- economic indicators (4)
- economic outlook (1)
- economic stimulus (27)
- economics (84)
- economists (1)
- economy (358)
- ECRI (16)
- Ecuador (1)
- education (1)
- EIA (1)
- Elliott Wave theory (2)
- EMA (15)
- emerging markets (3)
- eminent domain (1)
- emotions and trading (27)
- Empire State Index (7)
- employment (12)
- energy (24)
- energy independence (12)
- engulfing candlestick pattern (1)
- entitlement spending (4)
- entrepreneurship (1)
- entry (1)
- EPA (2)
- EPS (1)
- equities (22)
- Eric Hovde (2)
- espionage (1)
- ETF (15)
- ethanol (4)
- Euro (79)
- Euro-Dollar Swaps (1)
- Eurobond (1)
- Eurodollar (16)
- Europe (75)
- European Central Bank (8)
- European Union (28)
- execution (1)
- exit (1)
- exiting multiple contracts (1)
- Exponential Moving Average (27)
- factory orders (4)
- fading the market (1)
- failure (1)
- fannie mae (5)
- farm dust (1)
- farm lobby (2)
- farm production (1)
- farms (1)
- FDIC (11)
- fear (2)
- Fed (267)
- Fed Funds (4)
- Fed policy (5)
- Federal Reserve Act (1)
- Federal Reserve Bank (137)
- feeder cattle (4)
- FHA (1)
- fiat money (6)
- fibonacci numbers (3)
- finance reform bill (7)
- financial crisis (9)
- financial markets (9)
- financial sector (2)
- fiscal policy (15)
- Fisherian economics (2)
- fixed income (1)
- floating rate notes (1)
- FOMC (6)
- food (27)
- food inflation (9)
- food prices (6)
- food stamps (1)
- Foreclosure-Gate (2)
- foreclosures (24)
- foreign policy (1)
- foreign stocks (3)
- Forex (7)
- formula (1)
- forward operating earnings (1)
- Founding Fathers (4)
- fracking (1)
- fractals (4)
- freddie mac (5)
- free enterprise (5)
- free markets (1)
- freedom (5)
- front-running (1)
- fuel (3)
- fundamentals (4)
- futures (24)
- futures analysis (1)
- futures and gambling (1)
- G20 (5)
- G7 (1)
- Gary Dorsch (1)
- gasoline (5)
- Gaussian (3)
- GDP (61)
- Geithner (3)
- geopolitics (5)
- George Soros (5)
- George Washington (1)
- Germany (7)
- global warming (14)
- goal-setting (11)
- gold (330)
- Goldman roll (1)
- Goldman Sachs (1)
- Gordon Long (5)
- government policies (136)
- grain in storage (8)
- grains (348)
- great depression (1)
- greed (1)
- greenhouse gases (1)
- Greenspan (4)
- gross output (1)
- GSCI (7)
- Guassian (1)
- handling losses (8)
- hard economic data (1)
- head and shoulders pattern (6)
- head fake (1)
- headlines (1)
- healthcare (1)
- healthcare reform (9)
- hedge funds (5)
- hedging (4)
- high frequency trading (3)
- Hindenburg Omen (7)
- Hoisington Management (3)
- hom (1)
- home sales (14)
- housing (122)
- Hugo Chavez (5)
- Hull (1)
- Hull moving average (3)
- humor (1)
- hunger (1)
- hurricane (5)
- Hussman Funds (1)
- hyperinflation (25)
- IMF (11)
- index funds (1)
- India (1)
- indicators (8)
- industrial equipment sales (2)
- industrial metals (4)
- industrial output (10)
- inflation (204)
- inflection points (3)
- insider trading (1)
- Institute for Supply Management (1)
- interest rates (54)
- International stocks (5)
- inventories (3)
- investing (1)
- investment banking (1)
- Iran (1)
- irrational exuberence (1)
- ISM (21)
- Israel (1)
- Jack Crooks (1)
- Japan (3)
- Jerome Powell (2)
- Jim Rogers (11)
- JK Rowling (1)
- jobless claims (26)
- jobs (154)
- John Adams (2)
- John Hussman (6)
- John Mauldin (45)
- John Maynard Keynes (3)
- John Paulson (1)
- John Taylor (1)
- Jonah Goldberg (1)
- keynesian economics (12)
- KGB King (11)
- Klinger (2)
- Klinger Volume (47)
- Klinger+ATR (14)
- Korea (1)
- Kremlin (9)
- labor force (1)
- labor market (1)
- lagging economic indicators (3)
- lake (1)
- Law (5)
- Leading Economic Indicators (12)
- lean hogs (7)
- leverage (3)
- liberty (2)
- LIBOR (11)
- limit down (1)
- liquidity (11)
- live cattle (11)
- livestock (3)
- loan modifications (1)
- lock limit (63)
- long-term trading (2)
- Loonie (1)
- LTRO (8)
- lumber (4)
- M3 money supply (2)
- MACD (9)
- macroeconomics (4)
- Main Street (1)
- manufacturing (17)
- Marc Faber (3)
- margin (10)
- margin calls (4)
- margin debt (1)
- mark to market accounting (4)
- market (1)
- market conditions (1)
- market interventions (6)
- market manipulation (6)
- market open (1)
- market psychology (1)
- market timing (1)
- market turmoil (2)
- market valuation (6)
- mean reversion (1)
- meats (3)
- media (2)
- media cheer-leading (1)
- melt up (1)
- Meredith Whitney (3)
- mergers and acquisitions (1)
- metals (2)
- methodology (2)
- Mexican Peso (2)
- Mexico (1)
- Michael Pento (3)
- midcap stocks (1)
- Middle East (1)
- milk (3)
- Minsky Melt-Up (1)
- misery index (2)
- Mish Shedlock (5)
- momentum (2)
- monetary policy (45)
- monetization of the Debt (8)
- month-end volatility (1)
- moral hazard (1)
- mortgage crisis (39)
- mortgages (1)
- moving averages (27)
- municipal bonds (4)
- NASDAQ (4)
- Nassim Taleb (2)
- national debt (8)
- natural gas (69)
- NBER (2)
- negative interest rates (2)
- net interest margin (1)
- new closing high (8)
- new home sales (9)
- new record high (106)
- new record low (20)
- New World Order (1)
- New Zealand Dollar (1)
- news (6)
- NFP (11)
- Niall Ferguson (2)
- nikkei (1)
- NIRP (2)
- Nouriel Roubini (5)
- Novak Djokovic (1)
- NYMEX (2)
- oats (3)
- Obama (61)
- Obamacare (2)
- OPEC (4)
- open (1)
- Open Interest (2)
- Open Market Operations (4)
- Operation Twist (1)
- opinion (1)
- opportunity cost (2)
- orange juice (3)
- order in charts (1)
- overbought (1)
- P/E ratios (2)
- palm oil (1)
- parallels (6)
- participation rate (2)
- Paul Krugman (2)
- pension funds (13)
- perchlorate (1)
- personal development (2)
- personal income (7)
- Peter Tchir (1)
- Phantom of the Pits (16)
- Phantom's Gift (11)
- Philippe Cahen (4)
- Philly Fed survey (4)
- platinum (3)
- Plunge Protection Team (1)
- PMI (13)
- politics (3)
- POMO (11)
- Ponzi scheme (1)
- pork bellies (1)
- poultry (1)
- power (1)
- PPI (22)
- prayer (1)
- precious metals (10)
- price controls (2)
- price-earnings ratios (4)
- prices (2)
- primary dealers (1)
- principles (1)
- productivity (3)
- profit-taking (2)
- profits (6)
- progressivism (1)
- propaganda (1)
- Proshares (1)
- QE (1)
- quant trading (2)
- quantitative easing (94)
- quotes (57)
- rally (6)
- rare earth minerals (3)
- re-hypothecation (1)
- real estate (2)
- real estate ETF (2)
- recession (27)
- record-keeping (1)
- recovery (5)
- redistribution of wealth (1)
- relief rally (1)
- renewable energy (2)
- renminbi yuan (8)
- repetition (1)
- resistance (2)
- retail (18)
- retail investors (2)
- retail sales (4)
- retirement (2)
- retracement (3)
- returns (1)
- reverse repos (1)
- rice (19)
- Richard Russell (4)
- Richmond Fed (2)
- Rick Santelli (1)
- riots (1)
- risk (13)
- riverbank (1)
- Robert Long (1)
- Robert Prector (1)
- Rogers TRAKRS (2)
- ROI (1)
- ruble (5)
- rule 48 (2)
- rule of law (1)
- Rules (2)
- Russell 2000 (1)
- Russia (33)
- S P 500 (1)
- S&P 500 (13)
- safe haven (1)
- SandP 400 Mid-Cap (2)
- Sarah Palin (1)
- saving (2)
- Schwarzenegger (1)
- SDRs (1)
- seasonal trading (19)
- SEC (4)
- self-coaching (1)
- self-talk (1)
- sell-off (3)
- sentiment (7)
- sequester (1)
- services PMI (1)
- session (1)
- shadow banking (1)
- shipping (2)
- short-selling (3)
- Silver (36)
- simple moving average (5)
- small business (6)
- small cap stocks (4)
- smart money (2)
- SNAP (1)
- social security (11)
- socialism (13)
- soft economic data (1)
- softs (8)
- solution focus (1)
- South African Rand (1)
- sovereign debt (71)
- soybean meal (4)
- soybean oil (6)
- soybeans (442)
- SP 500 (97)
- special drawing rights (1)
- speculation (40)
- SPR (2)
- spread trading (2)
- spreads (1)
- stagflation (8)
- statistics (1)
- steel (1)
- Stephen Roach (3)
- stochastic (4)
- stock futures (2)
- stock indexes (569)
- stock market (657)
- stock yields (1)
- stocks (19)
- success (19)
- sugar (30)
- support and resistance (6)
- supreme court (1)
- swine flu (5)
- swing trading (7)
- swiss franc (3)
- T1 (1)
- tail risk (1)
- TALF (1)
- TARP (13)
- taxation (21)
- technical analysis (7)
- technology (1)
- TED spread (4)
- thoughts (2)
- TIC data (2)
- tick charts (13)
- time intervals (8)
- TIPS (1)
- Todd Harrison (2)
- trade (5)
- trade deficit (4)
- trade gap (1)
- trade war (10)
- trades (11)
- Tradestation (5)
- trading (12)
- trading as a profession (51)
- trading as addiction (1)
- trading dynamically (1)
- trading hours (1)
- trading journal (2)
- trading methodology (22)
- trading performance (1)
- trading philosophy (19)
- trading profits (1)
- trading psychology (78)
- trading range (2)
- trading strategy (1)
- trading teams (1)
- trading thoughts (1)
- trading volume (11)
- training (1)
- treasuries (297)
- trend (12)
- trend analysis (1)
- Trichet (1)
- triptych (4)
- trucking (1)
- Trump (1)
- truth (1)
- tyranny (1)
- U.S. Congress (2)
- U.S. Constitution (2)
- UK (1)
- unemployment (202)
- United States (1)
- US Dollar (378)
- US Treasury Dept (2)
- USD (375)
- USDA (11)
- values (1)
- Venezuela (3)
- Visualization (2)
- VIX (5)
- Vladimir Putin (9)
- volatility (31)
- Volatiliy (1)
- Volcker (2)
- volume (21)
- Volume-weighted average price (2)
- Von Mises (1)
- VWAP (2)
- Wall Street (16)
- war (3)
- Warren Buffett (5)
- wealth (4)
- weather (1)
- Weighted Moving Average (2)
- wheat (245)
- wind energy (1)
- Working Group on the Financial Markets (1)
- World Bank (2)
- world economy (47)
- Yen (16)
- yield curve (12)
- ZEW (1)
Disclaimer:
This is a personal, not-for-profit web site, reflecting the opinions of its author. It is intended to be a personal journal of private trading and insights into the author's experience and trading methodologies. It is not a production of the author's employer or his business, nor is it affiliated with any NASD broker/dealer. Statements on this site do not represent the views or policies of anyone other than the author and/or invited guest authors. The information on this site is provided for discussion and recording purposes only, and are not investment or trading recommendations. Under no circumstances does this information represent a recommendation to buy or sell securities or any other financial instruments.
This information is not to be construed as an offer to sell or a solicitation or an offer to buy the commodities herein named. The factual information of this report has been obtained from sources believed to be reliable, but is not necessarily all-inclusive and is not guaranteed as to the accuracy, and is not to be construed as representation. The risk of trading futures and options can be substantial. Each investor must consider whether this is a suitable investment. Past performance is not indicative of future results. All images on this site are presumed to be in the public domain. Please advise us if this is not the case for removal.
This information is not to be construed as an offer to sell or a solicitation or an offer to buy the commodities herein named. The factual information of this report has been obtained from sources believed to be reliable, but is not necessarily all-inclusive and is not guaranteed as to the accuracy, and is not to be construed as representation. The risk of trading futures and options can be substantial. Each investor must consider whether this is a suitable investment. Past performance is not indicative of future results. All images on this site are presumed to be in the public domain. Please advise us if this is not the case for removal.