Saturday, October 20, 2012

Hoisington: Proof the Fed Is Causing Inflation, Not Growth

The Hoisington Quarterly Review and Outlook is one of the cornerstones of my reading on where the economy is headed. Van Hoisington and Lacy Hunt do a masterful job of turning data points into cogent, well-argued themes.
This month they waste no time in dissecting the Fed’s recent move to QE3 and similar efforts in Europe, arriving at the conclusion that “While prices for risk assets have improved, governments have not been able to address underlying debt imbalances. Thus, nothing suggests that these latest actions do anything to change the extreme over-indebtedness of major global economies.”
Their expectation: global recession. The only issue left to sort out, they say, is How deep will the downturn be?
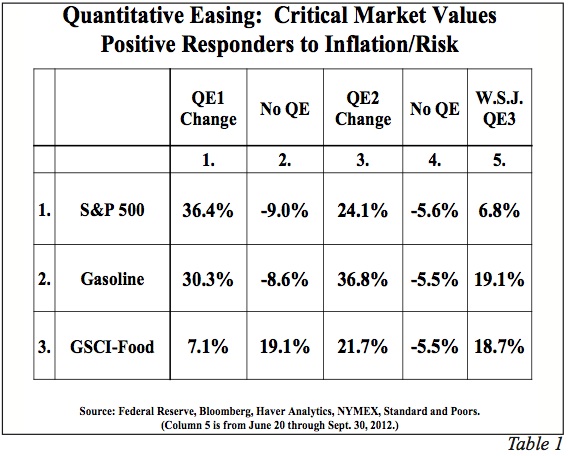
They make the interesting observation that with each injection of liquidity by the Fed, commodity prices have surged: “During QE1 & QE2 wholesale gasoline prices jumped 30% and 37%, respectively, and the Goldman Sachs Commodity Food Index (GSCI-Food) rose 7% and 22%, respectively. From the time the press reported that the Fed was moving toward QE3, both gasoline and the GSCI Food index jumped by 19%, through the end of the 3rd quarter.”
The QE picture gets even muddier. The unintended consequence of the Fed’s actions, say Lacy and Van, has been to actually slow economic activity: “The CPI rose significantly in QE1 and QE2 (Chart 1). These price increases had a devastating effect on worker's incomes (Chart 2). Wages did not immediately respond to commodity price changes; therefore, there was an approximate 3% decline in real average hourly earnings in both instances. It is true that stock prices also rose along with commodity prices (S&P plus 36% and 24%, respectively, in QE1 and QE2). However, median households hold a small portion of equities, and thus received minimal wealth benefit.”
They proceed to tear apart the wealth effect that the Fed is banking on to restimulate the economy, drawing on several solid studies. They also make the key point that “When the Fed actions lead to higher food and fuel prices, the shock wave reverberates around the world, with many foreign economies being hit adversely. When prices of basic necessities rise, the greatest burden is on those with the lowest incomes since more of their budget is allocated to the basic necessities such as food and fuel.”
The next few years are not going to be pretty. We’re looking right into the teeth of a rolling global deleveraging recession—the End Game, I’ve called it. And the decisions we make in the next couple years about how to handle our debts and budget deficits—here in the U.S., in Europe, in China and Japan, and elsewhere—are going to be absolutely crucial.
Hoisington Investment Management Company (www.hoisingtonmgt.com) is a registered investment advisor specializing in fixed-income portfolios for large institutional clients. Located in Austin, Texas, the firm has over $4 billion under management, composed of corporate and public funds, foundations, endowments, Taft-Hartley funds, and insurance companies.
My daughter Abbi is coming into town tonight from Tulsa with her fiancé, and most of the family will gather over the weekend for dinners and fun. And her twin Amanda is expecting, so another grandchild is in the future as well. Family and friends are among the few permanent fixtures in a world that seems to change almost weekly.
I was with Pat Cox of Breakthrough Technology Alert on Tuesday night. We watched the debate and then went deep into the night talking about the future. And got up the next day and did the same between meetings. We ended up doing a tag team that night for Hedge Fund Cares, which raised a lot of money to help abused children. I talked about the global landscape (which was not so upbeat) and he talked about the changes we see in the biotech world; and we then both answered questions, which was more fun, as we got to think about the marvelous the future that is shaping up. Such totally amazing things are happening. I am really quite the optimist over the longer term.
Have a great weekend, and look for your next Thoughts from the Frontline in your inbox Monday.
Your bullish on the future but bearish on governments analyst,

John Mauldin, Editor
Outside the Box
Hoisington Investment Management
Quarterly Review and Outlook
Third Quarter 2012

Growth Recession
Entering the final quarter of the year, domestic and global economic conditions are extremely fragile.  Across the globe, countries are in outright recession, and in some instances where aggregate growth is holding above the zero line, manufacturing sectors are contracting.  The only issue left to determine is the degree of the downturn underway.  International trade is declining, so weaknesses in different parts of the world are reinforcing domestic deteriorations in economies continents away.  With this global slump at hand, a highly relevant question is whether the U.S. can escape a severe recession in light of the following:
a) the U.S. manufacturing sector that paced domestic economic growth over the past three years has lapsed into recession;
b) real income and the personal saving rate have been slumping in the face of an interim upturn in inflation, and
c) aggregate over-indebtedness, which is the dominant negative force in the economy, has continued to move upward in concert with flagging economic activity.
New government initiatives have been announced, particularly by central banks, in an attempt to counteract deteriorating economic conditions.  These latest programs in the U.S. and Europe are similar to previous efforts.  While prices for risk assets have improved, governments have not been able to address underlying debt imbalances.  Thus, nothing suggests that these latest actions do anything to change the extreme over-indebtedness of major global economies. 
To avoid recession in the U.S., the Federal Reserve embarked on open-ended quantitative easing (QE3).  Importantly, the enactment of QE3 is a tacit admission by the Fed that earlier efforts failed, but this action will also fail to bring about stronger economic growth.
Commodity Market Reactions
Commodity markets have risen in reaction to the Federal Reserve’s liquidity injections into the banking sector (Table 1).  From the time the press reported that the Fed was moving toward QE1 & QE2 commodity prices surged.  During QE1 & QE2 wholesale gasoline prices jumped 30% and 37%, respectively, and the Goldman Sachs Commodity Food Index (GSCI-Food) rose 7% and 22%, respectively.  From the time the press reported that the Fed was moving toward QE3, both gasoline and the GSCI Food index jumped by 19%, through the end of the 3rd quarter.
Two theoretical considerations account for the rise in commodity prices during QE3.  The first is the expectations effect.  When the Fed says they want higher inflation, the initial reaction of the markets is to “go with”, rather than fight the Fed.  The second linkage, which is the expanded availability of funds used for collateral (margin), was identified and subsequently confirmed by Newedge economist, Dr. Rod McKnew, who stated, “In a world of advanced derivatives, high cash balances are not required to take speculative positions.  All that is required is that margin requirements be satisfied.”  Thus, when the Fed massively expanded reserve balances in QE1 and QE2, margin risk was minimized for those market participants who wished to take positions consistent with the Fed’s goal of higher inflation, and who had either direct or indirect access to the Fed’s hugely inflated reserve balances.  The April 22, 2011 issue of Grant’s Interest Rate Observer documented support for McKnew’s insight.  They asked Darrell Duffie, the Dean Witter Distinguished Professor of Finance at the Graduate School of Business at Stanford University, whether excess reserves could serve as collateral for futures and derivatives transactions.  Dr. Duffie’s answer was “acceptable collateral is a matter of private contract, but reserve deposits are virtually always acceptable.”
Devastation for Households
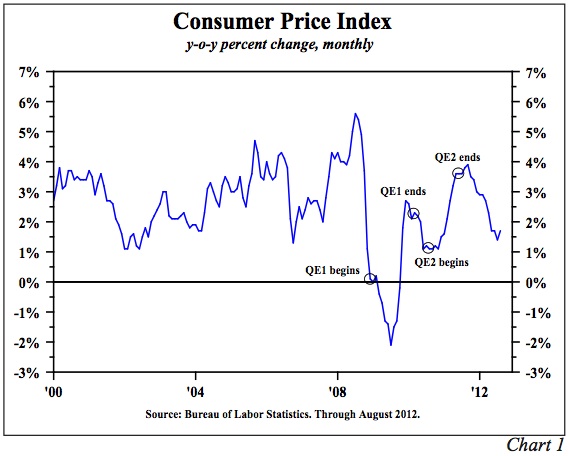
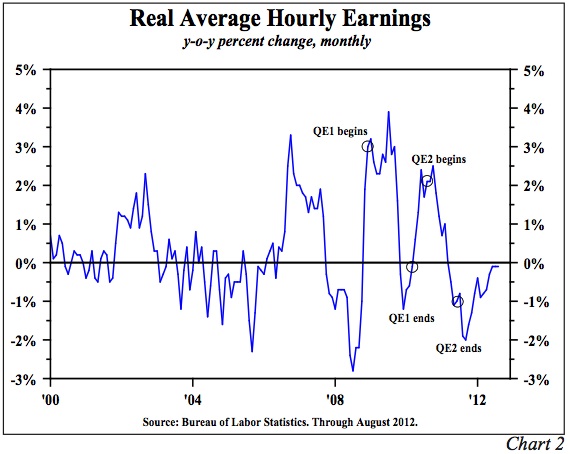
The unintended consequence of these Federal Reserve actions, however, is to actually slow economic activity.  The CPI rose significantly in QE1 and QE2 (Chart 1).  These price increases had a devastating effect on worker's incomes (Chart 2).  Wages did not immediately respond to commodity price changes; therefore, there was an approximate 3% decline in real average hourly earnings in both instances.  It is true that stock prices also rose along with commodity prices (S&P plus 36% and 24%, respectively, in QE1 and QE2).  However, median households hold a small portion of equities, and thus received minimal wealth benefit.
Wealth Effect
Despite the miserable economic results in QE1 and QE2, we now have QE3.  Fed Chair Ben Bernanke and other Fed advocates believe the “wealth effect” of QE3 will bring life to the economy.  The economics profession has explored this issue in detail.  Sydney Ludvigson and Charles Steindel in How Important is the Stock Market Effect on Consumption in the FRBNY Economic Policy Review, July 1999 write: “We find, as expected, a positive connection between aggregate wealth changes and aggregate spending.  Spending growth in recent years has surely been augmented by market gains, but the effect is found to be rather unstable and hard to pin down.  The contemporaneous response of consumption growth to an unexpected change in wealth is uncertain, and the response appears very short-lived.”  More recently, David Backus, economic professor at New York University found that the wealth effect is not observable, at least for changes in home or equity wealth.
A 2011 study in Applied Economic Letters entitled, Financial Wealth Effect: Evidence from Threshold Estimation by Sherif Khalifa, Ousmane Seck and Elwin Tobing found “a threshold income level of almost $130,000, below which the financial wealth effect is insignificant, and above which the effect is 0.004.” This means a $1 rise in wealth would, in time, boost consumption by less than one-half penny.
These three studies show that the impact of wealth on spending is miniscule—indeed, “nearly not observable.” How the Fed expects the U.S. to gain any economic traction from higher stock prices when rising commodity prices are curtailing real income and spending is puzzling.  This is particularly relevant when econometricians have estimated that for every dollar of gained real income, consumption will rise by about 70 cents.  Conversely, the Fed actions are causing real incomes to decline, which has a 70-cent negative impact on spending for every dollar loss.  Compare that with the 0.004 positive impact on spending for every one-dollar increase in wealth.  Former Fed Chairman, Paul Volcker, summarized the new Fed initiative as sufficiently and succinctly as anyone when he stated that another round of QE3 “is understandable, but it will fail to fix the problem.”
An International Corollary
The unintended consequences of QE3 could also serve to worsen and undermine global economic conditions already under considerable duress.  When the Fed actions lead to higher food and fuel prices, the shock wave reverberates around the world, with many foreign economies being hit adversely.  When prices of basic necessities rise, the greatest burden is on those with the lowest incomes since more of their budget is allocated to the basic necessities such as food and fuel.  Thus, a jump in daily essentials has a more profound negative impact on living standards in economies with lower levels of real per capita income.
Can the Fed Create Demand?
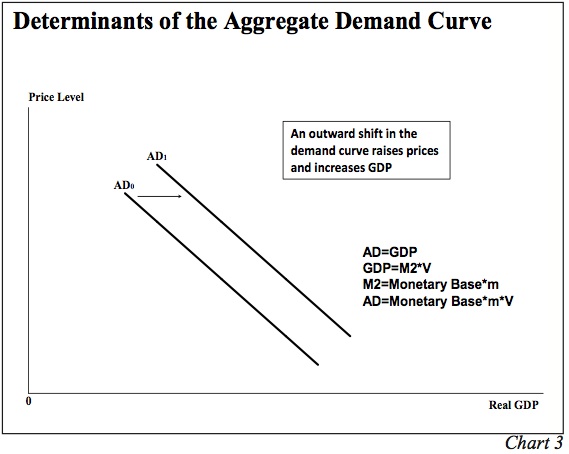
Can all the trillions of dollars of reserves being added to the banking system move the economy forward enough to eventually create a higher level of aggregate spending?  Our analysis of the aggregate demand curve and its determinants indicate they cannot.  The question is whether monetary actions can shift this aggregate demand (AD) curve out to the right from AD0 to AD1 (Chart 3).  If this were possible, then indeed the economy would shift to a higher level of prices and real GDP.
The AD curve is equal to planned expenditures for nominal GDP since every point on the curve is equal to the aggregate price level (measured on the vertical axis of the graph), multiplied by real GDP (measured on the horizontal axis of the graph).  We know that GDP is equal to money times its turnover or velocity, which is called the equation of exchange as developed by Irving Fisher (Nominal GDP = M*V). 
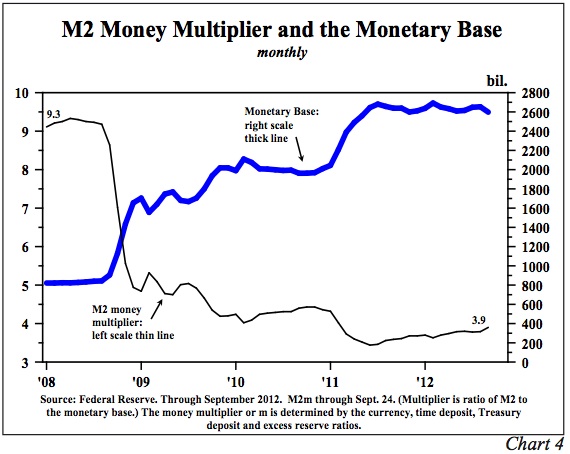
Deconstructing this formula, M (or M2) is comprised of the monetary base (currency plus reserves) times the money multiplier (m).  The Federal Reserve has control over the monetary base since its balance sheet is the dominant component of the monetary base.  However, the Fed does not directly control the money supply.  The decisions of the depository institutions and the non-bank public determine the money multiplier (m).  M2 thus equals the monetary base multiplied by the money multiplier.  The monetary base, also referred to as high powered money, has exploded from $800 billion in 2008, to $2.6 trillion currently, but the money multiplier has collapsed from 9.3 to 3.9 (Chart 4).  Therefore, the money supply has risen significantly less than the increase in the Fed’s balance sheet, with the result that neither rapid gains in real GDP nor inflation were achieved.  Indeed, with the exception of transitory episodes, inflation remains subdued and the gain in GDP in the three years of this expansion was the worst of any recovery period since World War II.
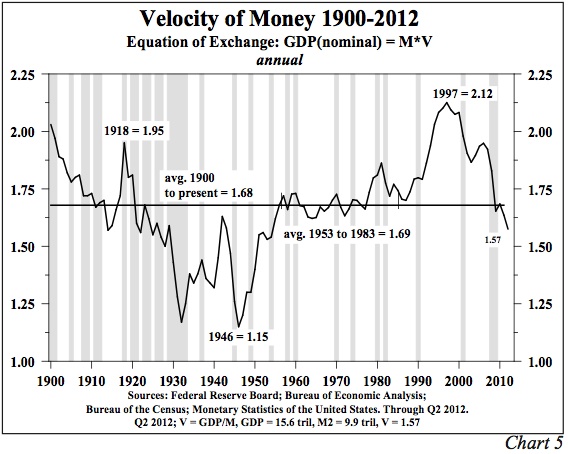
The other element that is required for the Fed to shift the aggregate demand curve outward is the velocity or turnover of money over which they also have no control.  During all of the Fed actions since 2008 the velocity of money has plummeted and now stands at a five decade low (Chart 5).
The consequence of the Fed’s lack of control over the money multiplier and velocity is apparent.  The monetary base has surged 3.3 times in size since QE1.  Nominal GDP, however, has grown only at an annual rate of 3%.  This suggests they have not been able to shift the aggregate demand curve outward.  Nor, with these constraints, will they be any more successful in shifting that curve under the present open-ended QE3.  Increased aggregate demand and thus rising inflation is not on the horizon.
[For a more complete discussion of the complexities of the movement of the aggregate supply and aggregate demand curves please see the APPENDIX.]
Treasury Bonds
As commodity prices rose initially in all the QE programs, long-term Treasury bond yields also increased.  However, those higher yields eventually reversed and generally continued to ratchet downward, reaching near record lows.  The current Fed actions may be politically necessary due to numerous demands for them to act to improve the clearly depressed state of economic conditions.  However, these policies will prove to be unproductive.  Economic fundamentals will not improve until the extreme over-indebtedness of the U.S. economy is addressed, and this is in the realm of fiscal, not monetary policy.  It would be more beneficial for the Fed to sit on the sidelines and try to put pressure on the fiscal authorities to take badly needed actions rather than do additional harm.  Until the excessive debt issues are addressed, the multi-year trend in inflation, and thus the long Treasury bond yields will remain downward.
 
APPENDIX
One of the most important concepts in macroeconomics is aggregate demand (AD) and aggregate supply (AS) analysis – a highly attractive approach that is neither Keynesian, monetarist, Austrian, nor any other individual school, but can be used to illustrate all of their main propositions.  However, before detailing the broader macroeconomics associated with the movement of the AD and AS curves, it is important to understand microeconomic supply and demand curves.  This can best be illustrated through the recent impact the Fed’s decisions had on commodity prices.  In the commodity market, like individual markets in general, the demand curve is downward sloping, the supply curve is upward sloping, and where they intersect determines the price of the commodity and the quantity supplied/demanded.  The micro-demand curve slopes downward because as the price of an item rises, the quantity demanded falls due to income and substitution effects (buyers can shift to a substitute product).  The micro-supply curve slopes upward since producers will sell more at higher prices than lower ones. 
Both supply and demand schedules are influenced by expectation, fundamental, and liquidity considerations.  When the Fed says that they want faster inflation and that they are going to take steps to achieve this objective, both economic theory and historical experiences indicate that commodity prices will rise, at least transitorily (as seen with the surge in commodity prices after the announcement of QE1, QE2 and QE3).  Information and liquidity available to the buyers is also available to the suppliers, so by saying faster inflation is ahead, suppliers are encouraged to reduce or withhold current production or inventories, moving the supply curve inward.  Thus, in the commodity market, the Fed action spurs an outward shift in the micro-demand curve along with an inward shift of the micro-supply curve, producing higher prices and lower quantities.  These microeconomic developments transmit to the broader economy, which we will now trace through AD and AS curves. 
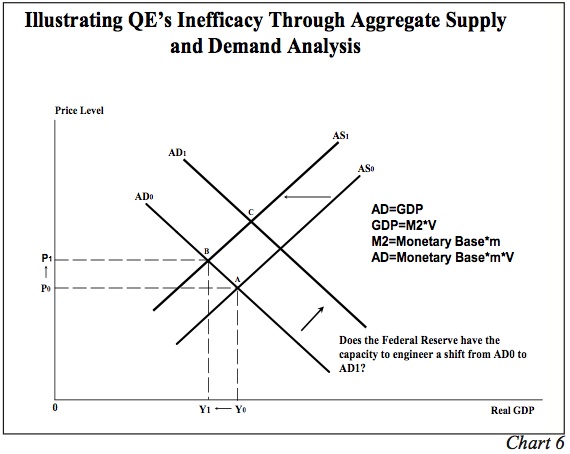
The AD curve slopes downward and indicates the amount of real GDP that would be purchased at each aggregate price level (Chart 6).  Aggregate demand varies inversely with the price level, so if the price level moves upward from P0 to P1, real GDP declines from Y0 to Y1.  When the price level rises, real wages, real money balances and net exports worsen, thereby reducing real GDP.  The rationale for the downward sloping AD curve is thus quite different from the sloping of the micro-demand curve since substitution effects are not possible when dealing with aggregate prices.  In order to improve real GDP with a rising price level, the AD curve would need to be shifted outward and to the right (from AD0 to AD1).  And as detailed in the letter, the Fed is not capable of shifting the entire AD curve. 
The AS curve slopes upward and indicates the quantity of GDP supplied at various price levels.  The positive correlation between price and output in micro and macroeconomics is the same since the AS curve is the sum of all supply curves across all individual markets.  When Fed policy announcements shock commodity markets, the AS curve shifts inward and to the left (from AS0 to AS1).  This immediately causes a reduction in real GDP (the difference between Y0 and Y1) as the price increases by the difference between P0 and P1 (also Chart 6).  Furthermore, as discussed in the letter, lower GDP as a result of higher prices reduces the demand for labor and widens the output gap, setting in motion a negative spiral. 
For Fed policy to improve real GDP, actions must be taken that either (1) shift the entire demand curve outward (to the right), or (2) do not cause an inward shift of the AS curve that induces an adverse movement along the AD curve.  Accordingly, the Fed is without options to improve the pace of economic activity.

More People Depend on Government Than Support It


Friday, October 19, 2012

Home Sales Disappoint!


The latest stock rally on Monday 10-15 was ignited by news that home starts had increased. But Wall St forgot that housing STARTS don't equate to home SALES. Home starts -- building -- only add to an already-bloated inventory! That is DEFLATIONARY, and is not a sign off recovery!

Now, reality returns to Wall St! Today, we learn that existing home SALES have declined. There is NO housing recovery!

Wha...? Dow Surpasses 200 Point Decline


Stocks Plunge 150 Points


Stocks Stumble On Bad Earnings Reports

Reality returns to Wall St for a day!


Thursday, October 18, 2012

Figures That As Headlines Worsen, Stocks Rise!

Interesting that despite higher unemployment claims, stocks are up! Figures!

The Fed's Unintended (As In "Self-Defeating") Consequences

Interesting quote from Goldman Sachs today:
"Once the price of Brent crude /oil/ reaches $125 /per barrel/, global economic growth becomes challenged and ultimately makes QE self-defeating. "

(Today, Brent crude is trading at $113.)

And from Zero Hedge regarding oil:
"The unending efforts of our glorious central-banking planners to raise asset prices and encourage 'animal spirits' through the trickle-down of unicorn-tears via the wealth effect have side-effects. Unintended consequences of 'leaking liquidity' finding its way into hard assets and 'things that have relatively limited supply' have stalled hopes of a stimulus in China (/due to high/ food inflation) and caused refis to mysteriously lag on misplaced future rate expectations in the US (ZIRP /the Fed's Zero Interest Rate Policy/). The biggest 'problem' the central-bankers face, however, is energy prices. The liquidity surges directly impact the price of oil (which is already under pressure from the ever-igniting fears of Middle-East flare-ups)."

Philly Fed Surpasses Explanation


ANOTHER EXAMPLE OF DATA MANIPULATION?

The Philly Fed manufacturing index was just released for September. It was surprisingly BETTER than expected.

But as they say, the devil is in the details! ALL of the internal data worsened from the previous month. It seems very strange that the headline figure can improve, while all the internal supporting data that created that headline WORSENED at the same time!

Here's one explanation of the bizarre data:
"And yet anyone who takes the 2 minutes to look at the internals, such as the collapse in the Number of Employees Sub-Index, which tumbled from -7.3 to -10.7 (the lowest since September 2009), the decline in the Average Employee Workweek, or the surge in Prices Paid from 8 to 19, double the change in Prices Received which means plunging corporate profits, or the ever critical New Orders which declined from 1.0 to -0.6, and one can see why this is a report only an Econ Ph.D-cum-Central Planner can love. Finally adding insult to injury, is the 6 month forecast, which unlike all other regional Fed diffusion indices, collapsed by half, from 41.2 to 21.6, as the Hopium at least in the city of brotherly mugging appears to be running out. Stocks kneejerk in every possible direction hoping the Fed will provide a direction."

Last Week's Halcyon Unemployment Claims Turn Sour Again

As of this morning, we now know that last week's huge drop in unemployment claims to the lowest levels in 4 years was very clearly an aberration, not a new trend. We know this because this week's unemployment claims leaped back to the trend. And not just to trend, but to the upper end of the trend! Of course, Wall St. is ignoring this news. They are having another Pollyanna Party.

Today's unemployment claims, which this week includes California (last week, the BLS said California didn't report), showed 388,000 new claims. That is closer to the 369,000 from two weeks ago and near the upper trend line that we have been accustomed to over the past several months. Last week's, just for the record, was just 339,000, the lowest level in four years. Of course, it didn't include more than 10% of the population of the U.S.

But as expected, the propaganda media is ignoring this news today. It's just soooo mundane to report the real trend, instead of the dreamily overoptimistic outlier from last week that was no doubt intended to prop up Obama's re-election prospects.

The BLS' explanation THIS week of LAST week's aberration?

"it appeared that state-level administrative issues were distorting the data"

Well duh! 

Tuesday, October 16, 2012

Euphoria! The Pollyanna Party Continues

Modestly mixed economic news yesterday has sparked a sharp stock market rally yesterday and today, bouncing off the lower Bollinger Band. Yesterday's modestly better-than-expected retail sales figures, while ignoring the Empire State manufacturing index that showed continued contraction, ignited the rally, which is picking up steam today. The Pollyanna Party is renewed!


Current Economic Perspective With a Chess Twist

I just love this guy. May I nominate Hussman for Fed Chair?


John P. Hussman, Ph.D.


“Patience is the most valuable trait of the endgame player. In the endgame, the most common errors, besides those resulting from ignorance of theory, are caused by either impatience, complacency, exhaustion, or all of the above.”

– Pal Benko
I’ve long been fascinated by the parallels between Chess and finance. Years ago, I asked Tsagaan Battsetseg, a highly ranked world chess champion, what runs through her mind most frequently during matches. She answered with two questions – “What is the opportunity?” and “What is threatened?” At present, I remain convinced that the key opportunity lies in closing down exposure to risk, because prices in both bonds and stocks have been driven to the point where the prospective additional compensation for risk is extraordinarily thin on a historical basis, and much of these gains are the result of monetary interventions in perpetual search of a greater fool.
The final minutes of a Chess game often go something like this – each side has exhausted most of its pieces, and many pieces that have great latitude for movement have been captured, leaving grand moves off the table. At that point, the game is often decided as a result of some seemingly small threat that was overlooked. Maybe a pawn, incorrectly dismissed as insignificant, has passed to the other side of the board, where it stands to become a Queen. Maybe one player has brought the King forward a bit earlier than seemed necessary, chipping away at the opponent’s strength and quietly shifting the balance of power. Within a few moves, one of the players discovers that one of those overlooked, easily dismissed threats creates a situation from which it is impossible to escape or recover.
My impression is that investors have been so entranced by the moves of their two Knights – Ben Bernanke and Mario Draghi – that they have allowed an entire army of pawns to pass across the board without opposition. In Chess, those overlooked, seemingly insignificant passed pawns can draw away the opponent's resources, or even be poetically transformed into the most powerful pieces in the game.
What are those passed pawns? On the basis of normalized earnings (which correct for the cyclicality of profit margins over the business cycle, as stocks are very, very long-lived assets) our projection for 10-year S&P 500 total returns is lower than it has been at any point prior to the late-1990’s bubble, with the exception of 1929. While it is very true that valuations have been even richer at various points in recent years, it should also be noted the S&P 500 (including dividends) has now underperformed Treasury bills for well over 13 years as a direct result. Similarly, the Shiller P/E remains higher than about 95% of instances prior to the late-1990’s bubble. Numerous recent weekly comments have detailed the variety of hostile indicator syndromes we presently observe, particularly the variants of “overvalued, overbought, overbullish” conditions that have regularly been followed by profound market losses over the intermediate-term (though not necessarily the short-term).
Meanwhile, my view continues to be that a recession in the U.S. is already an overlooked passed-pawn, as is the sharper-than-expected economic weakness in China, as is the overleveraged, undercapitalized state of the European banking system – particularly in Spain – where policy makers are misguided enough to believe that Draghi’s words alone are sufficient to substitute for bank capital and fiscal stability. The growing U.S. debt/GDP ratio is another passed-pawn, because while I expect the “fiscal cliff” will be resolved by a half-hearted combination of tax cuts and modest spending reductions, the final result is likely to leave a large structural deficit which we are only capable of financing due to the good fortune of unrealistically depressed interest costs and a combination of monetization and Chinese capital inflows (all which make endless deficits seem misleadingly sustainable).
Hugh Hendry of Eclectica recently got the tone right in his concerns about the endgame we are facing:
"Today, the world is grotesquely distorted by the presence of fixed exchange rate regimes. There are two. There is the Euro, and there is the dollar-remnimbi. All of Europe has defaulted. There are many stakeholders in the European project. There are financial creditors and then there are the citizens of Europe. Remarkably, the political economy of Europe is that the politicians chose to default on their spending obligations to their citizens in order to honor the pact with their financial creditors. And so of course what we're seeing is that as time moves on, the politicians are being rejected. So when I look at Europe, the greatest source of inspiration I have is fiction... We have the longest-serving Prime Minister, the Prime Minister of Luxembourg Mr. Juncker, who is on record as having said that 'when times get tough, you have to lie.' … the truth is unpalatable to the political class, and that truth is that the scale and the magnitude of the problem is larger than their ability to respond, and it terrifies them. The reality is that you just can't make up how bad it is. But it has precedent, and precedent perhaps offers us some navigation tools.
"The number one rule in terms of looking after wealth is preserving that wealth... I think we are single digit years away from the most profound market clearing moment - a 1932 or a 1982, where you don't need smart guys or girls, you just need to be bold. The crisis started here, it went to Europe… we could see a hard landing in Asia, coinciding and indeed being encouraged by the problems in Europe, and if you get those two events colliding, and given the lack of protection on such a scenario in Asia, then you would have another profound dislocation. And that's the point where you reach the bottom, and you don't need wise guys, you just need courage."
As an economist, I think it is important to recognize the underlying factors that support the present situation, as well as those that threaten it. The U.S. has benefited from low monetary velocity - the willingness of U.S. savers, financial institutions, China’s central bank, and others, to hold idle currency balances without meaningful compensation. Indeed, the reason that tripling the monetary base has not resulted in inflation is that monetary velocity has declined in direct proportion to that increase. In effect, people have passively held zero-interest money in whatever amount it is created. Contrast this with the German hyperinflation, when velocity rose as money became a “hot potato” – causing prices to rise even faster than the rate at which money was printed. Contrast the present situation also with the period from 1973 to 1982, when monetary velocity was rising, which also resulted in prices rising faster than the money supply. What creates inflation is the unwillingness of people to passively hold money balances, which then turns money into a hot potato. Higher interest rates on safe assets would have this effect, as that would create an alternative to zero-interest currency (which is why continued low inflation now relies on either holding interest rates at zero indefinitely, or massively contracting the Fed’s balance sheet should non-zero interest rates ever be contemplated).
Somehow, I suspect that all of us recognize that the present state of the world economy is being held up by extraordinary distortions both in the monetary realm and in fiscal policy, but for whatever reason, it is more pleasant to simply assume that everything is just fine, instead of thinking about the adjustments that would be required in order to move back to a sustainable global economic and financial situation. To some extent, we’ve become desensitized to extraordinarily large numbers – if hundreds of billions don’t solve the problem, then a few trillion will – ignoring the magnitude of those figures relative to our actual capacity to produce economic output.
Our problems are not insurmountable, but they are very difficult problems that do not have an easy solution or quick fix in some bold policy action (even in unrestrained ECB monetization). Deleveraging is hard. You simply cannot bring down the debt/GDP ratio unless a) economic growth exceeds interest rates by enough to offset the primary deficit*, or b) the government chooses to default on and restructure its debt obligations.
[*Geek's note : technically, the requirement is that (g - i) * Debt/GDP + PD/GDP > 0, where g and i are GDP growth and the interest rate on the debt, respectively (either both real or both nominal), and PD is the primary non-interest deficit (or surplus if positive)].
Importantly, printing money can bring down debt/GDP only if the government first locks in a low interest rate on its publicly-held debt by issuing very long term bonds, and then pursues enough inflation to raise nominal economic growth above that interest rate. Inflation will not devalue debt if the interest rate on the debt can be continuously reset in response. Presently, nearly all of the publicly-held U.S. debt is of short maturity. At an overall deficit of nearly 10% of GDP and a primary deficit of about 6%, there is very little chance that the ratio of publicly-held debt/GDP, which has nearly doubled since 2008, will easily stabilize in the coming years – particularly if we experience another recession. Moreover, we are unlikely to get consumer demand sustainably growing without dealing head-on with the problem of mortgage restructuring and underwater home equity – something that has been utterly ignored by policymakers. Done correctly, all of that is uncomfortable enough. Done poorly, it is profoundly destructive. Europe has already done it poorly, and it is not finished.
That said, I should emphasize that our present defensiveness does not rely on the assumption that we’ll see some profound economic dislocation. Rather, our defensiveness is driven by syndromes of evidence that have repeatedly been associated with negative return/risk outcomes in dozens of subsets of historical data. I’ll say this again: we are not defensive because of recession concerns or views about global financial strains. We are defensive because the market conditions that most closely resemble those at present have regularly, and throughout history, been associated with negative return/risk outcomes, on average.
The endgame of the market cycle
Just as the endgame is the part of the Chess match that counts the most, the final part of a market cycle is often where the most critical choices are made. The fact is that a bear market wipes out more than half of the gains achieved during the average bull market. For cyclical bear markets that occur during extended “secular” bear periods as we’ve observed since 2000 (featuring multiple bull-bear cycles, each which achieves successively lower valuations at the bear troughs), the bear markets typically wipe out closer to 80% of the gains achieved during the preceding bull period.
“Once you are in the endgame, the moment of truth has arrived... The amount of points that can be gained (and saved) by correct endgame play is enormous, yet often underestimated.”
– Edmar Mednis
In early March, our estimates of prospective stock market return/risk dropped into the most negative 2.5% of historical data (see Warning, A New Who’s Who of Awful Times to Invest), yet the S&P 500 is presently about 4% higher than it was then, and our estimates have dropped further, to the most negative 0.5% of historical observations. As I observed at the time, “While a few of the highlighted instances were followed by immediate weakness, it is more typical for these conditions to persist for several weeks and even longer in some cases ... When we look at longer-term charts like the one above, it's easy to see how fleeting the intervening gains turned out to be in hindsight. However, it's easy to underestimate how utterly excruciating it is to remain hedged during these periods when you actually have to live through day-after-day of advances and small incremental new highs that are repeatedly greeted with enthusiastic headlines and arguments that ‘this time it's different.’”
And so, we find ourselves facing the likelihood of another cyclical endgame, where in Benko’s words “impatience, complacency, exhaustion, or all of the above” can encourage investors to ignore rich valuations, weak economic fundamentals, heavy insider selling, overbullish sentiment, overbought market action, increasingly negative earnings preannouncements, and other syndromes that have historically been hostile for stocks.
These risks are easy to dismiss. Yields and prospective returns have been driven lower as investors seek an alternative to an ocean of zero-interest money, and prices have been driven higher – a fact that makes rising prices seem somehow automatic. The question is this - what else is left for investors to anticipate, with prices not depressed at all (as they were at the start of prior rounds of QE), and with QEternity now having removed any further “announcement effects.” Though market risk has been advantageous, it is doubtful that the market returns we’ve observed are durable.
“It often happens that a player is so fond of his advantageous position that he is reluctant to transpose to a winning endgame.”
– Samuel Reshevsky
So while it is true that stocks have advanced a few percent since March, my strong view is that this is good fortune born entirely of investor anticipation of ECB and Fed announcements that are now behind us. Indeed, the S&P 500 is lower now than when QEternity was announced, and on a volume-weighted basis, is also lower than when Draghi threw his hail-Mary pass over the Bundesbank. By our estimate, the present ensemble of market conditions is associated with a historical rate of loss in the S&P 500 approaching -50% annualized. Now, I don’t expect conditions to be similarly negative for a full year - the typical course is for the market to transition to less negative conditions after an initial hard decline. But I continue to believe that the gain in the S&P 500 since March, when our return/risk estimates became overwhelmingly negative, should not be the basis for complacency here.
“In the endgame, an error can be decisive, and we are rarely presented with a second chance.”
– Paul Keres
From a strategic standpoint, I believe that the best approach to the complete market cycle is to accept risk roughly in proportion to the return that can be expected as compensation. Indeed, this is one of the key results of finance theory. Our estimates of return/risk vary over the market cycle based on prevailing market conditions – being very hostile in periods when the market is in a mature, overvalued, overbought, overbullish market environment, and generally being aggressive when the market is in an undervalued, oversold, overbearish environment. To believe that we simply will never see the latter environment again, or that the next point we observe it will be at even higher prices than today, is an assumption that strains credibility from a historical standpoint. In any event, my perspective is that investment positions should not be based on a one-off forecast of what will occur in this specific instance, but on the average return/risk profile that has historically accompanied each prevailing set of market conditions.
“It is not a move, even the best move, that you seek, but a realizable plan.”
– Eugene Znosko-Borovsky
As Tsagaan suggested, the two ways to progress, and the two ways to err, are embodied in the questions “What is the opportunity?” and “What is threatened?” For our part, this particular cycle – this particular chess game – has been unusual in that we were forced to ask in 2009 whether far more was threatened than what had typically been at risk during other post-war market cycles. The “two-data sets problem” to address that question took enough time to solve that we missed an opportunity that we could have taken if our methods were already robust to out-of-sample Depression-era data at the time. That said, I believe that investors are committing a mistake in casually dismissing the question of “What is threatened?” in a mature, overvalued, overbought, overbullish market here. From my perspective, it appears to be the same error they made in 2000 and 2007.
 “The winner of the game is the player who makes the next-to-last mistake”
– Savielly Tartakover
From an investment perspective, the menu of opportunities appears very limited in an elevated stock market, with 10-year Treasury yields now down to 1.6%, and even corporate bond yields down to 2.7%. The opportunity here seems much more likely to be in limiting risk and taking gains than in extending risk and seeking further advances. Meanwhile, the historical chronicle of bull market gains that have been lost during the endgame, and the extent to which bear markets cause the surrender of those gains, should be a compelling answer to the question of what is threatened.
... and a final quote with absolutely no context
“A computer once beat me at chess. But it was no match for me at kick-boxing.”
- Emo Philips
The foregoing comments represent the general investment analysis and economic views of the Advisor, and are provided solely for the purpose of information, instruction and discourse. Only comments in the Fund Notes section relate specifically to the Hussman Funds and the investment positions of the Funds.

Monday, October 15, 2012

Doom Deepens

But stocks rise. Figures!


Friday, October 12, 2012

Volume Reverses, Shows Strong Selling

The Klinger volume indicator has developed a sharp reversal, suggesting strong selling of stocks.

Tuesday, October 9, 2012

EZ Slides Toward the Abyss

from the WSJ:
NEW YORK—Stocks opened lower as investors digested a bleak assessment for global growth and waited to see whether the start to earnings season would underscore economic worries.
The Dow Jones Industrial Average ticked down 22 points, or 0.2%, to 13563 in the minutes after Tuesday's opening bell. The Dow fell 26.50 points, or 0.2%, on Monday, snapping a three-session win streak.

Monday, October 8, 2012

IMF Says Risk of Global Recession Rising


OECD Tells U.S. To Put It's Fiscal House In Order

And just when the slowing economy was reaching stall speed, economists at the OECD give us this:


The world's finance ministers gathering in Tokyo this week will ramp up pressure on U.S. and European officials to resolve two mounting threats to the global economy: a standoff over budget policy in Washington and another dangerous turn in the euro-zone debt crisis.
At the annual meetings of the International Monetary Fund and World Bank, officials from the 188 nations that own the two institutions will plead for action as the world economy decelerates to its slowest growth since the global recession that started four years ago.

Friday, October 5, 2012

Today's Unemployment Farce

It wouldn't be election season, would it?

Today's unemployment report is so clearly a farce that it doesn't deserve any mention, but it is still today's market mover. So far, as the news and data is sliced and diced, stocks have given back about 75% of the initial gains. 


from Zero Hedge
We already noted the absolutely stunning surge in reported Household Survey jobs which "added" 873,000 jobs, or the most since 2003 and the second most in the past decade, which was just a little bit off the Household Survey used in the monthly NFP jobs changes, which came at 114,000, or about 8 times less. But what was the reason for this epic jump in Household survey jobs? Simple, and those who have read our series on America's transition to a part-time worker society know the answer. The reason is that the number of part-time people employed for economic reasons soared by 582,000 to 8,613,000, the most since October 2011, and the largest one month jump since February 2009, when "restoring" confidence in the economy was all the rage... and just before the Fed announced the full blown QE1 in March of 2009. Odd symmetry.

more:
Here's a peculiar statistical aberration:
  • Household Survey people employed: +873,000 (source)
  • Part-time jobs for economic reasons: +582,000 (source)
-> 582,000 divided by 873,000 = 0.666666666666*
Aka: precisely two thirds. Whatever are the odds...

Thursday, October 4, 2012

Stock Market Volume Explodes

The Klinger Volume indicator is exploding the last couple of days. See the circled are in the lower panel of this chart. If the Fed is funneling money to the big banks, who are funneling those funds into their own stocks (financials) and commodities, then this is highly inflationary!


Is the Fed trying to manipulate stocks higher to get Obama reelected, or are private investors feeling more confident after Romney's performance in the debates last night. The fact that they are buying "materials, energies, and financials" is evidence of the first scenario!

Of course, with the jobs report tomorrow, anything could happen, but clearly, Wall St is anticipating good news tomorrow morning.

Commodity Prices Push Stocks Higher

Note what KIND of stocks are higher -- materials (ie., commodities), energies, and the financials -- those that push the Fed monetary largesse around! This spells higher inflation, not greater prosperity!

Did Stock Futures Rise Because Romney Won the Debate?

I couldn't help noting that stock futures rose suddenly and sharply last night immediately during and following the Presidential debate between Mitt Romney and Barack Obama. What struck me was the odd hour -- between 8 and 10 pm Mountain Time -- that it occurred.

Why is this such an odd hour? Because at 10 here in Utah, the East coast of the US is already asleep (midnight), and it is still just 5 am in London, when most Europeans are still in bed. Both of North America and Europe are still asleep. Asia is awake, but the market movers in Asia usually occur earlier in the evening, around 6 pm here.

Thus, market movers at 10 pm are very rare. Perhaps the market was reacting to the perception that Romney handily won the debate, even in the eyes of left-wing pundits! Perhaps the market is reacting to the shift in momentum that this is likely to create in the presidential race, and a likely surge for Romney in polls!

Wednesday, October 3, 2012

Tuesday, October 2, 2012

Inflation Surges Across Developed World


Deficit Rose In FY 2012

This quote, in Dr. John Hussman's weekly market commentary, seemed particularly apropos to this thread (emphasis mine):

"Here in the U.S., the federal government is running a deficit approaching 10% of GDP despite suppressed interest costs. If addressing that deficit was just a political issue of doing the “right thing,” what would that right thing be? With total federal revenues at $2.3 trillion last year, and spending at $3.7 trillion, the gap itself represents more than half of total revenues and more than a third of total spending. That gap will not be closed even if lawmakers were to agree to an immediate repeal of the Bush tax cuts in their entirety. Assuming that all of the desired revenue actually showed up, the bump to revenues would only be about $100 billion a year - reducing the deficit by less than one-tenth. In the event of a recession (which we believe is already in progress), the increase in government debt - merely as a passive cyclical response to economic weakness – would swamp that effect even if all the tax cuts were repealed. Likewise, even in the current budget, less than $1.3 trillion represents discretionary spending that is negotiated between the President and Congress. The other spending represents mandatory outlays for Social Security, Medicare, military retirement, and so forth. Well over half of discretionary spending represents military spending. To balance the budget with spending cuts, Congress would have to wipe out discretionary spending altogether, including military outlays. Observers who believe that the fiscal cliff is simply a matter of political disagreement have vastly underestimated the depth of the challenges here."

Let the magnitude of that sink in! Think, for example, of the implications of the fact that our deficit is now equal to more than HALF of all revenues. If the politicians were serious about closing our deficits, they would have to nearly DOUBLE the income tax not merely on the wealthy, but on EVERYONE -- overnight! Are you willing to double your tax payments in order to sustain this level of spending? The whole "tax the rich" mantra is nothing but a useless ruse to distract us from an approaching disaster! It wouldn't make enough dent in our deficit to significantly reduce our debt accumulation or to stave of an economic disaster! Unfortunately, even the election of someone with the experience and economic know-how of Mitt Romney may not be able to save us from a rapidly-approaching day of economic reckoning! Still, I'd rather see him in the White House than the charlatan and master of beguilement and legerdemain who is there now!

Another important point Hussman makes:
Imagine that, folks! In our current state of affairs, entitlements are considered by politicians to be mandatory outlays, while defense and our military are considered to be "discretionary spending". How truly twisted is that? How ironic that the only one that is authorized in our Constitution as required is the spending for national defense, but the only item the politicians consider to be "mandatory" is entitlements. If that isn't an indicator of how topsy turvy things are in Washington, I don't know what is!

The point, of course, of Dr. Hussman's discussion about the magnitude of our debt and our "deficit gap" is that we are on an unsustainable path even in the short-term! I want to puke every time I hear someone say, "we're leveraging the future of our children and grandchildren", because it creates the false impression that this "day of reckoning" is one that is still perhaps decades away. It's not! We are very likely facing a calamity that would rival those stories in the Old Testament within the next 4-year presidential cycle -- NOT during the lifetimes of the young and not-yet-born! If we think we can evade having to deal with this crisis by kicking the can for a decade or two with the attitude that "as long as I get mine, what do I care?", then we are soon going to experience a very rude awakening to that mindset of lethargy and complacency!

You can read all of Dr. Hussman's weekly commentary by clicking on this sentence. It's worth the time it takes to read it! I consider it a must read every Monday morning! He is one of the leading economic writers and theoreticians living today. He studied with some of the best! He now runs a series of mutual funds. He's no mere ivory tower academic! (Did you read that, "Dr." Bernanke?)

Dr. Hussman, by the way, has also commented in recent months about the magnitude of inflation headed our way if the Bernanke Fed doesn't unwind its debt monetization scheme. He uses mathematical formulas to compute the kind of inflation that will ensue if the Fed doesn't "undo" what it has done before the velocity of money spikes. He estimated BEFORE the recent "QE to infinity" announcement by the Fed (a couple of weeks ago) that an inflation rate of 30+% would result from the Fed's QE1, QE2, and Operation Twist. Imagine the consequences of inflation of that magnitude! And Bernanke has only doubled down since!

If Bernanke thought he could fight that kind of inflation by raising interest rates to a level necessary, he would bankrupt the US Treasury with the interest costs on all of our debt! When we hit this debt brick wall within the next couple of years, it will impact every living American in ways that are both unimaginable and incalculable. We had best prepare ourselves! This brick wall may very well usher in what, in our future, we might very well refer to as the GREATER Depression, putting it into perspective with what Mr. Bernanke considers to be his special realm of study, what we have all come to know as the earlier "Great" Depression of the 1930s and 1940s!

Monday, October 1, 2012

Sentiment Improves Despite Tanking Economic Numbers

And of course, stocks are higher!

Sunday, September 30, 2012

Cocoa Too!

NEW YORK/LONDON: US cocoa futures marked their biggest quarterly jump in three years on Friday, capping a volatile session that lifted the market a lofty $95 within the first minute of trade, while raw sugar was on track to finish the third quarter down 10 percent.

The price of cocoa has been up all summer, and this only makes matters worse!

Grains Post Broad Gains on Short Supply

CHICAGO: US corn futures surged by the daily trading limit on Friday, adding 5.6 percent after the government said end-of-season stocks fell by a greater-than-anticipated 12 percent from a year ago, dipping below 1 billion bushels for the first time in 8 years.
Wheat futures jumped more than 4 percent, the strongest gain in 2-1/2 months, as the US Department of Agriculture said Sept. 1 stocks declined year-on-year, counter to trade expectations for an increase.
Soybeans followed corn higher, although gains in nearby contracts were tempered by a smaller-than-expected drop in ending stocks.
"The (ending stocks) number was bullish for the corn market, it was at the low end of estimates," said Sterling Smith, futures specialist for Citigroup.
"A sub-one-billion (bushel) number is enough to get the market nervous. Combine that with the market getting oversold the past month and it's leading to pretty good gains," he said.
The US corn stockpile was 11 percent below analysts' expectations at 988 million bushels, USDA said on Friday in a surprising report that presaged razor-thin supplies for the third year in a row.
USDA also said its survey of farmers and warehouses showed the soybean stockpile at the Sept 1 start of this marketing year was 29 percent, or 38 million bushels, larger than what traders had expected.
Wheat stocks also were surprisingly low, coming in eight percent below trade estimates.
"(Corn) feed use in the fourth quarter was bigger than people had thought so we're going to hear talk that we're going to do a better job of rationing in the feed sector. That's not so easy to do," Said Don Roose, president of US Commodities.
December corn futures on the Chicago Board of Trade surged 40 cents, or 5.6 percent, to $7.56-1/4 a bushel by 10:29 a.m. CDT (1429 GMT) after dipping to a three-month low of $7.05 before the report. It was the steepest rally for a spot month contract since July 5.
Corn futures were on pace for the first weekly gains in four weeks.
CBOT December wheat climbed 40 cents to $8.95-1/2 a bushel, a 4.7 percent gain that was the largest for a front-month contract since July 16.
November soybeans were up 6-1/2 cents, or 0.4 percent, at $15.77-1/4 a bushel. Still, the front-month soybean contract was poised for their second consecutive weekly decline and the steepest two-week drop in nearly a year.
Copyright Reuters, 2012

Feeder Cattle Limit Down

Cattle ended limit down because much higher prices for corn will result in ranchers slaughtering their cattle instead of feeding them. This short-term phenomena will ultimately result in smaller herds and even higher prices by early next year.

from Business Recorder:
CHICAGO: CME feeder cattle plunged by their 3-cent daily trading limit on Friday after corn stocks forecasts from the US Department of Agriculture came in short of expectations, driving corn prices up their 40-cent per bushel limit while boosting feed input costs, analysts and traders said.

Good Summary of Friday's Markets

from Investor's Business Daily:

Gold and silver prices dipped Friday as the dollar strengthened against global currencies on safe-haven buying that followed disappointing U.S. consumer sentiment and purchasing managers data. An economist warns a recession could lead to a meltdown in precious metals despite all the bullishness from global stimulus programs.
Spot gold prices shed 0.23% to $1774 an ounce intraday. During the quarter, it reached its highest price of 2012 and came within six percentage points of its all-time nominal high from 12 months ago.
This month Prestige Economics of Austin, Texas, raised its 2012 price target on the yellow metal to $1,684 an ounce from $1,649 per ounce. It also raised its 2013 target to $1,900 from $1,750 an ounce.
"The introduction of the European Central Bank's Outright Monetary Transactions (OMT) and the implementation of the Federal Reserve's quantitative easing ad infinitum greatly improved the prospects that our forecast of dollar weakness will come to fruition at a swift pace," Jason Schenker, president of Prestige wrote in his latest monthly outlook released Friday. "The downside risks to gold prices have been greatly reduced now that the Fed is on an endless buying spree of mortgage-backed securities (MBS)."
Gold prices are rising on expectations that central banks pumping up global money supply will spark inflation. The U.S. and European stimulus programs led to a domino effect at central banks around the world.
Japan and China have started their quantitative easing. India and Brazil lowered interest rates to spur growth. Singapore says it's ready to take action if needed.
"We have a global currency war where everyone is trying to devalue their currencies. In that case the only real currency is gold or silver," said Matthew Tuttle of Tuttle Wealth Management in Stamford, Conn. with about $100 million in assets.
Central banks in Russia, China, India and other countries are buying gold to diversify their reserves. Political conflict, such as that between China and Japan and in the Middle East, has also traditionally been positive for gold.
Why Gold Could Lose Its Luster
The Fed's newly created trillions are parked in bond portfolios at banks instead of being lent out as intended, says John Browne, senior economic consultant to Euro Pacific Capital in Westport, Conn. The newly printed money isn't fueling inflation as gold buyers expect. And if the U.S. goes into a recession, gold investors may sell their gold to raise cash and meet margin calls ignited by falling stock prices.
"In recessions, cash becomes increasingly scarce and real assets, including commodities, fall in price," Browne wrote in a client note. "As a commodity, gold should fall in price as recession becomes manifest."
"The possibility is rising of a worldwide recession, which normally tends to push down asset prices, particularly for stocks dependent on corporate earnings," he added.
PowerShares DB US Dollar Index Bullish (UUP), measuring the dollar against a basket of foreign currencies, rose inched up 0.39% to 21.90 Friday. It shed 1.8% in September and fell 2.5% for third quarter.
SPDR Gold Shares (GLD) shed 0.69% to 171.64 Friday. It climbed 4.5% in September and 10.6% for the quarter.
Market Vectors Gold Miners ETF (GDX) fell 0.20% to 53.68. GDX surged 12% in September and 20% in Q3.
Silver Prices
Spot silver prices fell 0.38% to $34.63 an ounce.
Schenker projects silver prices will average $31 an ounce in 2012 and $34.50 in 2013.
IShares Silver Trust (SLV) gave back 0.28% to 33.30 on Friday. It added 8.2% for the month and a robust 25% for the quarter.
Global X Silver Miners ETF (SIL) let up 0.14% to 24.93. SIL returned 16.3% in September and a whopping 34% in the third quarter.
Mutual funds specializing in gold and precious metals absorbed more than 90% of the $1.6 billion that flowed into commodity sector funds last week on fears that global stimulus programs will erode the value of fiat currencies, according to EPFR Global.
Economic Releases
The Institute for Supply Management-Chicago said its business barometer fell to 49.7 from 53 in August. Economists expected a reading of 52.8. It dropped for the first time in three years, signaling contraction. Readings below 50 mean contraction, and readings above it mean expansion.
The Thomson Reuters/University of Michigan Consumer Sentiment Index rose to 78.3 this month from 74.3 in August. Economists projected a reading of 79.

Natural Gas Is Rising Sharply Too!


Price of Gasoline Surges

This is the price of gasoline for one week.


Dairy Prices Skyrocketing

The cost of feeding dairy cattle is skyrocketing, and so are dairy futures. This is the price of Class III milk futures since April. Ouch!


Grain Prices Leap On Sorry USDA Report; Food Prices to Follow!

CHICAGO (AP) — Grains futures rose Friday on the Chicago Board of Trade.
Wheat for December delivery jumped 47 cents to $9.0250 a bushel; December corn rose 40 cents to $7.5625 a bushel; December oats rose 2.25 cents to $3.7050 a bushel; while November soybeans rose 30.25 cents to $16.01 a bushel.

Friday, September 28, 2012

Stocks Decline on Economic Weakness

from Bloomberg:

Stocks Drop on Economy Data as Gasoline Jumps on Supplies

U.S. stocks extended their worst weekly decline since June, while the dollar and Treasuries rose, as reports showed weakening economic growth. Gasoline surged on concern about tighter supplies in the U.S. East Coast.
The Standard & Poor’s 500 Index slipped 0.4 percent to 1,440.91 at 2:32 p.m. in New York and is down 1.3 percent this week...
Benchmark U.S. stock indexes extended weekly declines as the Institute for Supply Management-Chicago Inc. said its business barometer fell to 49.7 this month from 53 in August. A reading of 50 is the dividing line between growth and contraction.

Wednesday, September 26, 2012

Tuesday, September 25, 2012

What If the Fed Has It Wrong?

This was sent out by John Mauldin, by far my favorite economic analysts!

By Denis Ouellet
This is the 4th major intervention from the Fed since 2009, each one apparently inflating asset prices without having a definitive impact on the economy other than, most importantly, preventing a lethal debt-deflation spiral.
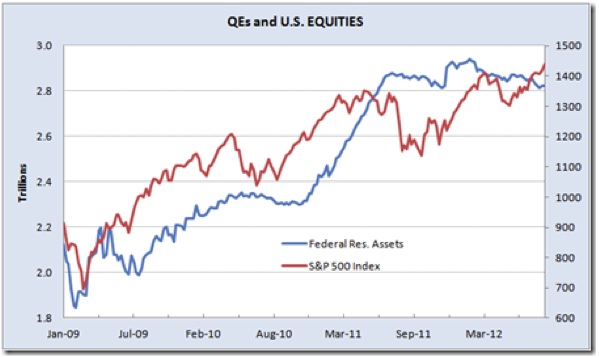
The chart above is used extensively to illustrate the close relationship between QEs and equity prices. Hence investors' Pavlovian reaction to last week's FOMC announcement of an open-ended and unlimited money printing program. Virtually every asset class rose, giving credence to Ben Bernanke's attempt to create a stimulating wealth effect.
What if the Fed has it all wrong?
Correlation does not imply causation. Could there be another reason for the spectacular rise in equity prices since 2009? Let's try earnings, just in case that intuitive, time-tested, relationship might still be working:
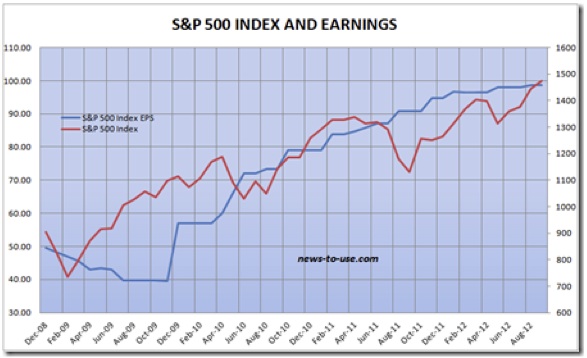
If there were a direct link between QEs and corporate profits, it should be apparent in S&P 500 company revenues. Yet, Index sales have only grown 16.5% during the last 3.5 years, nothing close to the 60% jump in Fed assets. Given that the Fed is now totally focused on growing employment, I doubt that it would take credit for the spectacular jump in profit margins since 2009, since most of it emanated from cost cutting (mostly labor) and rising productivity.
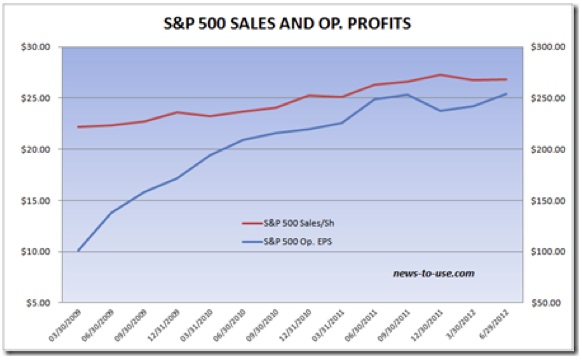
Some recent facts point to weaker earnings ahead:
•  Quarterly sales and earnings have peaked in the last 9-12 months.
•  Corporate profit margins are at an all-time high.
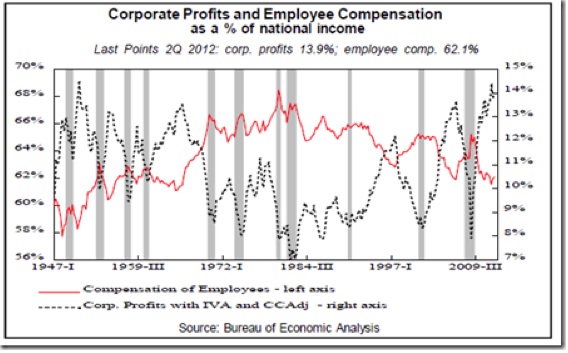
It is therefore dangerous to assume that margins will expand any further. From now on, corporations need to increase sales in order to grow their earnings. Unfortunately, demand is waning.
American wages, currently at a 50-year low as a percentage of GDP, are rising very slowly, so slowly that it is hampering consumer spending and the overall economy. At the time of previous QEs, also designed to create a wealth effect, wages were rising at a much faster clip than today. Furthermore, real wages were rising during 2009 and 2010, partly offsetting slow employment growth.
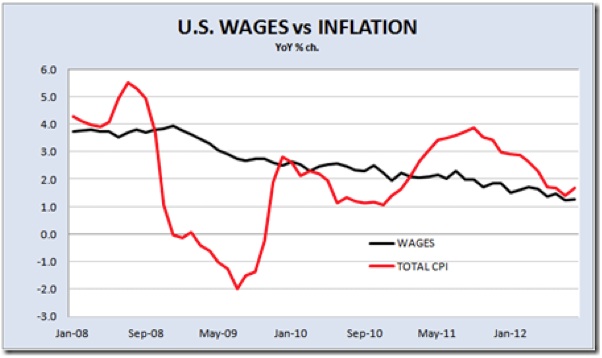
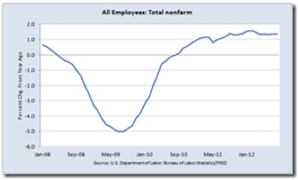
Today, employment growth remains below 1.5% YoY, a rate insufficient to reduce unemployment. Nominal wages are growing 1.2% while inflation is 1.7% and threatens to accelerate, in large part due to the impact that the Fed's actions are having on commodity prices, particularly oil prices.
 
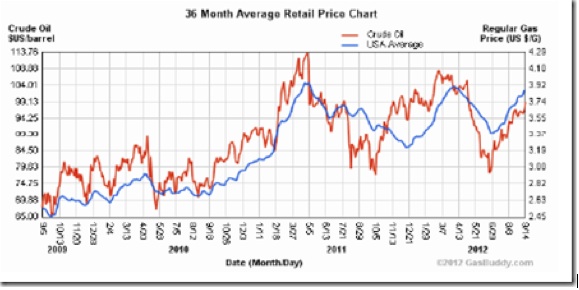
The US economy got lucky in 2011, when gasoline prices dropped 18% to $3.20/gal. just in time for the back-to-school season and Christmas. It's luck extended into 2012, when the U.S. experienced an extraordinarily warm winter. Unless something else extraordinary happens soon (SPR releases?), the exact opposite will happen to oil prices. Gasoline has jumped 16% since July, adding to the squeeze just as we enter the most important shopping period of the year (chart below from gasbuddy.com).
The following chart plots the Fed's printing with commodity prices. Unlike the relationship with equity prices, it is difficult to find anything other than excess financial liquidity to explain the spectacular rise in commodity prices. Considering how world economies have been doing lately, why is it that commodity prices have not declined significantly?
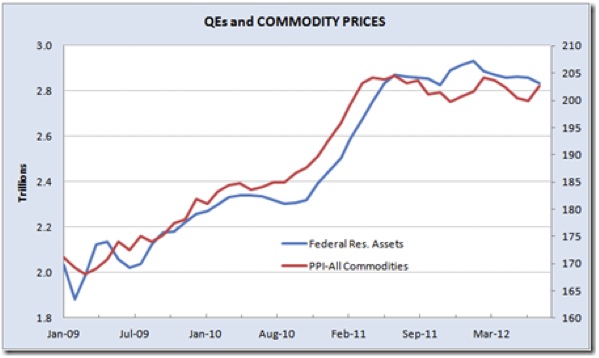
The Fed's balance sheet is set to grow another $800 billion by the end of 2013, the same amount it has increased since 2009, a period during which commodity prices jumped 20%.
The Fed wants to grow employment faster, but jobs don't grow out of thin air. Corporations create jobs when they have the means, they see a need, and there is visibility to commit. Needless to say, the last two conditions are far from being met these days. The Fed can't offset negative US politics, the European mess, nor the Chinese slowdown.
Bringing mortgage rates down further might help the slowly recovering housing sector and restart construction employment, but low wages and rising inflation remain a problem that might be perversely aggravated by the very actions the Fed is taking.
Wages are not about to accelerate, but inflation and taxation are problematic. If the American consumer can't spend, who will provide the needed spark?

Higher P/E Ratios to the Rescue?

Earnings have stalled, corporations are cutting guidance, and analysts are busy revising their estimates downward. Q3'12 estimates have been cut 8% since March and are now below Q2 earnings, which are themselves coming in much lower than originally expected. Q3 earnings are now seen down YoY.
If so, trailing 12-month EPS peaked last quarter and will decline in Q3. The earnings tailwind has disappeared.
There have been eight periods since 1935 when equities have risen in the face of declining earnings (see Banking [Betting] On Bankers?). In all cases, inflation declined along with earnings.
The dependable Rule of 20 says that "Fair trailing P/E = 20 minus inflation." Lower inflation begets higher P/Es. A fair P/E is thus 18.3 at the current 1.7% inflation level, 23% above the current 14.8x P/E, pointing to 1800 as fair value on the S&P 500, based on trailing EPS of $98.69. If this undervaluation is narrowed by the liquidity pumped out by the Fed, could it create enough wealth effect to push US consumers into a spending spree, in spite of negative real labor income growth?
The problem with Bernanke's wealth effect thesis lies with the new reality in America. Income and assets have lately been so significantly redistributed that only a tiny few actually feel a wealth effect from rising equity prices. Here are some sad facts:
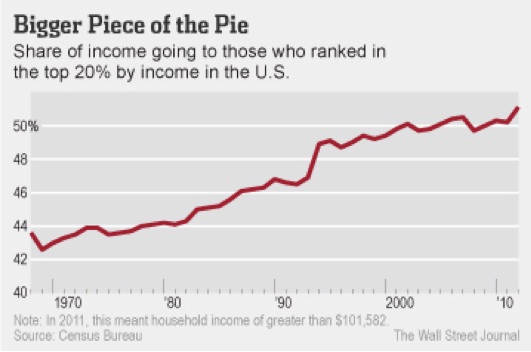
•  Last year, the top 20% of households took in 51.1% of all income in 2011, up from 50.2% in 2010 and the highest share since at least 1967, according to the Census Bureau. After the top, each quintile of income earners saw their share of income decrease, with the biggest drop among middle-income earners. The middle fifth of households took in 14.3% of all income last year. (WSJ)

•  In 2007, the top 20% of income earners had 53% of their financial holdings in stocks (directly and indirectly), down from 59% in 2001. Middle-income earners had 38% of their financial assets in stocks in 2007, down spectacularly from 47% in 2001.
•  Stock holdings have obviously declined since 2007:

•  US house values remain 30% below their 2006 peak level and now match their 2003 level.
•  Total residential mortgage debt has only declined 7.5% since 2008. Some 1.5 million homes are in foreclosure, but 10.8 million homes remain in negative equity.
The "wealthy few" may feel wealthier if stocks advance, but they could nevertheless have much less after-tax income to spend when politicians finally address the looming fiscal cliff nestled within the rapidly growing mountain of debt.
Keep in mind that it is these wealthy people who run American corporations, keeping them lean and mean and flush with cash. They remember how profits literally disappeared in 18 months in 2007-08. They remember how financial markets totally froze in 2008. They see the humongous budget deficits and the debt piling on, and the not-so-distant day of reckoning. They realize that all the Qes in the world can't offset inept and irresponsible politicians on either side of the Atlantic. Yet, they are the ones targeted by the so-called wealth effect!
Call that pushing on a golden string.
Meanwhile, the less affluent, the other 80% – some 250 million people – are little concerned by an eventual wealth effect but highly, directly, and immediately  impacted by the side effects of all these QEs, namely rising commodity prices and near-zero interest rates. Consider that:
•  15% of the US population lives in poverty.
•  44% of those 46.2 million poor Americans are in "deep poverty," which is half the level of the poverty line, defined as $22,811 for a family of four.
•  More than 45 million Americans are in the food-stamps program, which is 15% of the population, compared with the 7.9% participation from 1970-2000. Food-stamps enrollment has been rising at a rate of 400,000 per month over the past four years. Just last month (August), nearly twice as many people went on the food-stamps program (173,000) than managed to find a new job (96,000).
•  More than 11 million Americans are collecting federal disability checks.
•  11.2% of the labor force is out of work, if we include the 7 million people no longer seeking employment. This number (over 17 million workers) is unchanged since 2009.
•  Full-time employment remains 1.4 million below its 2009 level. Needless to say, part-timers earn and spend considerably less.
•  Most of the 43.5 million American retirees must cope with nominal interest rates, near zero through 2015, when inflation is around 2.0%.
Call that pushing on a chafed string.

Betting on Bankers?

Now that US and European central banks have delivered the financial heroin needed to compensate for inept and irresponsible politicians, should we jump back in equities?
Will professional investors drive equities higher?
The risk here is that, much like businesspeople, investors may remain cautious, given the numerous and highly complex difficulties the US and the world are facing. They will also consider that, at the time of previous QE program launches, equity markets were similarly undervalued, but many economic trends were then more positive:
•  Earnings were in a strong uptrend on rising margins.
•  Oil prices were much lower.
•  US real wages were rising (not in 2011).
•  The 2011-12 winter was one of the mildest on record in the US.
•  Europe was not in recession.
•  China was still growing strongly.
Interestingly, the undervaluation of equities, as measured by the Rule of 20, narrowed from 40% to 0% during QE1, from 23% to 7% during QE2, and from 19% to 14% during Operation Twist (see the black line in chart below). The recent rally has narrowed the undervaluation from 27% to 19%. It would be very surprising if we got near fair value anytime soon. If 10% undervaluation (average of QE2 and OT) is the best we can hope for, the resulting 16.5 P/E (90% of 20 minus 1.7% inflation) brings the S&P 500 to 1625, just about 10% above current levels.
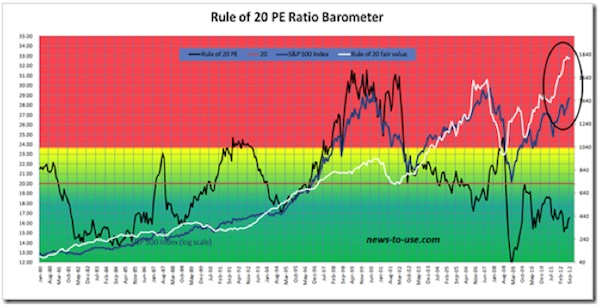
That assumes that inflation stays constant at 1.7% YoY. However, gasoline prices are +7% YoY in September, after rising 1.8% in August.. If they remain unchanged until year-end, gas prices will be +18% YoY. Not only would that considerably disrupt Christmas sales, it would also help raise inflation (gasoline is 5.5% of the CPI, energy is 9.7%). If inflation rises to 2.0%, a 10% undervaluation would get the S&P 500 Index to 1565, a mere 6% above current levels.
If the Fed has it all wrong, simply pushing on golden or chafed strings, and the only effect of QE3 is to boost inflation, only God(ot) knows what will happen.
While the Fed waits for the wealth effect to take effect, the European Central Bank is also waiting for its own Godot, following Draghi's magic with the ECB rules and regulations. Super Mario's "whatever it takes" promise is powerful but not without pitfalls:
•  When, if ever, will the eurozone achieve the necessary banking and fiscal unions?
•  Will Spain and Italy surrender before it is too late?
•  Will ever more austerity finally work?
•  When will the debt spiral stop?
•  How much longer will the Germans put up with the situation, accepting that the ECB ruins its balance sheet by taking on unlimited risk on behalf of the German taxpayers, risking their fiscal sovereignty to save the "reckless Southerners"?
•  How much longer will the hordes of unemployed young Europeans put up with the situation?
Central bankers have indeed delivered. In truth however, they are merely experimenting with totally unproven ways and means, hoping to gain enough time until more responsible politicians emerge. Given the significant risks still facing us until Godot shows up, investors should await more evidence that either earnings will resume their uptrend or some kind of miracle will happen.
Equity holdings should be trimmed to conservative levels. Sustainable income should be favored. Cash earns essentially nothing but is safe for now. Gold remains attractive for many, many obvious reasons.

Monday, September 24, 2012

Confidence Collapse

I read last night that "Import and Export volumes for China, US, Japan, and Europe are starting to drop notably." (Zero Hedge)
Now, business confidence in Europe's strongest economy is falling also. Only in the delusional and deceived USA does confidence improve, despite terrible economic conditions.