Not a pretty picture, from Zero Hedge:
We have discussed the exuberance and dysphoria that is exhibited by
economists in the context of extrapolating trends many times and nowhere
is that more clearly pictured than in Citigroup's Economic Surprise
Index which tracks the rise and fall of both misses and beats as well as
better or worse data. For the first time in over six months,
macro data for the G-10 has turned negative (with Europe having been
there for a while and the US getting very close) indicating significant
weakness. When this data turned from positive to negative in
July 2010 it pre-empted the 'rescue' of the global economy via QE2 and
each time it has dropped below its 200DMA (which it also just did) we
have seen notable deterioration in equity prices soon after. What is
more worrisome perhaps is the rate of deterioration over the last two
months or so. Four of the last five times we dropped this
rapidly we saw significant drops in stock prices soon after (Dec 2008,
August 2010, and June 2011). Europe and the US are now trending
lower in macro data 'surprises' as decoupling disappears but the US
remains a little less bad for those looking for silver-linings - for
now.
G-10 macro data has turned negative (upper pane) dropped below its
200DMA and is at its lowest in over six months. The pace of
deterioration has been rapid (lower pane) and 4 of the previous 5 times
this pace of drop has occurred, equity prices have dropped considerably
soon after...

US and Europe are now back in sync as decoupling becomes a dim and
distant memory though on the bright side we are not missing as badly as
Europe...

and in case you were wondering how well this syncs with stock
performance, her is the US-only Citi ECO surprise index relative to 3
month changes in the S&P 500...

Charts: Bloomberg
Tuesday, April 24, 2012
G-10 Data Turns Sharply Negative

Tuesday, April 17, 2012

Real Estate Gets Worse
The tiny little pink ellipse on this chart represents the news this morning that showed the real estate market getting still worse. Needless to say, Wall St considers it to be irrelevant.

Tuesday, April 10, 2012

Saturday, April 7, 2012

Friday, April 6, 2012


Thursday, April 5, 2012
Big Money Selling Stocks Since Mid-March
The volume indicator shown here (circled, lower panel) shows that the big money has been selling stocks since the middle of March. The last time we saw a sell-off of this magnitude, Bernanke responded the following day with a promise of more monetization of the debt (via John Hilsenrath at the WSJ). He purchased $44 billion of U.S. debt during the month of March.

Wednesday, April 4, 2012


Friday, March 30, 2012
Barclays Macro Data Surprise Index Continues Slide


Monday, March 12, 2012
Commodity Round-Up: Corn Spikes on Global Demand
Commodities closed today:     LAST      NET    PCT     YTD
                                        CHG    CHG     CHG
 US crude                   106.27    -1.13  -1.1%    7.5%
 Brent crude                124.93    -1.05  -0.8%   16.3%
 Natural gas                 2.246   -0.078  -3.4%  -24.9%

 US gold                   1701.10   -10.30  -0.6%    8.6%
 Gold                      1700.46    -7.57  -0.4%    8.7%
 US Copper                  384.60    -1.25  -0.3%   11.9%
 LME Copper                8466.50   -33.50  -0.4%   11.4%
 Dollar                     79.885   -0.156  -0.2%   -0.4%
 CRB                       315.480   -2.130  -0.7%    3.3%

 US corn                    667.75    13.75   2.1%    3.3%
 US soybeans               1334.00     2.25   0.2%   11.3%
 US wheat                   652.00    13.25   2.1%   -0.1%

 US Coffee                  182.35    -3.85  -2.1%  -20.1%
 US Cocoa                  2382.00   -28.00  -1.2%   12.9%
 US Sugar                    23.52    -0.14  -0.6%    1.2%

 US silver                  33.740   -0.472  -1.4%   20.8%
 US platinum               1699.40    14.50   0.9%   21.0%
 US palladium               706.85    -3.10  -0.4%    7.7%
Chinese corn imports may be at a "tipping point" ahead of higher purchases, Standard Chartered cautioned, as ideas of higher purchases sent corn futures higher again, with the near-term lot hitting a four-month high.
Chicago corn for May, the best traded lot, stood 2.3% higher at $6.60 a bushel in late deals.
Wednesday, March 7, 2012

Data Divergence
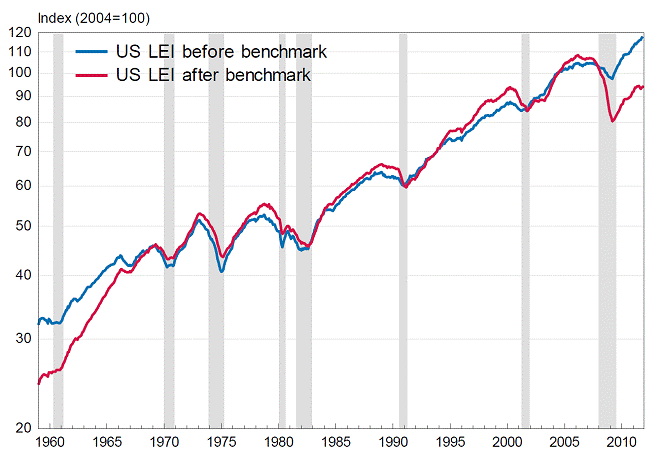
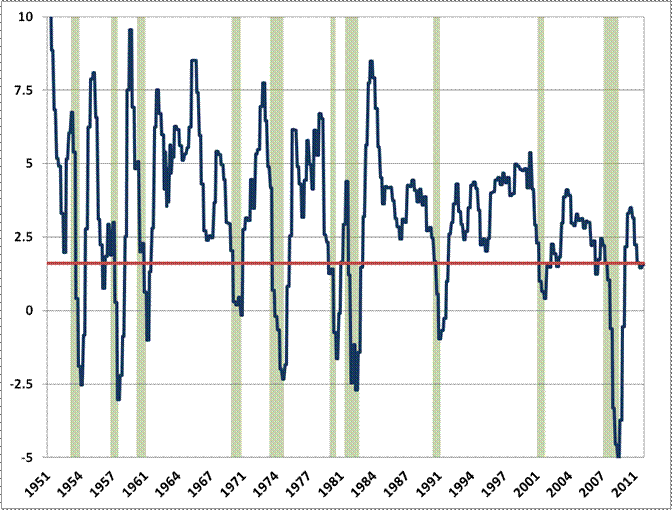
John Hussman has been predicting precisely this kind of data divergence in anticipation of the next stock market correction.
Morgan Stanley's David Greenlaw addresses this in a recent note to clients:
Warning, Will Robinson: Jobs May Disappoint!
While we wait for Friday eagerly, we continue to look for every scrap of data to feed our hunger to learn what's happening in the labor market.
To that end, the latest announcement from the NFIB is not good.
The organization that represents small businesses says net new job creation among their members was rather poor in February.
There was actually a very big decline in the net number of new firms planning on adding workers.
 |
 |
 |
15 Possible Black Swan Events That Could Trip Up the U.S. Economy
We live in a world that is becoming increasingly unstable, and the potential for an event that could cause "sudden change" to the U.S. economy is greater than ever.
There are dozens of potentially massive threats that could easily push the U.S. economy over the edge during the next 12 months. A war in the Middle East, a financial collapse in Europe, a major derivatives crisis or a horrific natural disaster could all change our economic situation very rapidly. Most of the time I write about the long-term economic trends that are slowly but surely ripping the U.S. economy to pieces, but the truth is that just a single really bad "black swan event" over the next 12 months could accelerate our economic problems dramatically.
If oil was cut off from the Middle East or a really bad natural disaster suddenly destroyed a major U.S. city, the U.S. economy would be thrown into a state of chaos. Considering how bad the U.S. economy is currently performing, it would be easy to see how a major "shock to the system" could push us into the "next Great Depression" very easily. Let us hope that none of these things actually happen over the next 12 months, but let us also understand that we live in a world that has become extremely chaotic and extremely unstable.
In the list below, you will find some "sudden change" events that are somewhat likely and some that are quite unlikely. I have tried to include a broad range of potential "black swan events", but there are certainly dozens more massive threats that could potentially be listed.
The following are 15 potentially massive threats to the U.S. economy over the next 12 months....
#1 War With Syria - U.S. Senator John McCain is now publicly calling for U.S. airstrikes against Syria. A military conflict with Syria becomes more likely with each passing day.
#2 War With Iran - A war in the Middle East involving Iran could literally erupt at any time. The following is from a Reuters news report that was issued on Monday....
President Barack Obama appealed to Benjamin Netanyahu on Monday to give sanctions time to curb Iran's nuclear ambitions, but the Israeli prime minister offered no sign of backing away from possible military action, saying his country must be the "master of its fate."#3 A Disorderly Greek Debt Default - Many reporters in Europe seem to think that this is becoming increasingly likely. So what would a disorderly Greek debt default mean for the global financial system? A leaked report that was authored by the Institute of International Finance says that a disorderly Greek debt default would have some very serious consequences. You can read the full text of that leaked report right here.
#4 An Economic Collapse In Spain - Spain has one of the largest economies in Europe and it is rapidly becoming a basket case. As I have written about previously, the unemployment rate in Spain has hit 19.9 percent, and the unemployment rate for workers under the age of 25 is up to 49.9 percent. Unfortunately, the situation in Spain continues to deteriorate. The following is from a recent article by Marc Chandler....
However, the devolution in Spain is particularly troubling. The new fiscal compact had just been signed last week, which includes somewhat more rigorous fiscal rule and enforcement, when Spain's PM Rajoy revealed that this year's deficit would come in around 5.8 percent of GDP rather the 4.4 percent target. This of course follows last year's 8.5 percent overshoot of the 6 percent target.#5 The Price Of Gasoline - The average price of a gallon of gasoline in the United States has risen for 27 days in a row and is now up to $3.77. Virtually all forms of economic activity are affected by the price of gasoline, and if the price of gas keeps going up it is eventually going to have dramatic consequences for the U.S. economy.
The problem that for Spain is that the 4.4 percent target was based on forecasts for more than 2 percent growth this year. However, in late February, the EU cuts its forecast to a 1 percent contraction. This still seems optimistic. The IMF forecasts a 1.7 percent contraction, which the Spanish government now accepts.
#6 The Student Loan Debt Bubble - Just like we saw with the housing bubble, the student loan debt bubble just continues to grow and grow and grow. At some point the nearly 1 trillion dollar bubble is going to burst. What effect will it have on our financial system when that finally happens?
#7 State And Local Government Debt Crisis - It is being reported that California is running out of cash again and there are cities all over the country that are on the verge of bankruptcy. Could we see a significant municipal bond crisis in the next 12 months?
#8 The Collapse Of A Major U.S. Bank - A number of top U.S. banks are looking increasingly shaky. In a recent article, David Trainer explained why he has such serious concerns about Bank of America right now....
In my opinion, there are four actions taken by financial services that signal the company is headed to serious trouble.#9 A Derivatives Crisis - The International Swaps and Derivatives Association recently ruled that the Greek debt deal will not trigger payouts on credit default swaps. This is seriously shaking confidence in the global market for derivatives. But the global financial system simply cannot afford a major derivatives crisis.
1. Management shake-up and major layoffs - lots of layoffs over the past year
2. Exploiting accounting rules to boost earnings - SFAS 159
3. Drawing down reserves to boost earnings: to the tune of $13.3 billion in 2011 and 2012
4. Bilking customers with new fees: tried it before and trying it again
Bank of America has taken all four steps.
Estimates of the notional value of the worldwide derivatives market range from $600 trillion all the way up to $1.5 quadrillion. The notional value of all derivatives held by Bank of America is approximately $75 trillion. JPMorgan Chase is holding derivatives with a notional value of approximately $79 trillion.
When the derivatives bubble finally bursts it is going to be a financial horror show unlike anything we have ever seen.
#10 The Fall Of The Japanese Economy - The Japanese economy shrank at a 2.3 percent rate during the fourth quarter of 2011. Japan has a debt to GDP ratio of over 200 percent and a major debt crisis involving Japan could erupt at any time.
#11 A "Solar Megastorm" - Scientists tell us that there is a "1 in 8 chance" that a "solar megastorm" will hit the earth by 2014. A recent Daily Mail article detailed what some of the consequences of such an event would be....
'We live in a cyber cocoon enveloping the Earth. Imagine what the consequences might be,' Daniel Baker, of the University of Colorado's Laboratory for Atmospheric and Space Physics told National Geographic when asked about a potential 'megastorm'.#12 A Major West Coast Earthquake Or Volcanic Eruption - On Monday, there was a 4.0 earthquake in San Francisco and a 6.1 earthquake in Argentina. Is the "Ring of Fire" waking up again?
'Every time you purchase a gallon of gas with your credit card, that's a satellite transaction.
'Imagine large cities without power for a week, a month, or a year. The losses could be $1 to $2 trillion, and the effects could be felt for years.
#13 Tornado Damage To Major U.S. Cities - Last year, the U.S. experienced one of the worst tornado seasons of all time. This year, we have already seen the worst tornado outbreak ever recorded in the United States in the month of March. A couple of towns in Indiana were completely wiped out by that outbreak. So what should we expect when we get to the heart of tornado season this year?
#14 Severe Drought In The United States - Last summer was one of the driest summers on record in the United States, and in many areas there is simply not enough water available for farmers this year. Some are even projecting that we could see "dust bowl conditions" return to some areas of the country eventually.
#15 An Asteroid Strike In 2013 - Although scientists tell us that the probability is extremely low, the truth is that there is a slight chance that a sizeable asteroid could hit the earth in February 2013. The asteroid is estimated to be between 60 and 100 meters wide, and it is projected to pass by our planet "at a distance of under 27,000 km". If it did hit us (and scientists say that the odds of that happening are very low) it would potentially be as serious an event as the Tunguska Event in Siberia in 1908. Mac Slavo of shtfplan.com recently described how awesome the Tunguska Event really was....
On June 30, 1908 an incoming meteor exploded approximately 5 miles above Siberia. The force of the air burst explosion, estimated at between 15 and 30 megatons, or about 1000 times bigger than the atomic bomb that destroyed Hiroshima, was so powerful that it annihilated everything in an 830 square mile area, and reports suggest that that explosion was heard up to 1000 miles away. Because of the remoteness of the impact zone, the Tunguska Event over Siberia had very little effect on the human population in the region, but the destruction of some 80 million trees in the area shows just how powerful a blast was created.Of course there are so many other "sudden change" events that could potentially happen - a terror event in a major U.S. city, a deadly pandemic, an EMP attack, cyberterrorism or a major political scandal could all possibly cause a stock market crash and an economic collapse in the United States.
In the world that we are living in today, you just never know what is going to happen.
So what are all of you concerned about over the next 12 months?
Do you see the potential for some "black swan events" to happen?
Wednesday, February 1, 2012
Hussman Predicts a "Goat Rodeo"
John P. Hussman, Ph.D.
All rights reserved and actively enforced.
Reprint Policy
Goat Rodeo - Appalachian slang for a chaotic, high-risk, or unmanageable scenario requiring countless things to go right in order to walk away unharmed.

Tuesday, January 31, 2012
It's a Bad Hair Day in the Financial Markets. Time for a Wake-Up Call!

The news is almost universally bad today. After the market rallied powerfully to erase a 150-point Dow loss yesterday, today the news is bad, bad, bad.
Home sales are down 7 months in a row! Case/Shiller is tanking!
The Baltic Dry Index continues to tank!
Chicago PMI was down, surprising the market to the downside!
The U.S. is on the verge of sharp job losses, according to Art Cashin!
From Art Cashin UBS Financial Services:
Disappointing Jobs - While everyone seems to debating what the non-farm payroll numb will be Friday, a few are looking toward the annual revisions in the much debated Birth/Death model.
As you probably recall, it does not refer to the birth or death of humans. The badly named model refers to the birth and death of businesses. Each January the BLS revises the number, usually vaporizing thousands of jobs.
We were going to try and calculate the likely revision, but our sharp-eyed friend over at Bloomberg, Rich Yamarone, as usual, beat us to it. Here’s what he wrote in his Notepad column recently:
The Net Birth/Death (NBD) statistic adjustment – an adjustment the BLS uses to account for job creation or loss with respect to births and deaths of businesses – is always the weakest during January. Over the last five years the NBD for January has averaged -335k. [January 2011: -339k, January 2010: -427k, January2009: -356k, January 2008: -378k, January2007: -175k.]
The CBO says the real unemployment rate is 10%!
"Had that portion of the decline in the labor force participation rate since 2007 that is attributable to neither the aging of the baby boomers nor the downturn in the business cycle (on the basis of the experience in previous downturns) not occurred, the unemployment rate in the fourth quarter of 2011 would have been about 1¼ percentage points higher than the actual rate of 8.7 percent"- translation: CBO just admitted that the BLS numbers are bogus and real unemployment is 10%.
The latest "treaty" out of Europe leave much to be desired, despite that Euro-zone countries are going to be required to give up most of their sovereignty.

Retail sales in Germany are slumping.
Europe data shows almost certain recession in the area with the largest GDP in the world.

Monday, January 30, 2012

Thursday, January 26, 2012
Bad News = Higher Markets! Go Figure!
These are the headlines following the Fed's announcement yesterday of more easy money, which juiced the stock market. Interestingly, bonds are higher also.


Wednesday, January 25, 2012
Fed to Extend Period of Easy Money
Stocks leaped on news that the Fed will extend it's ZIRP through the end of 2013 -- nearly another three years.
Tuesday, January 24, 2012
Scrambled Greece?

Last night, Goldman Sachs indicated that they don't expect the Fed to initiate any additional quantitative easing, and upon that announcement, the selling began. It still isn't enough, however, to turn the market bearish.

Monday, January 23, 2012


Sunday, January 22, 2012
No Deal on Greece Bailout

Stocks modestly lower in early evening trading.
Wednesday, January 18, 2012
Hoisington Calls for Recession in 2012
By Van R. Hoisington and Lacy H. Hunt, Ph.D.
High Debt Leads to Recession
As the U.S. economy enters 2012, the gross government debt to GDP ratio stands near 100% (Chart 1). Nominal GDP in the fourth quarter was an estimated $15.3 trillion, approximately equal to debt outstanding by the federal government. In an exhaustive historical study of high debt level economies around the world, (National Bureau of Economic Research Working Paper No. 15639 of January 2010, Growth in the Time of Debt), Professors Kenneth Rogoff and Carmen Reinhart econometrically demonstrated that when a country's gross government debt rises above 90% of GDP, "the median growth rates fall by one percent, and average growth falls considerably more." This study sheds considerable light on recent developments in the United States. After suffering the most serious recession since the 1930s, the U.S. has recorded an economic growth rate of only 2.4%. Subtracting 1% from this meager expansion suggests that the economy should expand no faster than 1.4% in real terms on a trend basis going forward, which is virtually identical with the economy's expansion in the past twelve months.
In highly indebted countries, governments have expansively taken resources from the private sector through taxing and borrowing. This leaves the private sector with less vigor to produce jobs and increase productivity, and subsequently wealth for its fellow citizens. This theory, which dates back to David Hume's essay, Of Public Credit published in 1752, is now being played out in real time in the United States. We judge that when an economy is expanding in such a meager fashion it is exposed to an increasing frequency of recessions. We expect such a recessionary event to emerge in 2012.
Contractionary Fiscal Policy
It would be difficult to devise a more horrendous set of fiscal policy parameters to spur economic growth than currently exist. Real federal government purchases of goods and services, which comprise 8% of real GDP, will decline by about 1% if the impartial projection of the Congressional Budget Office (CBO) for a fiscal 2012 deficit of about $1.3 trillion is in the ballpark. Defense spending will bear most of the decline in federal expenditures, but non-defense spending will, at best, be flat. In spite of record deficits since the spring quarter of 2009, real federal government purchases of goods and services have risen at an anemic 1.5% annual rate, confirmation that only a small amount of exploding expenditures went for infrastructure projects. The scant growth rate in the economy suggests a negative outlay multiplier.Contrary to common belief, the massive deficits of recent years will actually reduce economic growth in 2012 through a subtle, but nevertheless credible channel consistent with the preponderance of economic research. Studies suggest the government expenditure multiplier is zero to slightly negative. Increased deficit spending does appear to provide a modest lift to GDP for three to five quarters, depending upon the initial conditions of the economy. However, following this small, transitory gain, deficit spending actually retards GDP growth and the economy returns to its starting point at the end of about twelve quarters. Based on our interpretation of these studies, the U.S. economy is now on the backside of the string of record deficits, and this will be a drag in 2012. Despite the massive spending, all that is left is an economy saddled with a higher level of debt, with more of its productive resources diverted to paying the non-productive elevated level of interest payments. According to the CBO, gross federal debt will rise to at least 103% by the end of 2013. However, if the FICA tax reduction is extended for the full year, and/or a recession ensues, as we expect, revenues and expenditure estimates by the CBO will prove to be too optimistic. Under current circumstances, no viable way exists to remove the increasing federal debt burden from the economy's growth trajectory. As such, the federal fiscal constraint is operative for the foreseeable future.
In the past three fiscal years, the budget deficit averaged 9.3% of GDP (Chart 2), the highest since 1943-45. Federal outlays were almost 25% of GDP (Chart 3), and also the highest since the final three years of WWII. Dr. Barry Eichengreen of the University of California at Berkeley, author of Exorbitant Privilage,estimates that after 2015 this outlay figure is headed to 40% over the next quarter century without major structural reforms in Social Security and Medicare. For Dr. Eichengreen this means that the current law cannot remain unchanged in spite of the lack of political will to deal with the issue. Dr. Eichengreen states: "The United States will suffer the kind of crisis that Europe experienced in 2010, but magnified. These events will not happen tomorrow. But Europe's experience reminds us that we probably have less time than commonly supposed to take the steps needed to avert them. Doing so will require a combination of tax increases and expenditure cuts." He goes on to point out that, "At 19 percent of GDP, federal revenues are far below those raised by central governments in other advanced economies with spending on items other than health care, Social Security, and defense and interest on the debt having shrunk from 14 percent of GDP in the 1970s to 10 percent today, there is essentially no non-defense discretionary spending left to cut. One can imagine finding small savings within that 10 percent, but not cutting it by half or more in order to close the fiscal gap."


Consistent with this analysis, the Trustees of Social Security and Medicare have calculated that the present value of unfunded liabilities of these two programs totals $59.1 trillion. Additionally, there have been tabulations that all federal government liabilities, including those of Medicaid, veterans and other defense obligations, pension liabilities of government employees, and additional federal programs total $200 trillion at present cost.
These massive unfunded liabilities, when coupled with our present trillion dollar deficit, point to the stark reality that significant revenue increases and serious cuts in all programs will be shortly forthcoming. If these readjustments take advantage of current knowledge regarding tax and spending multipliers, the economic implications should not be severe. Clearly the only solution for our present predicament is to have a vigorous and rapidly expanding private sector and a shrinking public sector. As an investor concentrated solely in Treasury securities, our maturity structure will depend greatly upon the timely resolution of the country's present deficits.
State and local purchases of goods and services (10.9% of real GDP) has fallen at a 2.1% annual rate since mid 2009, and is poised to decline further in 2012. The fiscal condition of these levels of government has improved due to rising tax revenues and expenditure cuts. However, about one half of the states still face deficits in the final half of the current fiscal year and/or in the new fiscal year that begins in July 2012. Also, these budgets do not reflect the unfunded liabilities of their pension funds that are experiencing another year of investment returns that are considerably less than their actuarial assumptions. Further, a number of states enacted temporary tax increases that expire. Thus, state and local governments must continue to either cut spending or renew the taxes that politicians promised were temporary. The seeming improvement in state and local finance is an illusion, and this drag on economic activity will continue.
Monday, January 16, 2012
Eurodollar Futures Explained
Futures contracts
The Eurodollar futures contract refers to the financial futures contract based upon these deposits, traded at the Chicago Mercantile Exchange (CME). Eurodollar futures are a way for companies and banks to lock in an interest rate today, for money it intends to borrow or lend in the future.[7] Each CME Eurodollar futures contract has a notional or "face value" of $1,000,000, though the leverage used in futures allows one contract to be traded with a margin of about one thousand dollars.[8]The minimum fluctuation in a Eurodollar contract is one-quarter of one basis point (0.0025% = $6.25 per contract) in the nearest expiring contract month, and one-half of one basis point (0.005% = $12.50 per contract) in all other contract months. [9] Trading in Eurodollar futures is extensive, and the market for them tends to be very liquid.
CME Eurodollar futures prices are determined by the market’s forecast of the 3-month USD LIBOR interest rate expected to prevail on the settlement date. The settlement price of a contract is defined to be 100.00 minus the official British Bankers Association fixing of 3-month LIBOR on the contract settlement date. For example, if 3-month LIBOR sets at 5.00% on the contract settlement date, the contract settles at a price of 95.00.[10]
How the Eurodollar futures contract works
For example, if on a particular day an investor buys a single three month contract at 95.00 (implied settlement LIBOR of 5.00%):- if at the close of business on that day, the contract price has risen to 95.01 (implying a LIBOR decrease to 4.99%), US$25 will be paid into the investor's margin account; or
- if at the close of business on that day, the contract price has fallen to 94.99 (implying a LIBOR increase to 5.01%), US$25 will be deducted from the investor's margin account.
Eurodollar futures contract as synthetic loan
A single Eurodollar future is similar to a forward rate agreement to borrow or lend US$1,000,000 for three months starting on the contract settlement date. Buying the contract is equivalent to lending money, and selling the contract short is equivalent to borrowing money.Consider an investor who agreed to lend US$1,000,000 on a particular date for three months at 5.00% per annum (months are calculated on a 30/360 basis). Interest received in 3 months' time would be US$1,000,000 × 5.00% × 90 / 360 = US$12,500.
- If the following day, the investor is able to lend money from the same start date at 5.01%, s/he would be able to earn US$1,000,000 × 5.01% × 90 / 360 = US$12,525 of interest. Since the investor only is earning US$12,500 of interest, s/he has lost US$25 as a result of interest rate moves.
- On the other hand, if the following day, the investor is able to lend money from the same start date only at 4.99%, s/he would be able to earn only US$1,000,000 × 4.99% × 90 / 360 = US$12,475 of interest. Since the investor is in fact earning US$12,500 of interest, s/he has gained US$25 as a result of interest rate moves.
- In an actual loan, the US$25 per basis point is earned or lost at the end of the three-month loan, not up front. That means that the profit or loss per 0.01% change in interest rate as of the start date of the loan (i.e., its present value) is less than US$25. Moreover, the present value change per 0.01% change in interest rate is higher in low interest rate environments and lower in high interest rate environments. This is to say that an actual loan has convexity. A Eurodollar future pays US$25 per 0.01% change in interest rate no matter what the interest rate environment, which means it does not have convexity. This is one reason that Eurodollar futures are not a perfect proxy for expected interest rates. This difference can be adjusted for by reference to the implied volatility of options on Eurodollar futures.
- In an actual loan, the lender takes credit risk to a borrower. In Eurodollar futures, the principal of the loan is never disbursed, so the credit risk is only on the margin account balance. Moreover, even that risk is the risk of the clearinghouse, which is considerably lower than even unsecured single-A credit risk.
Other features of Eurodollar futures
40 quarterly expirations and 4 serial expirations are listed in the Eurodollar contract.[11] This means that on January 1, 2011, the exchange will list 40 quarterly expirations (March, June, September, December for 2011 through 2020), the exchange will also list another four serial (monthly) expirations (January, February, April, May 2011). This extends tradeable contracts over ten years, which provides an excellent picture of the shape of the yield curve. The front month contracts are among the most liquid futures contracts in the world, with liquidity decreasing for the further out contracts. Total open interest for all contracts is typically over 10 million.The CME Eurodollar futures contract is used to hedge interest rate swaps. There is an arbitrage relationship between the interest rate swap market, the Forward Rate Agreement market and the Eurodollar contract. CME Eurodollar futures can be traded by implementing a spread strategy among multiple contracts to take advantage of movements in the forward curve for future pricing of interest rates.
Sweeps
In United States Banking, Eurodollars are a popular option for what are known as "sweeps". By law,[12] banks aren't allowed to pay interest on corporate checking accounts. To accommodate larger businesses, banks may automatically transfer, or sweep, funds from a corporation's checking account into an overnight investment option to effectively earn interest on those funds. Banks usually allow these funds to be swept either into money market mutual funds, or alternately they may be used for bank funding by transferring to an offshore branch of a bank.
As Markets Become Unravelled


Credit Trumps Equities
from Macrostory blog:
Credit markets are truly forward looking. Equity not so much. History clearly shows credit should never be ignored. There have been three large divergences between equity and credit since the late 90′s and each time credit forced the hand of equity.
Here we are once again on the eve of a possible breakout in the entire treasury curve to new all time highs (low yields). History does have a way of repeating when it comes to the capital markets.
Below is a 15 year comparison of the 10 year yield and the SPX. Also note the orange circles outlining that huge head and shoulder’s pattern on the SPX that has taken a decade to form. In the words of the Dos Equis man “stay thirsty my friends.”

Sunday, January 15, 2012
Overnight Long/Intraday Short Gold Fund More Than Doubles In Just Over A Year: Generates 43% Annualized Return
The PM gold fix occurs at 3 pm London time (8 am MST) and the AM gold fix occurs at 10:30 am London time (3:30 am MST)
from Zero Hedge:
Back in August 2010, we presented an idea proposed by our friends at SK Options trading for a very simple trading strategy: being long gold in the overnight session, and shorting it during the day. At the time of writing, such a strategy would have returned $2.16 billion from a $100 million initial investment in 10 years, a 37.46% annualized return. Today, we provide a much needed follow up to this quite stunning divergence. As SK notes: "we have revisited the article and written an update. Not only does the discrepancy still exist but it has been actually increasing. That fund would now be worth $5.26B, way up from $2.16B when we last wrote about it - in other words an increase of 143% in just over a year. When we wrote about this in August 2010, the annualized return of the Long Overnight/Short Intraday gold index was 37.46% since the start of 2001. However if we measure from now the annualized return since 2001 is 43.24%, with the annualized return of the Long Overnight/Short Intraday gold index standing at roughly 64.4% since 2009." So for those who wish to layer on an additional alpha buffer on top of what is already the best performing asset of the past decade, the SK Options way just may be the strategy. As for the reasons for this gross arbitrage - who cares. Is it manipulation? is it the early Asian buying offset by London pool selling? It is largely irrelvant - the point is that this is "the divergence that keeps on giving" - kinda like a Stolper trade, or an inverse Tilson ETF, and until it doesn't, or until something dramatically changes in the precious metal market, it is likely that this trading pattern will continue for a long time.
From SK Options trading
Revisiting Our Proposal For An Overnight Gold Fund

In August 2010 we wrote an article entitled “Proposing An Overnight Gold Fund” in which we explored the potential for launching a fund that held long positions in gold overnight and was short gold during the day. We pointed out that “a hedge fund starting in 2001 with $100m, with the strategy of being long gold from the PM to AM fix, and short gold from the AM to PM fix...would be worth $2.16billion today, before any fees and expenses.” We have been monitoring this trading strategy since then and therefore would like to take this opportunity to update readers on its astonishing progress.
Firstly we will introduce the thinking that led us to investigate this trading strategy. There is much debate within the precious metals industry regarding the alleged suppression, or at least manipulation to an extent, by either central banks or the proprietary trading divisions of large banks, or a combination of the two.
In April 2010 the US Commodity Futures Trading Commission CFTC fined Hedge Fund Moore Capital for manipulation of the New York platinum and palladium futures market, as the firm was found to be “banging the close”, which involves entering orders in a manner designed to inflate the closing price, which other various derivatives contracts could be based on. So that is irrefutable evidence that the precious metals futures market is, at least to some extent, being manipulated. However a large concentration of this debate is based not on platinum and palladium, but on gold and silver, and particularly gold.
There are other theories that could explain this discrepancy that do not involve manipulation. For example one could take the view that Eastern market participants are perhaps more bullish on gold than their Western trading counterparts. Therefore gold is perhaps more likely to rise during Asian trading and fall when the west takes over.
Numerous hypothesises have been put forward as to the motive behind alleged suppression of the gold, ranging from a central bank conspiracy to keep gold prices low, to large trading banks simply exploiting their market dominance for easy profits, or even a combination of the two with the central banks and large bullion trading operations working together in some kind for cartel to keep gold prices low. This article does not intend to discuss the merits of these theories, however plausible or implausible various parties believe them to be. Instead we will focus on finding out if a discrepancy exists and if it does, can one take advantage of it and use it for profitable trading strategies.
We would like to recommend an excellent article by Adrian Douglas, editor of Market Force Analysis and a GATA board member entitled “Gold Market is not “Fixed”, it’s Rigged” which goes into great detail on the statistics behind the difference between how gold trades between the AM and PM fix, and how it trades from the PM to AM fix. The very fact that there appears to be a significance difference sets our alarm bells ringing. Whether gold trades in New York, London, Tokyo or Timbuktu, gold is still gold and so one would expect that it would trade in a similar fashion across these timeframes over a long period of time.
If we take the change in the gold price from the London AM to PM fix (intraday gold) compare it to the change in the gold price from the PM to AM fix (overnight gold), we can see the startling difference between the two periods of trading. We will demonstrate this by showing what would have happened if one had theoretically invested in the intraday gold market from 2001 to present.
Starting in 2001 with an indexed based at 100, the chart below shows what would have happened to that investment of 100 if it had been used to purchase gold at the AM fix and sell gold at the PM fix, replicating the daily percentage performance of gold in the intraday market.

As the chart above shows, the performance is dismal. For example a hypothetical gold investment fund starting with $100m in 2001, and using it to buy gold at the AM fix and sell it at the PM fix would now be left with just $31 million, almost a 70% loss in just under ten years. Over the same time period gold prices have risen over 590%.
From this we can infer that in fact it was possible to make money shorting gold everyday for the last decade or so. If a hedge fund or even an individual trader were to have sold gold at the AM fix and covered that short position at the PM fix, for each day of this terrific bull market run in gold, that fund would have almost tripled their starting capital.

This appears to be a remarkable result, as one would presume that shorting gold everyday during a period where the yellow metal has risen 590% would have devastated any portfolio, not caused a 178.7% increase. Those who do not believe in theories of gold price suppression, often cite the fact that gold prices are at an all time high as a major piece of evidence to discredit any suggestions of price suppression. After all how can the price be being suppressed if prices are sky rocketing?
Well the answer to that question is that if the gold traders at the large banks accused of such manipulation are just trading during the intraday market between the AM to PM fix, they may not be too concerned about how gold trades overnight (provided they are not holding positions overnight of course). What matters is how gold trades during this intraday period, and if more often than not gold is falling during this time, and more often than not the banks are short gold during this period, then they are making money regardless of the overnight price action.
It would appear that subtle manipulation is more likely that blatant price suppression.
So the question on the mind of many gold bulls might be; how do I remove this downward manipulation during the intraday period? Even if I do not believe in manipulation, suppression or any other conspiracy theories, how do I eliminate this statistical fact that gold is underperforming during the intraday period?
The answer is to buy gold at the PM fix and sell it the following day at the AM fix, or more simply put, just be long gold overnight.

The graph above shows how rewarding this strategy would have been, with a return of 1797% in eleven years, a return 3.2 times greater than the 590% that would have been made simply buying gold in 2001 holding until now. With many investors and traders looking for the best way to lever their gold returns, from pouring over drill results to identify the best gold stocks to experimenting with leveraged gold ETFs and ETNs, a more simple solution could be simply to only have long exposure to gold overnight.
For the more cavalier traders, going long gold overnight and then short gold for the intraday period, makes for an even more profitable strategy.

Consider a hedge fund starting in 2001 with $100m, with the strategy of being long gold from the PM to AM fix, and short gold from the AM to PM fix. That hedge fund would be worth $5.26billion today, before any fees and expenses. This should be enough to catch any investor’s attention. Even without shorting gold during the intraday period, limiting exposure to gold to just the overnight period enhances returns enough to justify using this as a basis for a trading strategy.
As stated at the beginning of this article, our focus is not what or who is causing this discrepancy nor any potential motives for such a discrepancy, but what action to take in order to profit from it.
What has surprised us most in our ongoing investigation into this area is that not only is the discrepancy persisting, but it is arguably increasing. When we first wrote about this in August 2010, the annualized return of the Long Overnight/Short Intraday gold index was 37.46% since the start of 2001. However if we measure from now the annualized return since 2001 is 43.24%. the chart below demonstrates this point, with the annualized return of the Long Overnight/Short Intraday gold index standing at roughly 64.4% since 2009.

Another point of interest is when this outperformance is concentrated. The performance around the September 2011 correction is particularly remarkable. Whilst gold prices plummeted, the Long Overnight/Short Intraday gold index increased dramatically, having already been increasing whilst gold rallied over the previous couple of months.

From this we can infer that the majority of gold’s declines in the recent major correction occurred during the intraday trading session, not the overnight trading session.
However in practice we must keep in mind that reversing one’s position each day is not free. One would have to cross the bid/ask spread. Taking a $0.10 spread into account the short intraday and long overnight index would have increased from 100 to 1827.34 since 2001. This increase of 1727.4% outperforms the 593% increase in gold prices over the same period by almost 3 times. If a $0.20 spread is used on a short intraday and long overnight index, there is an increase of 530.4%, which slightly underperforms a buy and hold strategy. Therefore one would need to be able to reverse one’s position at the AM and PM fix for $0.10 spread for the strategy to work in practice.
Nonetheless we still think that this is an important discrepancy that should be taken into account when trading gold. Even if one does not explicitly execute this exact trading strategy, one can still benefit from the trading patterns it is based on. For example if one was nervous about a correction in gold prices but did not want to be short gold, it would perhaps be preferable to close any long position prior to the intraday trading period and reopen them after the PM fix.
In addition to incorporating these patterns into our trading strategy at SK Options Trading, we are also looking into the feasibility of launching some form of investment fund to take advantage of the opportunities discussed in this article. As part of this feasibility study we are looking to gauge investor interest and so would welcome any comments, suggestions or ideas that people may wish to contribute, simply email info@skoptionstrading.com.