
![]()
|
 |


July 9, 2012 What if the Fed Throws a QE3 and Nobody Comes?
John P. Hussman, Ph.D.
All rights reserved and actively enforced.
Reprint Policy
The financial markets were largely unresponsive to
news of further easing by the European Central Bank, the Bank of
England, and the People’s Bank of China last week. Notably, Spanish
bonds plunged, while German short-term government bonds now yield
-0.17%, indicating growing concern about sovereign default risk in the
Euro area. Every few days will undoubtedly bring word of new
“agreements” and “mechanisms” – arcane enough to mask their futility –
that promise to solve the European crisis. The headwinds remain very
strong. The key distinction here remains liquidity versus solvency.
There is little doubt that liquidity will be provided at every
opportunity, though the continual degrading of collateral standards by
the ECB suggests that all the good collateral has been pledged already.
More importantly, with a global recession visibly unfolding, solvency
risk will only increase.
The odds remain against European countries
agreeing to the surrender their national sovereignty to the extent
needed to create a “fiscal union” and enable massive and endless
transfers of public resources from stronger to weaker European
countries. Barring a catastrophe severe enough to either prompt
European countries to hand fiscal control to a central administrator,
or to prompt Germany to agree to unconditional bailouts, the least
disruptive move would be for Germany and a handful of stronger countries
to leave the Euro first, and allow the remaining members to inflate as
they wish.
With regard to the economy, I noted two weeks ago
that the leading evidence pointed to a further weakening in employment,
with an abrupt dropoff in industrial production and new orders. Mike Shedlock
reviews the litany of awful figures we’ve seen since then, focusing on
the new orders component of global purchasing managers indices: U.S.
manufacturing new orders and export orders plunging from expansion to
contraction, Eurozone new export orders plunging (only orders from
Greece fell at a faster rate than those of Germany), and an
accelerating decline in new orders in both China and Japan.
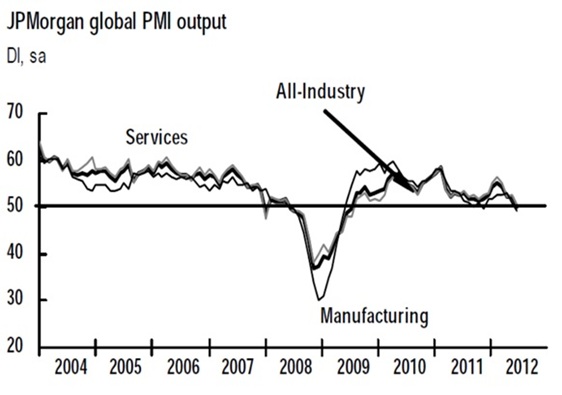
Recall that the NBER often looks for “a
well-defined peak or trough in real sales or industrial production” to
help determine the specific peak or trough date of an expansion or
recession. From that standpoint, the sharp and abrupt decline we’re
seeing in new orders is a short-leading precursor of output. As the
chart below of global output suggests, I continue to believe that we
have reached the point that delineates an expansion from a new
recession.
On the employment front, Friday’s disappointing
report of 80,000 jobs created in June may be looked on longingly within
a few months, as we continue to expect the employment figures to turn
negative shortly. That said, it remains important to focus on the joint
action of numerous data points, rather than choosing a single figure
as an acid test. I noted last week in Enter, the Blindside Recession, GDP and employment figures are subject to substantial revision. Lakshman Achuthan at ECRI has observed the first real-time
negative GDP print is often seen two quarters after a recession
starts. Earlier data is often subsequently revised negative. As for the
June employment figures, the internals provided by the household
survey were more dismal than the headline number. The net source of job
growth was the 16-19 year-old cohort (even after seasonal adjustment
that corrects for normal summer hiring). Employment among workers over
20 years of age actually fell, with a 136,000 plunge in the 25-54
year-old cohort offset by gains in the number of workers over the age of
55. Among those counted as employed, 277,000 workers shifted to the
classification “Part-time for economic reasons: slack work or business
conditions.”
What if the Fed throws a QE3 and nobody comes?
To date, the stock market has largely shrugged off
the evidence of oncoming recession, in the confidence that the Federal
Reserve will easily prevent that outcome and defend the market from
any material losses. On that point, it is helpful to remember that the
real economic effects of Fed actions in recent years have been limited
to short-lived bursts of pent-up demand over a quarter or two. Not
surprisingly, as interest rates are already low, and risk-premiums on
more aggressive assets are already remarkably thin, the impact of
quantitative easing around the globe continues to show evidence of
diminishing returns.
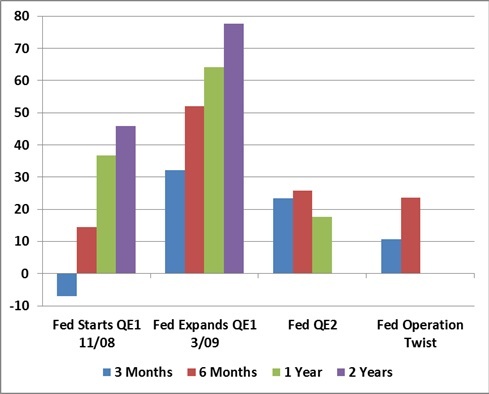
With the help of some preliminary work from Nautilus Capital,
the following charts present the market gains, in percent, that
followed versions of quantitative easing by the Federal Reserve, the
European Central Bank, and the Bank of England on their respective
stock markets (measured by the S&P 500, the Dow Jones EuroStoxx
Index, and the FTSE Composite, respectively). In order to give QE the
greatest benefit of the doubt and account for any “announcement
effects,” the advances in each chart are based on the 3-month, 6-month,
1-year and 2-year gains in each index following the initiation of the
intervention, plus any amount of gain enjoyed by the market from its lowest point in the 2 months preceding the actual intervention. The effects of most interventions would look weaker without that boost.
Remember that quantitative easing “works” through
central bank hoarding of long-duration government bonds, paid for by
flooding the financial markets with currency and reserves that
essentially bear no interest. As a result, investors in aggregate have
more zero-interest cash, and feel forced to reach for yield and
speculative gains in more aggressive assets. Of course, in
equilibrium, somebody has to hold the cash until it is
actually retired (in aggregate, “sideline” cash can’t and doesn’t “go”
anywhere). Increasing the quantity simply forces yield discomfort on
more and more individuals. The process of bidding up speculative assets
ends when holders of zero-interest cash are indifferent between
continuing to hold that cash versus holding some other security. In
short, the objective of QE is to force risky assets to be priced so
richly that they closely compete with zero-interest cash.
Understanding this dynamic, it follows that QE
will have its greatest impact on financial markets when interest rates
and risk-premiums have spiked higher. If interest rates are low
already, and risky assets are already priced to achieve weak long-term
returns (we estimate that the S&P 500 is likely to achieve total
returns of less than 4.8% over the coming decade), there is not nearly
as much room for QE to produce a speculative run. Leave aside the
question of why this is considered an appropriate policy objective in
the first place, given the extraordinarily weak sensitivity of GDP
growth to market fluctuations. The key point is this – QE is effective
in supporting stock prices and driving risk-premiums down, but only
once they are already elevated. As a result, when we look around the
globe, we find that the impact of QE is rarely much greater than the
market decline that preceded it.
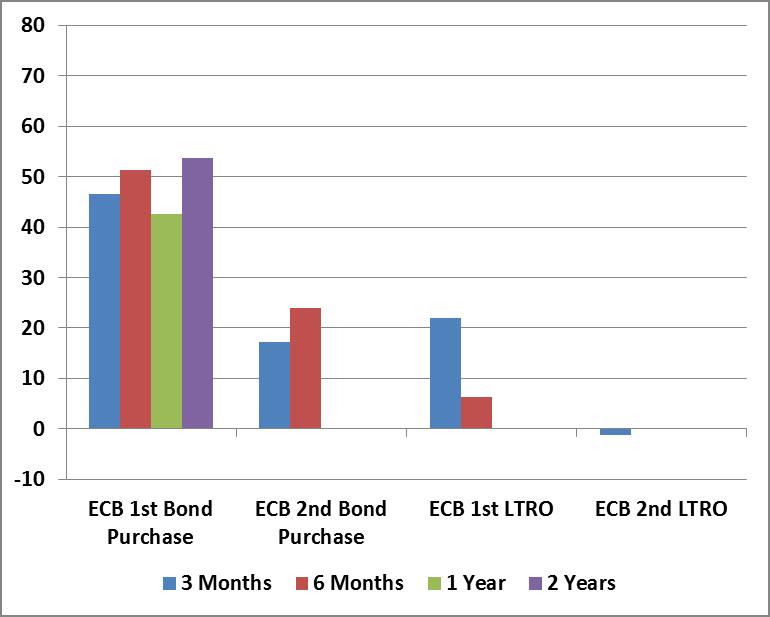
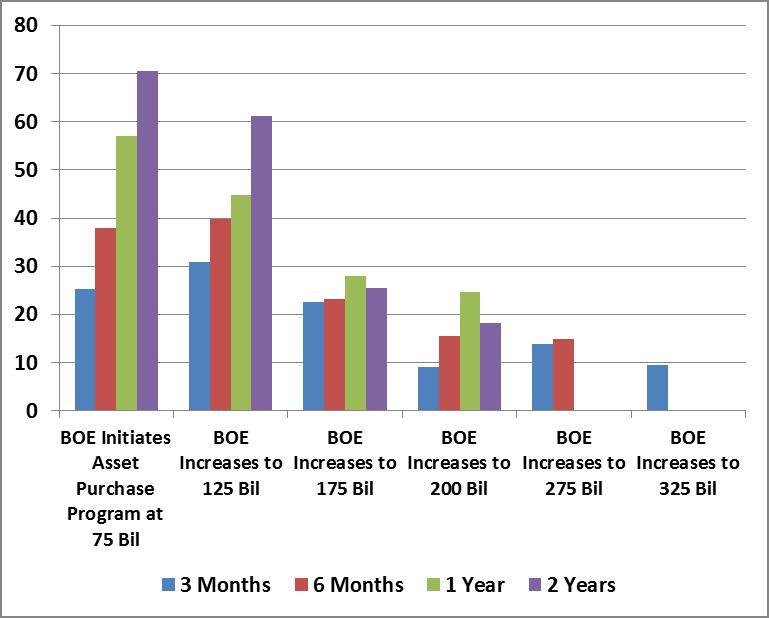
To illustrate, each of the Fed, ECB and BOE
quantitative easing interventions since 2008 are presented below as a
timeline. The shaded area shows the amount of market gain that would be
required to recover the peak-to-trough drawdown experienced by the
corresponding stock index (S&P for Fed interventions, EuroStoxx for
ECB interventions, FTSE for BOE interventions) in the 6-month period preceding
the quantitative easing operation. The lines plot the 3-month, 6-month,
1-year and 2-year market gain following each intervention, adding any
gain from the low of the preceding 2 months, to account for any
"announcement effects." Technically, the lines should not be connected,
since they represent the gains following distinct actions of different
central banks, but connecting the points shows the clear trend toward
less and less effective interventions, with the most recent
interventions being flops. Notice also that central banks have typically
initiated QE interventions only when the market had somewhere in the
area of 18% or more of ground to make up.
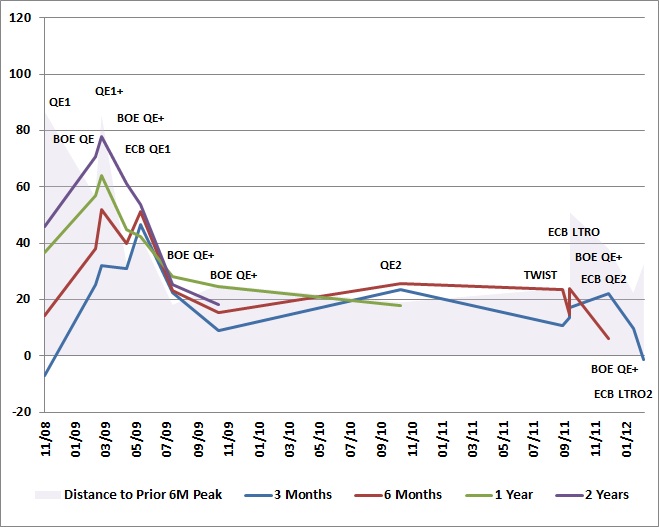
Of all the experiments with QE, the round of QE2
from late-2010 to mid-2011 was most effective, in that stocks recovered
their prior 6-month peak, and even some additional ground. Yet even
with QE2, the Twist and its recent extension, as well as liquidity
operations such as dollar swaps and so forth, the S&P 500 is again
below its April 2011 peak, and was within 5% of its April 2010 peak
just a month ago (April 2010 is a particularly important reference for
us, since that is that last point that the ensemble methods we
presently use would have had a significantly constructive market
exposure). The largely sideways churn since April 2010 reflects
repeated interventions to pull a fundamentally fragile economy from the
brink of recession, and recessionary pressures are stronger today than
they were in either 2010 or 2011. Investors seem to be putting an
enormous amount of faith in a policy that does little but help stocks
recover the losses of the prior 6 month period, with scant evidence of
any durable effects on the real economy.
In short, the effect of quantitative easing has diminished substantially since 2009, when risk-premiums were elevated
and amenable to being pressed significantly lower. At present,
risk-premiums are thin, and the S&P 500 has retreated very little
from its April 2012 peak. My impression is that QE3 would (will) be
unable to pluck the U.S. out of an unfolding global recession, and that
even the ability to provoke a speculative advance in risky assets will
be dependent on those assets first declining substantially in value.


