Friday, September 28, 2012

Stocks Decline on Economic Weakness

from Bloomberg:

Stocks Drop on Economy Data as Gasoline Jumps on Supplies

U.S. stocks extended their worst weekly decline since June, while the dollar and Treasuries rose, as reports showed weakening economic growth. Gasoline surged on concern about tighter supplies in the U.S. East Coast.
The Standard & Poor’s 500 Index slipped 0.4 percent to 1,440.91 at 2:32 p.m. in New York and is down 1.3 percent this week...
Benchmark U.S. stock indexes extended weekly declines as the Institute for Supply Management-Chicago Inc. said its business barometer fell to 49.7 this month from 53 in August. A reading of 50 is the dividing line between growth and contraction.

Wednesday, September 26, 2012

Tuesday, September 25, 2012

What If the Fed Has It Wrong?

This was sent out by John Mauldin, by far my favorite economic analysts!

By Denis Ouellet
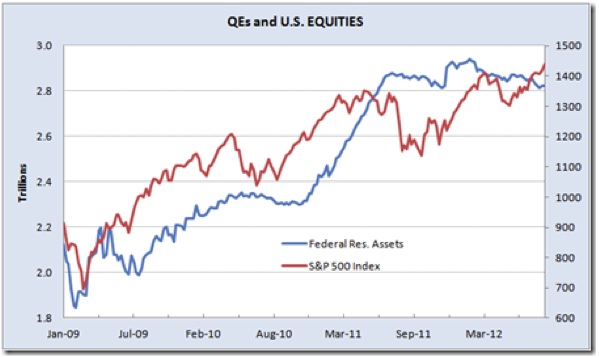
This is the 4th major intervention from the Fed since 2009, each one apparently inflating asset prices without having a definitive impact on the economy other than, most importantly, preventing a lethal debt-deflation spiral.

The chart above is used extensively to illustrate the close relationship between QEs and equity prices. Hence investors' Pavlovian reaction to last week's FOMC announcement of an open-ended and unlimited money printing program. Virtually every asset class rose, giving credence to Ben Bernanke's attempt to create a stimulating wealth effect.
What if the Fed has it all wrong?
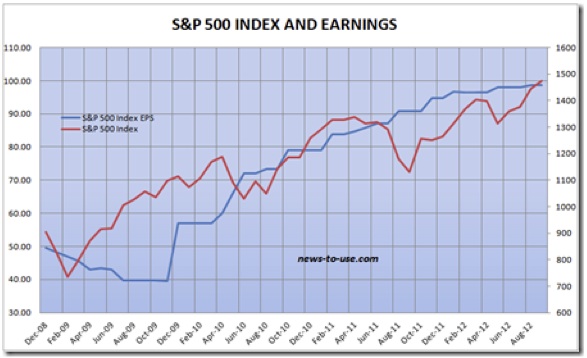
Correlation does not imply causation. Could there be another reason for the spectacular rise in equity prices since 2009? Let's try earnings, just in case that intuitive, time-tested, relationship might still be working:

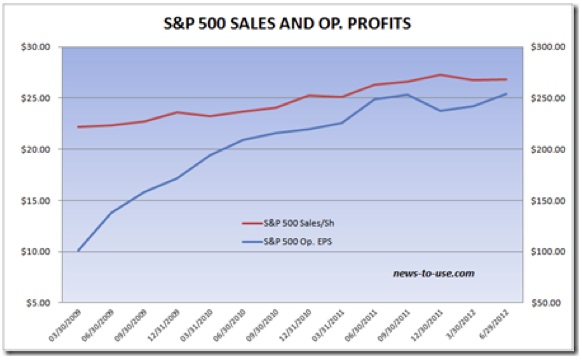
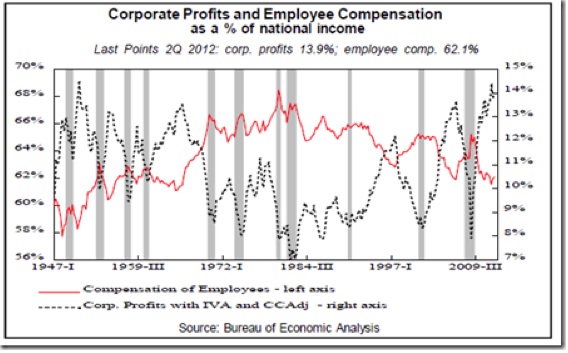
If there were a direct link between QEs and corporate profits, it should be apparent in S&P 500 company revenues. Yet, Index sales have only grown 16.5% during the last 3.5 years, nothing close to the 60% jump in Fed assets. Given that the Fed is now totally focused on growing employment, I doubt that it would take credit for the spectacular jump in profit margins since 2009, since most of it emanated from cost cutting (mostly labor) and rising productivity.

Some recent facts point to weaker earnings ahead:
•  Quarterly sales and earnings have peaked in the last 9-12 months.
•  Corporate profit margins are at an all-time high.

It is therefore dangerous to assume that margins will expand any further. From now on, corporations need to increase sales in order to grow their earnings. Unfortunately, demand is waning.
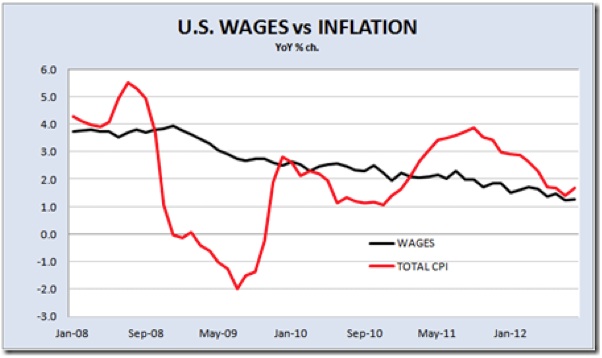
American wages, currently at a 50-year low as a percentage of GDP, are rising very slowly, so slowly that it is hampering consumer spending and the overall economy. At the time of previous QEs, also designed to create a wealth effect, wages were rising at a much faster clip than today. Furthermore, real wages were rising during 2009 and 2010, partly offsetting slow employment growth.

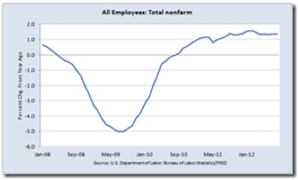
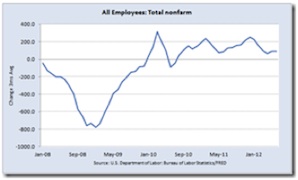
Today, employment growth remains below 1.5% YoY, a rate insufficient to reduce unemployment. Nominal wages are growing 1.2% while inflation is 1.7% and threatens to accelerate, in large part due to the impact that the Fed's actions are having on commodity prices, particularly oil prices.
 
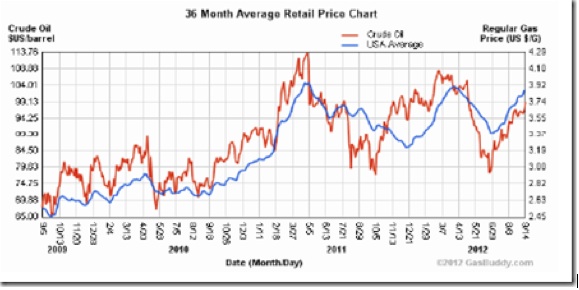
The US economy got lucky in 2011, when gasoline prices dropped 18% to $3.20/gal. just in time for the back-to-school season and Christmas. It's luck extended into 2012, when the U.S. experienced an extraordinarily warm winter. Unless something else extraordinary happens soon (SPR releases?), the exact opposite will happen to oil prices. Gasoline has jumped 16% since July, adding to the squeeze just as we enter the most important shopping period of the year (chart below from gasbuddy.com).

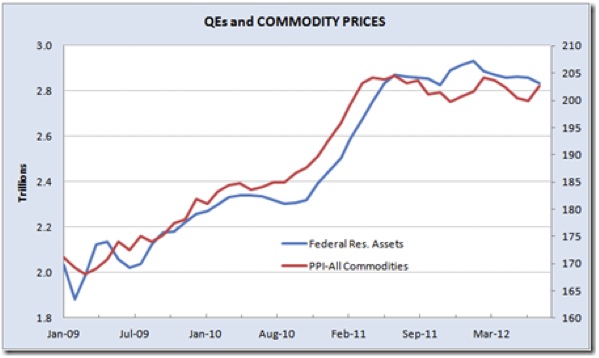
The following chart plots the Fed's printing with commodity prices. Unlike the relationship with equity prices, it is difficult to find anything other than excess financial liquidity to explain the spectacular rise in commodity prices. Considering how world economies have been doing lately, why is it that commodity prices have not declined significantly?

The Fed's balance sheet is set to grow another $800 billion by the end of 2013, the same amount it has increased since 2009, a period during which commodity prices jumped 20%.
The Fed wants to grow employment faster, but jobs don't grow out of thin air. Corporations create jobs when they have the means, they see a need, and there is visibility to commit. Needless to say, the last two conditions are far from being met these days. The Fed can't offset negative US politics, the European mess, nor the Chinese slowdown.
Bringing mortgage rates down further might help the slowly recovering housing sector and restart construction employment, but low wages and rising inflation remain a problem that might be perversely aggravated by the very actions the Fed is taking.
Wages are not about to accelerate, but inflation and taxation are problematic. If the American consumer can't spend, who will provide the needed spark?

Higher P/E Ratios to the Rescue?

Earnings have stalled, corporations are cutting guidance, and analysts are busy revising their estimates downward. Q3'12 estimates have been cut 8% since March and are now below Q2 earnings, which are themselves coming in much lower than originally expected. Q3 earnings are now seen down YoY.
If so, trailing 12-month EPS peaked last quarter and will decline in Q3. The earnings tailwind has disappeared.
There have been eight periods since 1935 when equities have risen in the face of declining earnings (see Banking [Betting] On Bankers?). In all cases, inflation declined along with earnings.
The dependable Rule of 20 says that "Fair trailing P/E = 20 minus inflation." Lower inflation begets higher P/Es. A fair P/E is thus 18.3 at the current 1.7% inflation level, 23% above the current 14.8x P/E, pointing to 1800 as fair value on the S&P 500, based on trailing EPS of $98.69. If this undervaluation is narrowed by the liquidity pumped out by the Fed, could it create enough wealth effect to push US consumers into a spending spree, in spite of negative real labor income growth?
The problem with Bernanke's wealth effect thesis lies with the new reality in America. Income and assets have lately been so significantly redistributed that only a tiny few actually feel a wealth effect from rising equity prices. Here are some sad facts:
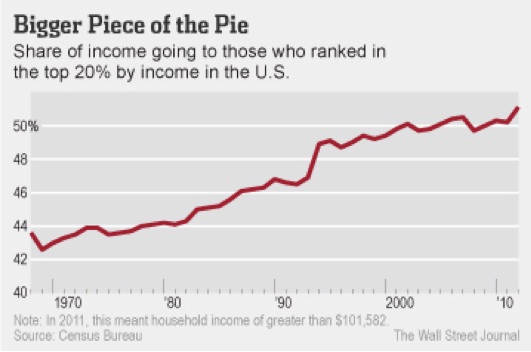
•  Last year, the top 20% of households took in 51.1% of all income in 2011, up from 50.2% in 2010 and the highest share since at least 1967, according to the Census Bureau. After the top, each quintile of income earners saw their share of income decrease, with the biggest drop among middle-income earners. The middle fifth of households took in 14.3% of all income last year. (WSJ)

•  In 2007, the top 20% of income earners had 53% of their financial holdings in stocks (directly and indirectly), down from 59% in 2001. Middle-income earners had 38% of their financial assets in stocks in 2007, down spectacularly from 47% in 2001.
•  Stock holdings have obviously declined since 2007:

•  US house values remain 30% below their 2006 peak level and now match their 2003 level.
•  Total residential mortgage debt has only declined 7.5% since 2008. Some 1.5 million homes are in foreclosure, but 10.8 million homes remain in negative equity.
The "wealthy few" may feel wealthier if stocks advance, but they could nevertheless have much less after-tax income to spend when politicians finally address the looming fiscal cliff nestled within the rapidly growing mountain of debt.
Keep in mind that it is these wealthy people who run American corporations, keeping them lean and mean and flush with cash. They remember how profits literally disappeared in 18 months in 2007-08. They remember how financial markets totally froze in 2008. They see the humongous budget deficits and the debt piling on, and the not-so-distant day of reckoning. They realize that all the Qes in the world can't offset inept and irresponsible politicians on either side of the Atlantic. Yet, they are the ones targeted by the so-called wealth effect!
Call that pushing on a golden string.
Meanwhile, the less affluent, the other 80% – some 250 million people – are little concerned by an eventual wealth effect but highly, directly, and immediately  impacted by the side effects of all these QEs, namely rising commodity prices and near-zero interest rates. Consider that:
•  15% of the US population lives in poverty.
•  44% of those 46.2 million poor Americans are in "deep poverty," which is half the level of the poverty line, defined as $22,811 for a family of four.
•  More than 45 million Americans are in the food-stamps program, which is 15% of the population, compared with the 7.9% participation from 1970-2000. Food-stamps enrollment has been rising at a rate of 400,000 per month over the past four years. Just last month (August), nearly twice as many people went on the food-stamps program (173,000) than managed to find a new job (96,000).
•  More than 11 million Americans are collecting federal disability checks.
•  11.2% of the labor force is out of work, if we include the 7 million people no longer seeking employment. This number (over 17 million workers) is unchanged since 2009.
•  Full-time employment remains 1.4 million below its 2009 level. Needless to say, part-timers earn and spend considerably less.
•  Most of the 43.5 million American retirees must cope with nominal interest rates, near zero through 2015, when inflation is around 2.0%.
Call that pushing on a chafed string.

Betting on Bankers?

Now that US and European central banks have delivered the financial heroin needed to compensate for inept and irresponsible politicians, should we jump back in equities?
Will professional investors drive equities higher?
The risk here is that, much like businesspeople, investors may remain cautious, given the numerous and highly complex difficulties the US and the world are facing. They will also consider that, at the time of previous QE program launches, equity markets were similarly undervalued, but many economic trends were then more positive:
•  Earnings were in a strong uptrend on rising margins.
•  Oil prices were much lower.
•  US real wages were rising (not in 2011).
•  The 2011-12 winter was one of the mildest on record in the US.
•  Europe was not in recession.
•  China was still growing strongly.
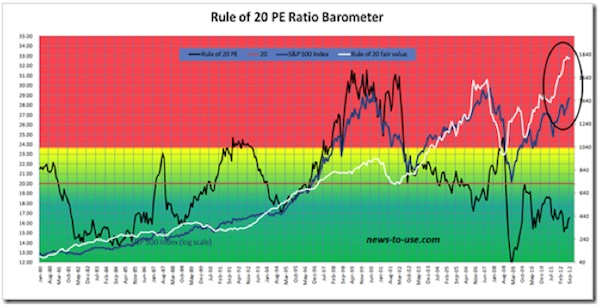
Interestingly, the undervaluation of equities, as measured by the Rule of 20, narrowed from 40% to 0% during QE1, from 23% to 7% during QE2, and from 19% to 14% during Operation Twist (see the black line in chart below). The recent rally has narrowed the undervaluation from 27% to 19%. It would be very surprising if we got near fair value anytime soon. If 10% undervaluation (average of QE2 and OT) is the best we can hope for, the resulting 16.5 P/E (90% of 20 minus 1.7% inflation) brings the S&P 500 to 1625, just about 10% above current levels.

That assumes that inflation stays constant at 1.7% YoY. However, gasoline prices are +7% YoY in September, after rising 1.8% in August.. If they remain unchanged until year-end, gas prices will be +18% YoY. Not only would that considerably disrupt Christmas sales, it would also help raise inflation (gasoline is 5.5% of the CPI, energy is 9.7%). If inflation rises to 2.0%, a 10% undervaluation would get the S&P 500 Index to 1565, a mere 6% above current levels.
If the Fed has it all wrong, simply pushing on golden or chafed strings, and the only effect of QE3 is to boost inflation, only God(ot) knows what will happen.
While the Fed waits for the wealth effect to take effect, the European Central Bank is also waiting for its own Godot, following Draghi's magic with the ECB rules and regulations. Super Mario's "whatever it takes" promise is powerful but not without pitfalls:
•  When, if ever, will the eurozone achieve the necessary banking and fiscal unions?
•  Will Spain and Italy surrender before it is too late?
•  Will ever more austerity finally work?
•  When will the debt spiral stop?
•  How much longer will the Germans put up with the situation, accepting that the ECB ruins its balance sheet by taking on unlimited risk on behalf of the German taxpayers, risking their fiscal sovereignty to save the "reckless Southerners"?
•  How much longer will the hordes of unemployed young Europeans put up with the situation?
Central bankers have indeed delivered. In truth however, they are merely experimenting with totally unproven ways and means, hoping to gain enough time until more responsible politicians emerge. Given the significant risks still facing us until Godot shows up, investors should await more evidence that either earnings will resume their uptrend or some kind of miracle will happen.
Equity holdings should be trimmed to conservative levels. Sustainable income should be favored. Cash earns essentially nothing but is safe for now. Gold remains attractive for many, many obvious reasons.

Monday, September 24, 2012

Confidence Collapse

I read last night that "Import and Export volumes for China, US, Japan, and Europe are starting to drop notably." (Zero Hedge)
Now, business confidence in Europe's strongest economy is falling also. Only in the delusional and deceived USA does confidence improve, despite terrible economic conditions.


Friday, September 21, 2012

More People Finding Food Stamps Than Jobs

An alarming data point from the minority side of the Senate Budget Committee: More Americans are being added to food stamps than are finding jobs. The data is detailed in this chart, provided by the committee:

As the chart shows, between April-June 2012 (the most recent three month block for which government data is available), only 200,000 jobs have been created while 265,000 individuals have been added to the food stamp rolls. Additionally, in that time period, 246,000 workers were awarded disability.
Another chart shows that the last three month block is part of a larger trend. The chart, also from the minority side of the Senate Budget Committee, shows that "Workforce Shrinks Since January 2009 While Millions Sign Up For Disability And Food Stamps."

As the chart shows, since January 2009, when President Barack Obama took office, the net change jobs has been negative (-1.3 million), while 5.7 million workers and dependents have been awarded disability and a whopping 15.1 million have been added to the food stamp rolls.
"A total of 46,670,373 Americans are now on food stamps," according to the minority side of the Senate Budget Committee. "The food stamp program has doubled in size since 2008 and quadrupled since 2001."
And the government program isn't cheap: "Spending on food stamps alone is projected to reach $770 billion over the next decade."

Thursday, September 20, 2012

Stocks Modestly Lower on Weak Economic Data

from WSJ:

NEW YORK—Stocks opened lower on signs of global economic weakening, as the U.S. posted worse than expected labor-market data...

Initial claims for jobless benefits in the latest week declined slightly from the previous week, to 382,000. That was a smaller drop than expected by economists, who expected a decline to 373,000.
"The data points to the fact that we're in a below-average, painfully sluggish economy," said Hank Smith, chief investment officer of Haverford Trust, a Radnor, Pa.-based firm with $6.5 billion under management. "The market has come a long way recently, so it wouldn't be surprising for it to take a pause here."

PMI data for China and Europe showed contraction also. However,  the Dow is down only about 20 points. Wall St is pricing stocks for a miracle in Q3 and Q4.

Monday, September 17, 2012

Stocks Barely Blink As Empire Manufacturing Plunges

from Zero Hedge:

Today's horrible piece of news, which at least on the surface was supposed to send the market soaring, comes courtesy of the Empire Fed Manufacturing Index, which printed at -10.41, the lowest print since April 2009, down from -5.85, and well below expectations of -2.0. The Index print confirmed the biggest 6 month drop since records began. The components painted a dire picture for jobs, with the employment index sliding from 16.47 to 4.26, New Orders tumbling from -5.50 to -14.03, while, wait for it, prices rose, from 16.47 to 19.15. Re-stagflation here we come. Market for now seems confused - since QE is priced into infinity, it is unclear if this latest datapoint confirming a recessionary economy, QE can't be more-er infiniter. Best to not respond to this, or any other macro news at all, which is precisely what the market has done. For those who missed it, not only has Bernanke doomed the global economy to stagflation and imminent food riots, while making the richest 0.001% richer than ever, he has completely broken any linkage between the economy and the market.

Saturday, September 15, 2012

War Drums Beat to Drive Crude Oil Higher

from UK's Telegraph:

Battleships, aircraft carriers, minesweepers and submarines from 25 nations are converging on the strategically important Strait of Hormuz in an unprecedented show of force as Israel and Iran move towards the brink of war.
Western leaders are convinced that Iran will retaliate to any attack by attempting to mine or blockade the shipping lane through which passes around 18 million barrels of oil every day, approximately 35 per cent of the world’s petroleum traded by sea.
A blockade would have a catastrophic effect on the fragile economies of Britain, Europe the United States and Japan, all of which rely heavily on oil and gas supplies from the Gulf.

Friday, September 14, 2012

Crude Oil Blasts Through $100/Barrel

First time since early May. Thank you, Ben Bernanke!

Consumer Prices Surge

Just like wholesale prices yesterday. It has temporarily caused stock prices to slip from overnight highs. I predict stocks will close higher regardless.

Not just lethargic consumer. Lethargic economy!

Thursday, September 13, 2012

Bernanke Fed Unleashes Infinite QE

The Bernanke Fed, as anticipated, unleashed infinite monetary debasement and monetization of the debt today by promising to buy $40 billion/month of MBS in addition to continuing its Operation Twist. It amounts to about $85 billion/month of monetary mayhem. Stocks closed up 200+ points!

Wholesale Inflation Surges Most in Three Years

from WSJ:
WASHINGTON—U.S. wholesale prices in August posted the largest one-month gain in more than three years, fresh evidence that advancing energy costs could create inflation pressures.
Meanwhile, the number of U.S. workers filing applications for jobless benefits rose last because of the fallout from Tropical Storm Isaac, which hit several Gulf Coast states late last month.
The producer-price index, which measures how much manufacturers and wholesalers pay for finished goods, increased a seasonally adjusted 1.7% in August from a month earlier, the Labor Department said Thursday. The biggest gain since June 2009 was largely a result of energy prices rising 6.4%

Wednesday, September 12, 2012

Corn Prices Modestly Lower On Supply Outlook

U.S. forecasters again cut their estimates for the nation's corn and soybean harvests as a widespread drought continued to take a heavy toll in the Farm Belt.
But the Agriculture Department made a smaller reduction in its forecast Wednesday for this fall's corn crop than analysts were expecting. Corn-futures prices, which hit a record last month, fell more than 1% after the report to trade at two-month lows. But soybean prices jumped as those forecast cuts were greater than expected.
Cool temperatures and rains improved growing conditions in parts of the Midwest last month, but came too late to improve yields for most corn growers.
The U.S. drought this year, by some estimates the worst since the 1950s, has stunted crops from Ohio to Nebraska and sent grain and soy prices soaring over the summer. The drought is raising the cost of feed for livestock producers and will ripple through food markets, eventually hitting consumers.
Now, as farmers start to harvest corn and soybeans, traders are paying keen attention to the latest estimates of just how low national production will be.
[image] Reuters
Despite market expectations, the USDA didn't cut it is forecast for domestic corn inventories at the end of the 2012-13 marketing year. Above, fields at Sunburst Dairy near Belleville, Wis.
The USDA again projected the worst corn yields—or harvested bushels per acre—since 1995. It now expects corn yields to average 122.8 bushels an acre, down from its August forecast of 123.4.
The government forecasts total corn production of 10.727 billion bushels this year, down 0.5% from its August estimate. The nation's corn harvest would be the smallest in six years.
"The corn number is clearly the headline," said analyst Jack Scoville, vice president of Price Futures Group in Chicago. The USDA's corn-production estimate "is significantly higher than anyone was expecting."
The USDA cut its estimate for corn demand in the marketing year that ended Aug. 31, including by trimming its export estimate by 0.6% and its estimate for the "feed and residual" category, including corn used in animal feed, by 3.3%. That suggests that record corn prices have curbed demand for the grain more than analysts had expected.
The USDA also estimated greater corn supplies a year from now than analysts had projected.
Corn futures for September delivery fell 11.25 cents or 1.4% to $7.71 a bushel at the Chicago Board of Trade. Most-active December corn fell 8.25 cents or 1.1% to $7.6950 a bushel.
The USDA now expects soybean yields this year to average 35.3 bushels per acre, down from its August forecast of 36.1 bushels per acre. The USDA estimated that the overall soybean harvest will be 2.634 billion bushels, down 2% from its estimate last month.
The USDA is projecting that both soybean yields and the total soybean harvest will be the lowest in nine years.
The government's reductions in soybean yields and production were both greater than analysts expected. Soybean futures for September delivery, thinly traded ahead of the contract's expiration Friday, settled up 44.25 cents, or 2.6%, to $17.4075 a bushel. Most-active November soybeans rose 44.25 cents, or 2.6%, to $17.4575 a bushel.
Some analysts think the soybean crop will be larger than the USDA projects, partly because the agency's forecasts are based on a mix of physical crop measurements and farmer surveys.
In surveys, the farmer "doesn't have much of an incentive to tell the government the truth," said Chad Henderson, president of Prime-Ag Consultants Inc., a commodity brokerage based in Brookfield, Wis. "I think the bean number is too low.…You might not have big, big yields out there any places, but you just don't have the really poor crops in beans which you need to get a low national average yield."
About 15% of the U.S. corn crop has been harvested, which is higher than normal for this time of year, in part because warm spring weather led to early plantings.
Some farmers are trying to speed up their corn harvest to maximize yields after the drought battered their fields. "Because of the drought, our plants are not very strong and they're starting to fall over," said David Hardin, a 39-year-old farmer in Danville, Ind., who planned to start harvesting corn this week. "To salvage what bushels we can, we're going to start harvesting earlier."
Mr. Hardin and his father, who farm together, also raise hogs. In a normal year, they grow enough corn to feed their swine. But they don't think they'll have enough corn after this year's harvest, so they will have to buy corn at high market prices. This will lead to "significant red ink" next year, because the cost of raising the hogs likely will outstrip the price the Hardins can fetch from meatpackers, Mr. Hardin said.
In Emington, Ill., farmer Mike Haag said August rainfall may have helped the soybean crop he manages with his father, but that yields will be below average. "Some of these late rains probably helped some," the 45-year-old said, "but it hasn't by any means alleviated the problem."
The USDA didn't change its forecast for domestic soybean inventories a year from now, though the forecast of 115 million bushels would still be a nine-year low.
Globally, the government slightly boosted its forecast for corn inventories, on the expectation that reduced demand will make up for production shortfalls in North America and Europe.
U.S. forecasters made small trims to their estimates for world soybean and wheat inventories, due to demand reductions offsetting production cuts. For wheat, the USDA cut its output forecast for Russia by 9.3%, in line with analysts' concerns about drought-damaged crops there.
—David Kesmodel and Ian Berry contributed to this article.

Tuesday, September 11, 2012

P/E Ratios Reach the Stratosphere

At what point do we begin calling this another bubble?

from Zero Hedge:

Since The Dreme (Draghi Scheme) began shortly after the EU Summit, the P/E multiple on the S&P 500 has risen by a faith-defining 2x. This is the largest three-month rise in this indicator-of-indifference-to-reality since the initial burst rally off the March 2009 lows. Meanwhile, the actual earnings consensus is being marked down further, heading for an earnings recession as we pointed out last week. It seems investors are too afraid not to believe in P/E miracles or perhaps it is just faith that central banks have it all under control and their 'promises' are as good-as-gold.
The S&P 500 seems 'managed' to a certain level - no matter what that means for EPS or P/E multiples, the spice must flow market must rise... (a 2x multiple increase since Draghi's initial utterances post EU Summit


As if the divergence was not enough, the 3 month rise in the S&P's P/E ratio (lower pane) is its highest since the initial V-bottom recovery in 2009...


Charts: Bloomberg and JPMorgan

Monday, September 10, 2012

Plunge!

Sharp sell-off in the last two hours of the day!

HIgh Risk With More Fed QE

May I nominate this man for Treasury Secretary, or better yet, Fed Chairman?
John P. Hussman, Ph.D.
 

For investors who don’t rely much on historical research, evidence, or memory, the exuberance of the market here is undoubtedly enticing, while a strongly defensive position might seem unbearably at odds with prevailing conditions. For investors who do rely on historical research, evidence, and memory, prevailing conditions offer little choice but to maintain a strongly defensive position. Moreover, the evidence is so strong and familiar from a historical perspective that a defensive position should be fairly comfortable despite the near-term enthusiasm of investors.
There are few times in history when the S&P 500 has been within 1% or less of its upper Bollinger band (two standard deviations above the 20-period moving average) on daily, weekly and monthly resolutions; coupled with a Shiller P/E in excess of 18 – the present multiple is actually 22.3; coupled with advisory bullishness above 47% and bearishness below 27% - the actual figures are 51% and 24.5% respectively; with the S&P 500 at a 4-year high and more than 8% above its 52-week moving average; and coupled, for good measure, with decelerating market internals, so that the advance-decline line at least deteriorated relative to its 13-week moving average compared with 6-months prior, or actually broke that average during the preceding month. This set of conditions is observationally equivalent to a variety of other extreme syndromes of overvalued, overbought, overbullish conditions that we've reported over time. Once that syndrome becomes extreme - as it has here - and you get any sort of meaningful "divergence" (rising interest rates, deteriorating internals, etc), the result is a virtual Who's Who of awful times to invest.
Consider the chronicle of these instances in recent decades: August and December 1972, shortly before a bull market peak that would see the S&P 500 lose half of its value over the next two years; August 1987, just before the market lost a third of its value over the next 20 weeks; April and July 1998, which would see the market lose 20% within a few months; a minor instance in July 1999 which would see the market lose just over 10% over the next 12 weeks, and following a recovery, another instance in March 2000 that would be followed by a collapse of more than 50% into 2002; April and July 2007, which would be followed by a collapse of more than 50% in the S&P 500, and today.
The prior instances were sometimes followed by immediate market losses, and were sometimes characterized by extended top formations - which produce a sort of complacency as investors say “see, the market may be elevated and investors may be over-bullish, but the market is so resilient that it’s ignoring all that, so there’s no reason to worry.” Ultimately, however, the subsequent plunges wiped out far more return than investors achieved by remaining invested once conditions became so extreme. We are in familiar territory, but that territory generally marks the mouth of a vortex.
Based on ensemble methods that capture a century of evidence – from Depression-era data, through the New Deal, World War, the Great Society, the electronics boom, the energy crisis, stagflation, the great moderation, the dot-com bubble, the tech crash, the housing bubble, the credit crisis, and even the more recent period of massive central bank interventions – our estimates of prospective market return/risk have been negative since April 2010 and have remained negative even as new data has arrived. Since early March, those estimates have plunged into the most negative 0.5% of historical instances.
It’s worth noting that the S&P 500 posted a negative total return between April 2010 and November of last year. Of course, the market has also enjoyed a risk-on mode since then. Through Friday, the S&P 500 has achieved a total return of nearly 25% since our return/risk estimates turned negative in early 2010. Defensiveness has clearly been taxing in that respect. But this doesn’t remove the question of whether the market’s recent gains are durable, much less whether they will be extended. Corporate insiders certainly don’t seem to think so – their sales have tripled since July, to a rate of six shares sold for each share purchased.
Far from being some novel “new era” environment, present conditions – rich valuations, overbought trends, lopsided bullishness, heavy insider sales, and lagging market internals – are part of a historical syndrome that is very familiar in the sense that we’ve repeatedly seen it prior to the worst market declines on record. But as the chronicle above should make clear, this doesn’t make our short-term experience any easier, because these conditions can emerge, go dormant for a few months while the market retreats modestly, and then reappear as the market registers a marginal new high. The ultimate outcome has historically been spectacularly bad, but it still takes patience and discipline to stay on the sidelines during late-stage, high-risk advances. Of course, the present instance may turn out differently than every prior instance has – it’s just that we have no basis to expect that outcome.
Economic Notes
The most interesting feature of last week’s “decision” by the European Central Bank was the continued eagerness of investors to hear what they want to hear, rather than what is actually said. With little doubt, what investors think they heard was that the ECB has finally decided to launch a new program by which it will begin purchasing Italian and Spanish debt in unlimited – unlimited – amounts, putting an emphatic end to European debt strains, and decisively ensuring the future unity of the Euro.
Here is what the European Central Bank actually said:
“A necessary condition for Outright Monetary Transactions is strict and effective conditionality attached to an appropriate European Financial Stability Facility/European Stability Mechanism (EFSF/ESM) programme. Such programmes can take the form of a full EFSF/ESM macroeconomic adjustment programme or a precautionary programme (Enhanced Conditions Credit Line), provided that they include the possibility of EFSF/ESM primary market purchases. The involvement of the IMF shall also be sought for the design of the country-specific conditionality and the monitoring of such a programme.”
If you wondered why Angela Merkel and the whole of Germany was not immediately up in arms, it is because prior to transactions by the ECB, the receiving country would have to submit to an adjustment program, ideally involving the IMF. This is nothing like what Spain has been asking for, which is for the ECB to make unconditional purchases. To benefit from the proposed OMT program, these countries have to subordinate their fiscal policy to outside conditionality.
What if they don’t?
“The Governing Council will consider Outright Monetary Transactions to the extent that they are warranted from a monetary policy perspective as long as programme conditionality is fully respected, and terminate them once their objectives are achieved or when there is non-compliance with the macroeconomic adjustment or precautionary programme.”
But assuming these countries accept the adjustment programs, at least they can be assured that the ECB will buy their debt in unlimited amounts, can’t they?
“No ex ante quantitative limits are set on the size of Outright Monetary Transactions.”
Read carefully – the ECB did not promise “unlimited” financing. Rather, it refused to specify an amount in advance (ex-ante), because it doesn’t want the markets to look at some inadequately small and fixed number and begin to speculate against the ECB as soon as that particular number is approached. By refusing to set a specific amount in advance, Draghi said in his press conference that he wanted the policy to be perceived as fully effective. But perception substitutes for reality only for so long. If Merkel, Monti and Rajoy were stranded on a mountaintop and Merkel was the only one with a bag of muesli, she might offer some to the other two without specifying an amount in advance, but there’s no doubt she’d be slapping it out of their hands if things got out of control.
Finally, “The liquidity created through Outright Monetary Transactions will be fully sterilised.”
This last provision is likely to both calm Germans and inflame them. Sterilization means that for every euro of Spanish or Italian bonds the ECB buys (creating new euros in the process), it will drain euros by selling some other security – most likely bonds of Germany, Holland, Finland, or other stronger European nations. This will help to calm Germans because it indicates that the overall supply of euros will not expand. It will also inflame them, however, because the existing stock of euros will now have been created to provide fiscal support to Spain, Italy and other troubled countries, while Germany, Holland, Finland and stronger countries will not have benefited at all from the money creation.
It will be interesting how this plays on September 12, when the German Constitutional Court is set to decide on the legality of the European bailout funds, the EFSF and the ESM (technically, the Court will rule on an injunction against even passing it into law, but will not formally rule on constitutionality until possibly next year). My expectation is that they will rule that these mechanisms are in fact allowable and consistent with the German Constitution. Where it gets interesting is whether they will rule that it is allowable to leverage these mechanisms or operate with a banking license (which would make Germany’s existing contribution “capital” that could be wiped out, leaving Germany on the hook for much, much larger amounts - which essentially cedes fiscal authority from the German people to the ESM). I suspect that there is a fair chance that the Court will add language in their ruling to reject that possibility, which may force the idea of a “big bazooka” back to square one. We’ll see.
---
Here in the U.S., Friday’s August employment report was surprisingly weak relative to Wall Street’s expectations, though hundreds of thousands of workers abandoned the labor force, which allowed the unemployment rate to decline. Relative to our own expectations, the figure was elevated, as I expect that the August employment figure will ultimately be revised to a negative reading. This would be consistent with revisions that we’ve seen around prior recession starting points.
For example, if you look at the originally reported data for May through August 1990, you’ll see 480,000 total jobs created (see the October 1990 vintage in Archival Federal Reserve Economic Data). But if you look at the revised data as it stands today, you’ll see a loss of 81,000 jobs for the same period. Look at January through April 2001, at the start of that recession. The vintage data shows a total gain of 105,000 jobs during those months, while the revised data now shows a loss of 262,000 jobs. Fast forward to February through May 2008, and though you’ll actually see an originally-reported job loss during that period of 248,000 jobs, the revised figures are still dismal in comparison, now reported at a loss of 577,000 jobs for the same period. As other good economic analysts have recognized, economic time series tend to be revised after-the-fact, with upward revisions in periods just before the recession begins, and downward revisions in periods just after the recession begins. I continue to believe that the U.S. joined an unfolding global recession, most probably in June of this year.
---
Ahead to QE3. A week ago, The Wall Street Journal ran a piece by Jon Hilsenrath titled Will Fed Act Again? Sizing Up Potential Costs. The article reviewed concerns about additional quantitative easing, noting that inflation has remained muted and the dollar has remained firm. Both of those outcomes were presented as evidence counter to Fed Governor Charles Plosser’s concern that “Without appropriate steps to withdraw or restrict the massive amount of liquidity that we have made available… the inflation rate is likely to rise to levels that most would consider unacceptable.”
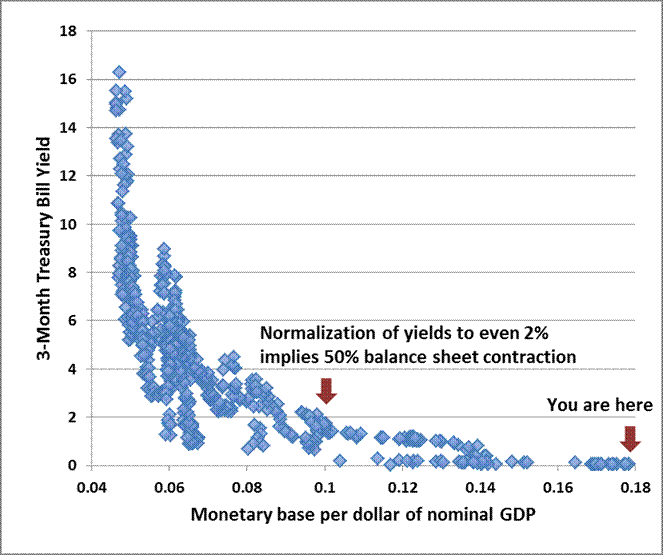
There is strong evidence to suggest that this is little but false comfort. While we don’t expect material inflationary pressures until the back-half of this decade, the Federal Reserve has increasingly placed itself into a position that will be nearly impossible to disgorge without enormous disruption. Specifically, the U.S. economy could not achieve a non-inflationary increase in Treasury bill yields to even 2% without requiring a nearly 50% reduction in the Federal Reserve’s balance sheet.
This point is easily demonstrated in data from 1947 to the present. The relationship between short-term interest rates and the amount of monetary base per dollar of nominal GDP is very robust, and is widely recognized as the “liquidity preference” curve. We are already way out on the flat part of this curve. Note that Treasury bill yields have never been at even 2% except when there was less than 10 cents of base money per dollar of nominal GDP. There are only 3 ways to get there from the current 18 cents – dramatically cut the balance sheet, keep interest rates near zero for the next decade (assuming nominal GDP growth of 5% annually), or accept much higher rates of inflation than most would consider acceptable.
Moreover, with a portfolio duration that we now estimate at about 8 years, historically low yields on Treasury securities, and a Fed balance sheet currently leveraged about 53-to-1 against the Fed’s own capital, an increase in long-term yields of anything more than 20 basis points a year would produce capital losses sufficient to wipe out interest income, making the Fed effectively insolvent, and turning monetary policy into fiscal policy.
On the subject of Fed leverage, it is one thing to purchase long-dated bonds when yields are high. It is another to purchase them when yields are at record lows and very small yield changes are capable of wiping out all interest income and leaving the Fed in a loss position when it is already levered 53-to-1 (2.9 trillion of assets on 54.6 billion of capital, according to the Fed’s consolidated balance sheet). At a 10-year Treasury yield of just 1.6% and a portfolio duration of about 8 years (meaning that a 100 basis point move causes a change of about 8% in the value of the securities held by the Fed), it takes an interest rate increase of only about 20 basis points (1.6/8) to wipe out a year of interest on the portfolio held by the Fed and push it into capital losses. It would then take another 24 basis points to wipe out all of the capital on the Fed’s balance sheet. Of course, they don’t mark the balance sheet to market. So the public might not be aware of those losses, but that would only mean that we would have an insolvent Fed printing money on an extra-Constitutional basis to fund its own balance sheet losses instead of public spending.
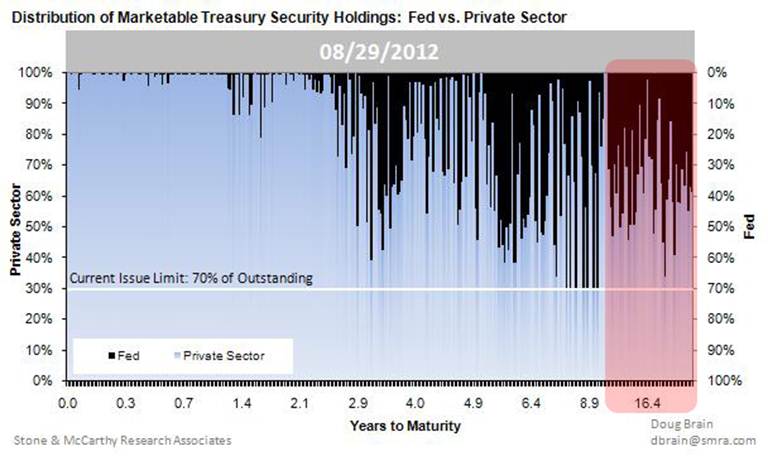
Based on a report from UBS (h/t ZeroHedge), the Federal Reserve now holds all but $650 billion of outstanding 10-30 year Treasury securities, with UBS warning “a large, fixed size QE program could cause liquidity to tank”, with a similar outcome in the event that the Fed pursues mortgage-backed securities instead. A couple of years ago, Bernanke asserted in a 60 minutes interview that “We could raise interest rates in 15 minutes if we have to. So there is really no problem in raising interest rates, tightening monetary policy, slowing the economy, reducing inflation, at the appropriate time.” Really? Tell that to Paul Volcker, who had to deal with enormous inflation at unemployment rates even higher and a monetary base dramatically smaller than we observe at present.
The Fed now holds virtually no Treasury debt of maturity of less than 3 years, as Operation Twist and other efforts have been designed to force investors to choke on short-dated paper yielding next to nothing, in hopes of forcing them into riskier securities. The chart below shows the distribution of Fed holdings (dark bars) versus private sector holdings of Treasury debt, at various maturities. Of course, in equilibrium, someone still has to hold the short-dated Treasury securities, in addition to about $2.7 trillion in zero-interest cash and bank reserves, until those securities, currency, and reserves are retired. To believe that an unwinding of the Fed’s present balance sheet would not be disruptive is full-metal make-believe.
Good economic policy acts to relieve some binding constraint on the economy. How does the Fed argue that base money is a binding constraint? At present, there are trillions of dollars held as idle reserves on bank balance sheets. While a “portfolio balance” perspective may well suggest that additional zero-interest reserves will force more investors into risky assets at the margin (which has been most effective after significant market declines over the prior 6-month period), so what? There is no historical evidence that changes in stock market value have a significant effect on GDP. Indeed, a 1% change in stock market value is associated with a change of only 0.03-0.05% in GDP, largely because individuals consume off of their expectation of “permanent income”, not off of transitory changes in volatile securities.
In regard to why inflation has remained low, a useful way to see the relationship between the monetary base, interest rates, GDP and inflation is the “exchange equation”: MV = PQ, where M is base money, V is velocity, P is prices, and Q is real output. As is evident from the liquidity preference chart, base velocity (PQ/M) is tightly related to short-term interest rates. In fact, as long as short-term interest rates fall in response to increases in the monetary base, those increases have virtually no effect on real output, but instead translate almost directly into declines in velocity. Again, some data from 1947 to the present:
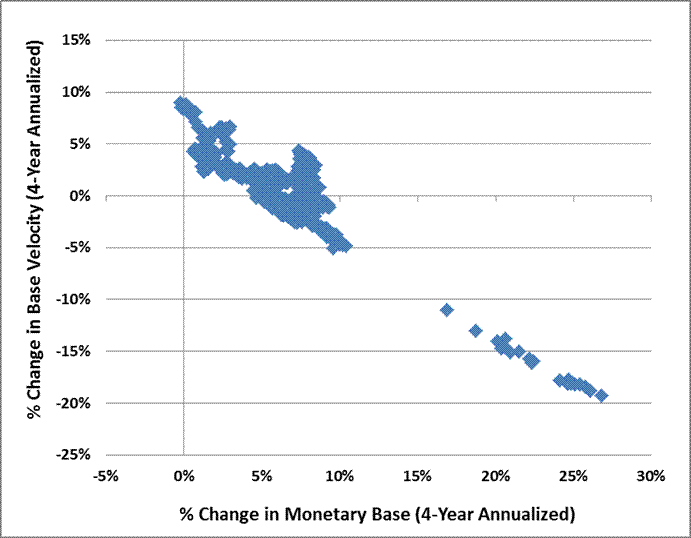
If the decline in velocity exactly offsets the increase in base money, inflation is not going to explode overnight. But this happy outcome is brought to you by the passive response of short-term interest rates and the willingness of the public to accumulate zero-interest assets, which is in turn the result of strong and legitimate concerns about credit risk, default risk, and economic weakness. But remove any of those factors, or allow any other exogenous upward pressure on short-term interest rates, and the result will be upward pressure on velocity. Barring enormous rates of real GDP growth, the only way to counter that, as the first chart suggests, will be through either massive (and potentially disruptive) contraction of the Federal Reserve’s balance sheet, or acceptance of undesirable rates of inflation.
As hedge funds often discover, and JP Morgan recently learned, it is very easy to get into a position that later turns out to be nearly impossible to exit smoothly. A significant reduction in the Fed’s balance sheet is unlikely to be achieved at long-term interest rates nearly where they are now, which implies capital losses on the Fed account, which implies that in contemplating a further round of quantitative easing, the Federal Reserve is effectively contemplating a fiscal policy action.
Unfortunately, they’re likely to do it anyway.
From an investment perspective, it’s important to consider the potential effect of additional quantitative easing. As I noted several weeks ago (see What if the Fed Throws a QE3 and Nobody Comes?), the effect of prior rounds of quantitative easing both in the U.S. and abroad has generally been limited to little more than a recovery of the loss that the stock market sustained over the prior 6-month period. Presently, the S&P 500 is at a 4-year high, valuations are rich on the basis of normalized earnings, and advisory sentiment exceeds 50% bulls – over twice the number of bearish advisors according to Investors Intelligence. In recent years, each round of QE emerged closely on the heels of a significant market loss that produced a spike in risk premiums. In that environment, expanding the stock of zero-interest rate assets had the effect of bringing those risk premiums back down to those observed over the prior 6-months or so, and more recent interventions have shown diminishing returns. At present, risk-premiums are already depressed and there is no 6-month loss to recover.
In short, even the evidence of the past several years does not support the automatic assumption that stock prices will advance in the event of another round of QE at present levels. With little doubt, the market is likely to enjoy some immediate cheer from that sort of move, particularly if the Fed refrains from providing a specific ex-ante limit on its purchases - allowing investors to rejoice in the perception that the Fed had launched “unlimited” QE. Still, that cheer may be short-lived. If we examine the way that QE actually operates, and how and why risk premiums have responded to prior rounds, it is entirely unclear that a further round will have much effect beyond an initial spike of enthusiasm. That is, unless one adopts a superstitious faith that stocks will rise in response to QE, since QE makes stocks rise, because QE equals stocks rising, with no further analysis needed.
The foregoing comments represent the general investment analysis and economic views of the Advisor, and are provided solely for the purpose of information, instruction and discourse. Only comments in the Fund Notes section relate specifically to the Hussman Funds and the investment positions of the Funds.

Saturday, September 8, 2012

QE Only Benefits the Elites, Wealthy

by John Mauldin

Many speculate that the Fed will launch QE3 next week.
But independent economics and financial experts say this would hurt – rather than help – the economy.
Dallas Federal Reserve Bank president Richard Fisher said:

I firmly believe that the Federal Reserve has already pressed the limits of monetary policy. So-called QE2, to my way of thinking, was of doubtful efficacy, which is why I did not support it to begin with. But even if you believe the costs of QE2 were worth its purported benefits, you would be hard pressed to now say that still more liquidity, or more fuel, is called for given the more than $1.5 trillion in excess bank reserves and the substantial liquid holdings above the normal working capital needs of corporate businesses.
William F. Ford – former president of the Federal Reserve Bank of Atlanta – notes:
One of the overlooked consequences of the Federal Reserve’s recent rounds of monetary stimulus is the adverse impact those policies have had on the interest income of savers. The prolonged and abnormally low interest-rate structure put in place by the Fed has made life particularly difficult for retirees and others who depend on conservative interest-sensitive investments. But the negative effects do not stop there. They spillover into the overall performance of the economy.

Our estimates show that these negative effects, resulting from the Fed’s two rounds of quantitative easing (QE1 and QE2), are sizable and may help account for the lackluster character of the current recovery.

***

By lowering interest rates to historically unprecedented levels, the Fed’s policy deprives savers of interest income they normally would have earned on the interest-sensitive assets they hold. Thus, there is an income channel that no one is talking about, and its negative impact can be powerful.

***

Table 2 below shows our estimates of the possible losses in spending power, output, and employment generated by the Fed’s artificially low interest rates. Even by our most conservative estimate, which only looks at the $9.9 trillion in assets most directly affected by depressed yields on Treasurys, the losses are impressive. The average yield on Treasurys in June 2010 was 2.14 percent compared to an average of 7.07 percent in the previous nine recoveries, a difference of 4.93 percentage points. The projected annual impact of this loss of interest income on just $9.9 trillion of rate-sensitive assets translates into $256 billion of lost consumption, a 1.75 percent loss of GDP, and about 2.4 million fewer jobs. (Our calculations assume that the recipients of interest income face a 25 percent average income tax rate and consume 70 percent of their after-tax income.)

RR20110704 2 The Fed Is Expected to Launch QE3 Next Week ... Which Would Help the Rich and Hurt the Little Guy

Had these jobs not been lost, the unemployment rate would be 7.5 percent, instead of the current 9.1 percent, and this is the minimal effect we estimate.

***

As the estimate of the total of affected interest-sensitive assets gets bigger, the negative effects of depressed yields becomes even more striking. Using our mid-point estimate of $14.35 trillion of interest-sensitive assets, a 4.93 percentage point reduction in interest rates annually cost the economy $371 billion in spending, 3.5 million jobs, and 2.53 percent of GDP. This is a sizable effect, given that during this time GDP grew by only 2.33 percent and the economy added only 870,000 jobs.

With the additional jobs that might have been created by higher interest income levels, the unemployment rate could fall to 6.8 percent. And output could grow more than twice as fast as it has. The resulting GDP growth rate of 4.86 percent would then be closer to the average second-year growth rate of the past nine recoveries, and the U.S. economy would be well on its way to a vigorous recovery, rather than struggling as it is now.

This midpoint appraisal is our best estimate of the likely effect of the Fed’s policy. It may still be on the low side.

The numbers do not account for any so-called multiplier effects. Additional spending by recipients of interest income creates revenues for businesses, which in turn increases the income of their owners and employees, who themselves spend more. This, in turn, could boost overall spending and employment by more than the gain in interest income alone would suggest.

***

The housing market has not even begun to recover since the QE initiatives were created. U.S. auto sales and the stock market also remain well below pre-recession levels. And the sharp decline of the U.S. dollar has not created an export boom. But it has put upward pressure on the cost of our food and energy imports.

And tens of millions of U.S. savers, largely the elderly, still are facing strained circumstances created by Fed-driven abnormally low interest rates across the entire Treasury yield curve.

The negative impacts on output and employment caused by quantitative easing through the interest income effects shown here are large. In fact, they may outweigh the expected, but hard-to-document, positive effects of the QE program.
In fact, it has been thoroughly-documented that quantitative easing is great for the wealthy, but terrible for the little guy.
As the Guardian reported last year, quantitative easing increases inequality:
Quantitative easing (QE) … have contributed to social unrest by exacerbating inequality, according to one City economist.

As the Bank of England considers unleashing a fresh round of QE, Dhaval Joshi, of BCA Research, argues the approach of creating electronic money pushes up share prices and profits without feeding through to wages.
“The evidence suggests that QE cash ends up overwhelmingly in profits, thereby exacerbating already extreme income inequality and the consequent social tensions that arise from it,” Joshi says in a new report.

He points out that real wages – adjusted for inflation – have fallen in both the US and UK, where QE has been a key tool for boosting growth. In Germany, meanwhile, where there has been no quantitative easing, real wages have risen.
The Washington Post reported last month:
How might a third round of quantitative easing (QE3) affect the already-wide levels of inequality in the United States? Across the Atlantic, the Bank of England has come in for some criticism this week after it released a new report showing that its own quantitative easing efforts have disproportionately benefited the wealthiest:
The richest 10% of households in Britain have seen the value of their assets increase by up to £322,000 [$510,000] as a result of the Bank of England‘s attempts to use electronic money creation to lift the economy out of its deepest post-war slump. …

The Bank of England calculated that the value of shares and bonds had risen by 26% – or £600bn – as a result of the policy, equivalent to £10,000 for each household in the UK. It added, however, that 40% of the gains went to the richest 5% of households.
It’s not hard to see why this happens. One way the bank’s quantitative easing program works, in theory, by pushing up asset prices in order to support the broader economy. And, according to the Bank of England, the median British household only holds about $2,370 in financial assets. So the direct benefits largely accrue to wealthier households.

What about the United States? Much like in Britain, the distribution of financial assets are also heavily skewed. As you can see on page 26 of this Fed report (pdf), the median American family in the middle income bracket has about $19,900 in financial wealth. By contrast, the median family in the top income bracket has $423,800 in financial wealth. So any move by the Fed to push up asset prices is likely to increase wealth inequality in the short term.

There are other effects, too. As The Wall Street Journal has reported, the Fed’s efforts to bring down interest rates have mainly helped better-off Americans with good credit scores. For instance, it’s exceedingly cheap to get a mortgage right now — for a small number of people. (The folks at Zero Hedge, who are no fan of Bernanke’s stimulus efforts, have compiled a much longer list of links on how the Fed’s quantitative easing program benefits the wealthy.)
Indeed, Bernanke knew in 1988 that quantitative easing doesn’t work.  But he keeps caving in to the super-elite, and implementing it anyway.

Friday, September 7, 2012

Jobs Report Worse Than Thought


Job Growth Stalls, But Stocks Rise Anyway

WASHINGTON (Reuters) - Jobs growth slowed sharply in August, setting the stage for the Federal Reserve to pump additional money into the sluggish economy next week and dealing a blow to President Barack Obama as he seeks re-election.
Nonfarm payrolls increased only 96,000 last month, the Labor Department said on Friday, below what would normally be needed to put a dent in the jobless rate. Payrolls had grown by 141,000 jobs in July.
While the unemployment rate dropped to 8.1 percent from 8.3 percent, it was only because many Americans gave up the hunt for work. The survey of households from which the jobless rate is derived actually showed a decline in employment.
"The economy is crawling up the down escalator and today's report can only give ammunition to the activist members of the Fed board to loosen monetary policy further next week," said Patrick O'Keefe, head of economic research at J.H. Cohn in Roseland, New Jersey.
The lackluster report piled pressure on Obama ahead of the November vote in which the health of the economy looms large.
While acknowledging the tepid pace of job growth, Obama laid the blame for the labor market's woes on Congress, in particular Republicans.
"If Republicans are serious about being concerned about joblessness, we could create a million new jobs right now if Congress would pass the job plans I sent to them a year ago," Obama said at a campaign rally in Portsmouth, New Hampshire.
Republican presidential nominee Mitt Romney said Obama had done nothing during his first term in office to inspire confidence among Americans in his economic policies.
"Seeing that kind of report is obviously disheartening for the American people who need work and are having a hard time finding work," Romney told reporters in Sergeant Bluff, Iowa.
The weakness was virtually across the board, with average hourly earnings slipping and manufacturing -- the star of the recovery from the 2007-09 recession -- shedding jobs for the first time in nearly a year.
The data dampened spirits in U.S. stock markets, which were little changed in afternoon trade after posting sharp gains earlier in the week. Treasury debt prices rallied on prospects of bond purchases by the Fed next week, while the dollar dropped to a near four-month low against the euro.
Economists polled by Reuters had expected payrolls to rise 125,000 last month, but some had pushed their forecasts higher after upbeat data on Thursday.
LOOKING FOR A SILVER LINING
Fed Chairman Ben Bernanke last week said the labor market's stagnation was a "grave concern," a comment that raised expectations for a further easing of monetary policy.
The economy has experienced three years of growth since the 2007-09 recession, but the expansion has been grudging and the jobless rate has held above 8 percent for 43 straight months, essentially all of Obama's term and the longest stretch since the Great Depression. Economists say jobs growth in the range of 125,000 a month would normally be needed just to hold the unemployment rate steady.
The jobless rate peaked at 10 percent in October 2009, but progress reducing it stalled this year, threatening Obama's bid for a second term. An online Reuters/Ipsos poll on Thursday gave Romney a 1-point edge on Obama, 45 percent to 44 percent.
The lack of headway putting Americans back to work also has put the question of further monetary stimulus on the table at the Fed, which meets on Wednesday and Thursday. Some economists who had thought the central bank might bide its time said the jobs data made action next week more likely than not.
The central bank has held interest rates close to zero for nearly four years and has pumped about $2.3 trillion into the economy through two bouts of bond buying, or quantitative easing, to drive borrowing costs lower and spur growth.
In addition, it has said it expects to hold rates near zero at least through late-2014, a pledge that is also in play at next week's meeting.
"We expect the Fed to extend its 'low-rates' guidance through mid-2015, and to launch a third round of quantitative easing worth $500-$600 billion," said Nigel Gault, chief U.S. economist at IHS Global Insight in Lexington, Massachusetts.
"We don't think these measures will be very effective in boosting growth, but for the Fed it's a question of trying to do what it can."
"STUCK IN THE MUD"
The weak tenor of the report was underscored by revisions to June and July data that showed 41,000 fewer jobs created during those months than previously reported.
In addition, the labor force participation rate, or the percentage of Americans who either have a job or are looking for one, fell to 63.5 percent in August, the lowest in 31 years.
A total of 368,000 people gave up looking for work last month, the household survey showed.
Since the beginning of the year, job growth has averaged 139,000 per month, compared with an average monthly gain of 153,000 in 2011. Last month's increase still left the economy 4.7 million jobs short of where it stood when the recession started.
"Today's numbers should check any enthusiasm that the economy was gaining momentum toward the end of the summer. Instead, the economy appears to remain stuck in the mud," said Michael Feroli, an economist at JPMorgan in New York.
Economists say fears of the so-called U.S. fiscal cliff -- the $500 billion or so in expiring tax cuts and government spending reductions set to take hold in 2013 -- and Europe's long-running debt problems have made businesses cautious about hiring in an already sluggish recovery.
Manufacturing payrolls fell 15,000, largely because of declines in automobile assembly jobs. Factory jobs were inflated in July because auto manufacturers kept plants running when they would normally shut them for retooling.
There was little improvement in construction employment, which added 1,000 jobs, even though home builders continued to break ground on new projects at a fast clip. Temporary employment, seen as a harbinger of future permanent hiring, declined for the first time since March.
Retail jobs were one of the few bright spots, rebounding after declining for two straight months. While payrolls at utilities grew 8,800, that was a snap back from a strike in July.
Government payrolls declined for a sixth straight month, dragged down by state and local governments as they continue to tighten belts to balance their budgets.
Average hourly earnings fell one cent, which could weigh on consumer spending. Earnings have risen just 1.7 percent over the past 12 months.
The average work week was steady at 34.4 hours in August.
(Additional reporting by Jason Lange in Washington and Sam Youngman in Iowa; Editing by Andrea Ricci)

Thursday, September 6, 2012

Stocks Explode to Fresh FIve-Year Highs...

...on promises by central bankers, both in the US and Europe, to monetize unlimited amounts of government debt, and the first positive weekly jobless claims report in four weeks. The chart shows the past four weeks for stocks, including the magnitude of the elation this morning (last candle). The Dow is up nearly 250 points thus far.

Something doesn't match between the stock chart above, and the various news reports below.