Friday, May 13, 2011

PIMCO's Largest Position Is Gold
Amazing!
from International Business Times:
Anne Gudefin, PIMCO’s global equities portfolio manager, likes gold.
“The largest position in [our] fund is gold, which we think is a very good form of protection against what can go wrong,” said Gudefin in an interview with Fortune published on May 12.
“We were encouraged by the fact that a lot of the central banks, especially in Asia, are big buyers. We think that's an underlying trend that's very favorable for gold,” she said.
The latest IMF data show that the central banks that have added to their gold positions include Thailand, Mexico, and Russia.
These central banks, like PIMCO, are likely attracted by gold’s historic reputation as a store of value, especially at a time of heightened uncertainties.
On the economics side, uncertainties include the European debt crisis, the US housing market, the US budget deficit, the possible negative effects of QE2, the Chinese properties market, and Chinese inflation.

Treasury Shorts Shaken

Indecisive Market

Yesterday, stocks rallied on a failed US Treasury auction. After a failed attempt to rally again today, stocks have collapsed. Dow is currently down about 100 points, but still maintaining a level above yesterday's lows. I think that with QE2 coming to a close in less than 7 weeks, the markets are anticipating the potential for malaise that had prevailed over the past three years each time the Fed has stopped monetizing the debt!
Yesterday, I read interesting analysis by Chris Martenson that suggested that about 2/3 of the volume of the stock market during QE2 was due to money creation by the Fed. That's doesn't make me feel warm and fuzzy going forward.
Prediction From One of Wall Street's More Accurate Prognosticators
from Bloomberg interview of John Taylor:
Higher-risk assets, such as equities, the euro and emerging market currencies, have either peaked or will do so by end of July, according to Taylor, who manages about $8.5 billion and uses statistical models to help predict future movements in assets. Global investors have tempered their optimism about the U.S. and world economies and plan to put more of their money in cash and less in commodities over the next six months, a Bloomberg survey released today found.
FX Concepts, whose returns last year were the company’s best since 2006, reaped gains in the first half of 2010 betting on a slide in the euro against the dollar and then profited by its rise the rest of the year. At present, the fund is short the common currency, which means it will profit if it declines.
Taylor, who predicted several times since 2010 that the euro will eventually fall to parity versus the dollar, boosted returns by wagering on short term swings higher in the shared European currency. FX Concepts, in a Jan. 27 note, said the euro would move higher in a medium-term trend and in April predicted the currency was poised to reach a technical target of $1.4925.
“There is absolutely statistically no way that Greece can survive,” said Taylor, who just returned from France. “There is a one in 10,000 chance; if the Germans give Greece their money to pay back their debt then they’ll be fine. But there is no way Germany will do that.”
Greek government bonds fell today, pushing the two-year note yield to a record high of 26.77 percent. The bonds have lost investors 11 percent this year.
“As the spread of Greek two-year debt goes absolutely crazy over German, it means that at some point we are going to have to have a crisis,” said Taylor, whose Global Currency fund gained 3.33 percent last month. “And I think it’s very soon.”

Inflation Surges
CPI was up this morning, sending stocks lower.


Wednesday, May 11, 2011


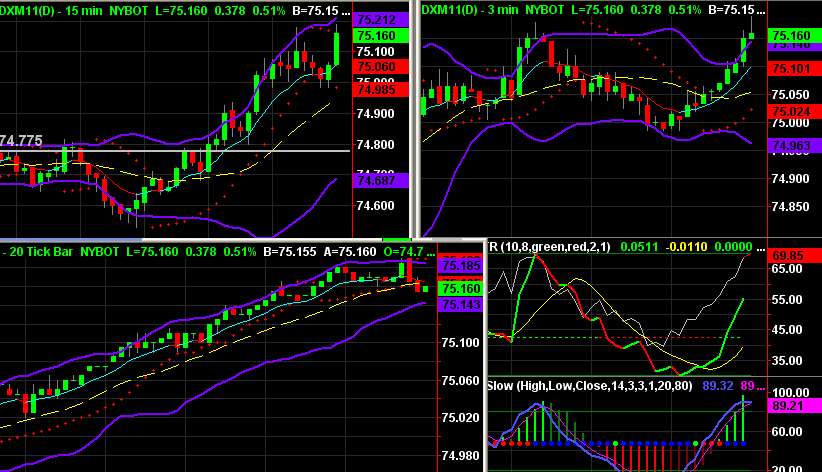

And Plunge Still More


Gas, Crude Futures Drop on Bearish EIA Surprise

NEW YORK (AP) - Gasoline futures tumbled 6 percent Wednesday after the government reported that the U.S. unexpectedly increased supplies last week.
Analysts expected gasoline supplies to shrink for the 12th week in a row as a rash of operating problems during the past few months idled numerous refineries around the country. Energy Information Administration data showed that supplies increased last week by 1.3 million barrels, growing as gasoline demand dropped for the seventh week in a row to 9 million barrels per day.
Gasoline for June delivery dropped after the report, losing 22 cents at $3.1588 per gallon on the New York Mercantile Exchange. Gas supplies typically decline in the spring as refineries purge their stocks of winter fuels. This year supplies fell more than expected as fires, power outages and other random problems temporarily knocked refineries out of commission during the past few months. Mississippi River flooding also may affect some refineries, analysts said.
Corn Limit Down on USDA Report

Grains hit hard at open, but bargain hunters emerging; prices well off their lows; corn dn 22, beans dn 9, wht dn 16 to dn

Stocks Looking Weak Today

Tuesday, May 10, 2011


True Finn Party Rejects More EU Bailouts
Editorial in WSJ by True Finn Party leader Timo Soini:
When I had the honor of leading the True Finn Party to electoral victory in April, we made a solemn promise to oppose the so-called bailouts of euro-zone member states. These bailouts are patently bad for Europe, bad for Finland and bad for the countries that have been forced to accept them. Europe is suffering from the economic gangrene of insolvency—both public and private. And unless we amputate that which cannot be saved, we risk poisoning the whole body.
At the risk of being accused of populism, we'll begin with the obvious: It is not the little guy that benefits. He is being milked and lied to in order to keep the insolvent system running. He is paid less and taxed more to provide the money needed to keep this Ponzi scheme going. Meanwhile, a kind of deadly symbiosis has developed between politicians and banks: Our political leaders borrow ever more money to pay off the banks, which return the favor by lending ever-more money back to our governments, keeping the scheme afloat.
In a true market economy, bad choices get penalized. Not here. When the inevitable failure of overindebted euro-zone countries came to light, a secret pact was made.
Instead of accepting losses on unsound investments—which would have led to the probable collapse and national bailout of some banks—it was decided to transfer the losses to taxpayers via loans, guarantees and opaque constructs such as the European Financial Stability Fund, Ireland's NAMA and a lineup of special-purpose vehicles that make Enron look simple. Some politicians understood this; others just panicked and did as they were told.
The money did not go to help indebted economies. It flowed through the European Central Bank and recipient states to the coffers of big banks and investment funds.
Further contrary to the official wisdom, the recipient states did not want such "help," not this way. The natural option for them was to admit insolvency and let failed private lenders, wherever they were based, eat their losses.
That was not to be. As former Finance Minister Brian Lenihan recently revealed, Ireland was forced to take the money. The same happened to Portuguese Prime Minister José Sócrates, although he may be less forthcoming than Mr. Lenihan about admitting it.
Two Alternative and More Meaningful Measurements of GDP
by Rob Arnott of Agora Financial:
Gross Domestic Product is used to measure a country’s economic growth and standard of living. It measures neither. Unfortunately, the finance community and global centers of power are wedded to a measure that bears little relation to reality, because it confuses prosperity with debt-fueled spending.
Washington is paralyzed by fears that any withdrawal of stimulus, whether fiscal or monetary, whether by the Administration, the Fed, or the Congress, may clobber our GDP. And they’re right. But, GDP is the wrong measure.
Without an alternative, we will continue to make bad policy choices based on bad data. Eventually, our current choices may wreak havoc with our future prosperity, the future purchasing power of the dollar, and the real value of U.S. stocks and bonds.
What is GDP?
GDP is consumer spending, plus government outlays, plus gross investments, plus exports minus imports. With the exception of exports, GDP measures spending. The problem is GDP makes no distinction between debt-financed spending and spending that we can cover out of current income.Consumption is not prosperity. The credit-addicted family measures its success by how much it is able to spend, applauding any new source of credit, regardless of the family income or ability to repay. The credit-addicted family enjoys a rising “family GDP”—consumption—as long as they can find new lenders, and suffers a family “recession” when they prudently cut up their credit cards.
In much the same way, the current definition of GDP causes us to ignore the fact that we are mortgaging our future to feed current consumption. Worse, like the credit-addicted family, we can consciously game our GDP and GDP growth rates—our consumption and consumption growth—at any levels our creditors will permit!
Consider a simple thought experiment. Let’s suppose the government wants to dazzle us with 5% growth next quarter (equivalent to 20% annualized growth!). If they borrow an additional 5% of GDP in new additional debt and spend it immediately, this magnificent GDP growth is achieved! We would all see it as phony growth, sabotaging our national balance sheet—right? Maybe not. We are already borrowing and spending 2% to 3% each quarter, equivalent to 10% to 12% of GDP, and yet few observers have decried this as artificial GDP growth because we’re not accustomed to looking at the underlying GDP before deficit spending!
From this perspective, real GDP seems unreal, at best. GDP that stems from new debt—mainly deficit spending—is phony: it is debt-financed consumption, not prosperity. Isn’t GDP, after excluding net new debt obligations, a more relevant measure? Deficit spending is supposed to trigger growth in the remainder of the economy, net of deficit-financed spending, which we can call our “Structural GDP.” If Structural GDP fails to grow as a consequence of our deficits, then deficit spending has failed in its sole and singular purpose.1
Of course, even Structural GDP offers a misleading picture. Our Structural GDP has grown nearly 100-fold in the last 70 years. Most of that growth is due to inflation and population growth; a truer measure of the prosperity of the average citizen must adjust for these effects. Accordingly, let’s compare real per capita GDP with real per capita Structural GDP.
A New Measure of Prosperity
Real per capita GDP has recovered to within 2.5% of the 2007 peak of $48,000 (in 2010 dollars). So, why do we feel so bad? For one thing, after two recessions, we’re up barely 6% in a decade. Furthermore, this scant growth is entirely debt-financed consumption. The real per capita Structural GDP, after subtracting the growth in public debt, remains 10% below the 2007 peak, and is down 5% in the past decade. Net of deficit spending, our prosperity is nearly unchanged from 1998, 13 years ago.As a diagnostic for why this has happened, let’s go one step further. Few would argue that a healthy economy can grow without the private sector leading the way. The real per capita “Private Sector GDP” is another powerful measure that is easy to calculate. It nets out government spending—federal, state, and local. Very like our Structural GDP, Private Sector GDP is bottom-bouncing, 11% below the 2007 peak, 6% below the 2000–2003 plateau, and has reverted to roughly match 1998 levels.
Figure 1 illustrates the situation. Absent debt-financed consumption, we have gone nowhere since the late 1990s.
Figure 1. Real GDP, Structural GDP, and Private Sector GDP, Per Capita, 1944-2011

Source: Research Affiliates
As the private sector has crumbled, and Structural GDP has lost 13 years of growth, tax receipts have collapsed. Real per capita federal tax receipts have tumbled to levels first achieved in 1994, and are fully 25% below the peak levels of 2000.2 The 2000 peak in tax receipts was, of course, bolstered by unprecedented capital gains tax receipts following the wonder years of the 1990s. But this surge in tax receipts fueled a perception—even in a Republican-dominated government!—that there was money to burn, as if the capital gains from the biggest bull market in U.S. stock market history would continue indefinitely!
What does this mean for the citizens and investors in the world’s largest economy? If we continue to focus on GDP, while ignoring (and even facilitating) the decay of our Structural GDP and our Private Sector GDP, we’ll continue to borrow and spend, mortgaging our nation’s future. The worst case result could include the collapse of the purchasing power of the dollar, the demise of the dollar as the world’s reserve currency, the dismantling of the middle class, and a flight of global capital away from dollar-based stocks and bonds.
None of these consequences is likely imminent. But, few would claim today that they are impossible. Most or all of these consequences can likely still be avoided. But, not if we hew to the current path, dominated by sheer terror at the thought of a drop in top-line GDP.
After World War II, the U.S. Government “downsized” from 43.6% of GDP to 11.6% in 1948 (under a Democrat!). Did this trigger a recession? Measured by GDP, you bet! From 1945 to 1950, the nation convulsed in two short sharp recessions as the private sector figured out what to do with all the talent released from government employment, and real per capita GDP flat-lined. But, underneath the pain of two recessions, a spectacular energizing of the private sector was underway. From the peak of government expenditure in 1944 until 1952, the per capita real Structural GDP, the GDP that was not merely debt-financed consumption, soared by 87%; the Private Sector GDP, in per capita real terms, jumped by more than 90%.
Was the recent 0.5% drop in GDP in the United Kingdom a sign of weakness, or was this drop merely the elimination of 0.5% of debt-financed GDP that never truly existed? Spending dropped by over 1% of GDP; Structural GDP was finally improving!
We must pay attention to the health—or lack of same—for our Structural GDP and our Private Sector GDP before they lose further ground.
Conclusion
Government outlays were not reined in by either political party for most of the past decade. Real per capita government outlays now stand some 50% above the levels of just 10 years ago, even with Structural GDP and Private Sector GDP down over the same span. Federal spending is more than 40% of the Private Sector GDP for the first time since World War II.Even our calculation of the national debt burden (debt/GDP) needs rethinking. Is the family that overextends correct in measuring their debt burden relative to their income plus any new debt that they have accumulated in the past year? Isn’t it more meaningful to compute debt relative to Structural GDP, net of new borrowing?! Our National Debt, poised to cross 100% of GDP this fall, is set to reach 112% of Structural GDP at that same time, even without considering off-balance-sheet debt.3 Will Rogers put it best: “When you find yourself in a hole, stop digging.”
While many cite John Maynard Keynes as favoring government spending during a recession, he never intended to create structural deficits. He recommended that government should serve as a shock absorber for economic ups and downs. He prescribed surpluses in the best of times, with the proceeds serving to fund deficits in the bad times, supplemented by temporary borrowings if necessary. And he loathed inflation and currency debasement, which he correctly viewed as the scourge of the middle class.
GDP provides a misleading picture and a false sense of security. Instead of revealing an economy that we all viscerally know is weaker than a decade ago, it suggests an economy that is within hailing distance of a new peak in prosperity for the average American. Top-line GDP has recovered handily from its lows, on the back of record debt-financed consumption. But, our Structural GDP and Private Sector GDP are both floundering. Focusing on top-line GDP tempts us all to rely on ever more debt-financed consumption, until our lenders say “no más.”
The cardiac patient on the gurney has had his shot of adrenaline and is feeling better, but he is still gravely ill—more so than before his latest heart attack—as these two simple GDP measures amply demonstrate.
Endnotes
1. A “correct” measure would subtract all new debt that is backed only by future income, lacking collateral. Very little private debt lacks collateral, and very little public debt is backed by anything other than future income. So, for simplicity’s sake in this article, we subtract only net new government debt.2. Despite no change in tax rates since 2003, this situation is often blamed on the perfidy of the affluent, not the evaporation of capital gains, hence capital gains taxes. We should recognize that the enemy is not success, it is poverty. But, when we rue the latter, we too often blame the former.
3. See the November 2009 issue of Fundamentals, entitled “The ‘3-D’ Hurricane Force Headwind,” for more details on the daunting levels of off-balance-sheet debt. Our debt/GDP ratio may be poised to cross 100% of GDP this fall, but our GAAP accounting debt burden is already well past 400% of GDP and well past 500% of Structural GDP.
Subscribe to:
Posts (Atom)