Wednesday, October 3, 2012

Tuesday, October 2, 2012

Deficit Rose In FY 2012
This quote, in Dr. John Hussman's weekly market commentary, seemed particularly apropos to this thread (emphasis mine):
"Here in the U.S., the federal government is running a deficit approaching 10% of GDP despite suppressed interest costs.
If addressing that deficit was just a political issue of doing the
“right thing,” what would that right thing be? With total federal
revenues at $2.3 trillion last year, and spending at $3.7 trillion, the gap itself represents more than half of total revenues and more than a third of total spending. That gap will not be closed even if lawmakers were to agree to an immediate repeal of the Bush tax cuts
in their entirety. Assuming that all of the desired revenue actually
showed up, the bump to revenues would only be about $100 billion a year -
reducing the deficit by less than one-tenth. In the event of a
recession (which we believe is already in progress), the increase in
government debt - merely as a passive cyclical response to economic
weakness – would swamp that effect even if all the tax cuts were
repealed. Likewise, even in the current budget, less than $1.3 trillion
represents discretionary spending that is negotiated between the
President and Congress. The other spending represents mandatory outlays
for Social Security, Medicare, military retirement, and so forth. Well
over half of discretionary spending represents military spending. To
balance the budget with spending cuts, Congress would have to wipe out
discretionary spending altogether, including military outlays.
Observers who believe that the fiscal cliff is simply a matter of
political disagreement have vastly underestimated the depth of the
challenges here."
Let the magnitude of that sink in! Think, for
example, of the implications of the fact that our deficit is now equal
to more than HALF of all revenues. If the politicians were serious about
closing our deficits, they would have to nearly DOUBLE the income tax
not merely on the wealthy, but on EVERYONE -- overnight! Are you willing
to double your tax payments in order to sustain this level of spending?
The whole "tax the rich" mantra is nothing but a useless ruse to
distract us from an approaching disaster! It wouldn't make enough dent
in our deficit to significantly reduce our debt accumulation or to stave
of an economic disaster! Unfortunately, even the election of someone
with the experience and economic know-how of Mitt Romney may not be able
to save us from a rapidly-approaching day of economic reckoning! Still,
I'd rather see him in the White House than the charlatan and master of
beguilement and legerdemain who is there now!
Another important point Hussman makes:
Imagine that, folks! In our current state of affairs, entitlements are considered by politicians to be mandatory outlays, while defense and our military are considered to be "discretionary spending". How truly twisted is that? How ironic that the only one that is authorized in our Constitution as required is the spending for national defense, but the only item the politicians
consider to be "mandatory" is entitlements. If that isn't an indicator
of how topsy turvy things are in Washington, I don't know what is!
The
point, of course, of Dr. Hussman's discussion about the magnitude of
our debt and our "deficit gap" is that we are on an unsustainable path
even in the short-term! I want to puke every time I hear someone say,
"we're leveraging the future of our children and grandchildren", because
it creates the false impression that this "day of reckoning" is one
that is still perhaps decades away. It's not! We are very likely facing a
calamity that would rival those stories in the Old Testament within the
next 4-year presidential cycle -- NOT during the lifetimes of the young
and not-yet-born! If we think we can evade having to deal with this
crisis by kicking the can for a decade or two with the attitude that "as
long as I get mine, what do I care?", then we are soon going to
experience a very rude awakening to that mindset of lethargy and
complacency!
You can read all of Dr. Hussman's weekly commentary by clicking on this sentence.
It's worth the time it takes to read it! I consider it a must read
every Monday morning! He is one of the leading economic writers and
theoreticians living today. He studied with some of the best! He now
runs a series of mutual funds. He's no mere ivory tower academic! (Did
you read that, "Dr." Bernanke?)
Dr. Hussman, by the way, has also
commented in recent months about the magnitude of inflation headed our
way if the Bernanke Fed doesn't unwind its debt monetization scheme. He
uses mathematical formulas to compute the kind of inflation that will
ensue if the Fed doesn't "undo" what it has done before the
velocity of money spikes. He estimated BEFORE the recent "QE to
infinity" announcement by the Fed (a couple of weeks ago) that an
inflation rate of 30+% would result from the Fed's QE1, QE2, and
Operation Twist. Imagine the consequences of inflation of that
magnitude! And Bernanke has only doubled down since!
If Bernanke
thought he could fight that kind of inflation by raising interest rates
to a level necessary, he would bankrupt the US Treasury with the
interest costs on all of our debt! When we hit this debt brick wall
within the next couple of years, it will impact every living American in
ways that are both unimaginable and incalculable. We had best prepare
ourselves! This brick wall may very well usher in what, in our future,
we might very well refer to as the GREATER Depression, putting it into
perspective with what Mr. Bernanke considers to be his special realm of
study, what we have all come to know as the earlier "Great" Depression
of the 1930s and 1940s!

Monday, October 1, 2012

Sunday, September 30, 2012
Cocoa Too!
NEW YORK/LONDON: US cocoa futures marked their biggest quarterly jump in
three years on Friday, capping a volatile session that lifted the
market a lofty $95 within the first minute of trade, while raw sugar was
on track to finish the third quarter down 10 percent.
The price of cocoa has been up all summer, and this only makes matters worse!
Grains Post Broad Gains on Short Supply
CHICAGO: US corn futures surged by the daily trading limit on Friday,
adding 5.6 percent after the government said end-of-season stocks fell
by a greater-than-anticipated 12 percent from a year ago, dipping below 1
billion bushels for the first time in 8 years.
Wheat futures
jumped more than 4 percent, the strongest gain in 2-1/2 months, as the
US Department of Agriculture said Sept. 1 stocks declined year-on-year,
counter to trade expectations for an increase.
Soybeans followed
corn higher, although gains in nearby contracts were tempered by a
smaller-than-expected drop in ending stocks.
"The (ending stocks)
number was bullish for the corn market, it was at the low end of
estimates," said Sterling Smith, futures specialist for Citigroup.
"A
sub-one-billion (bushel) number is enough to get the market nervous.
Combine that with the market getting oversold the past month and it's
leading to pretty good gains," he said.
The US corn stockpile was
11 percent below analysts' expectations at 988 million bushels, USDA
said on Friday in a surprising report that presaged razor-thin supplies
for the third year in a row.
USDA also said its survey of farmers
and warehouses showed the soybean stockpile at the Sept 1 start of this
marketing year was 29 percent, or 38 million bushels, larger than what
traders had expected.
Wheat stocks also were surprisingly low, coming in eight percent below trade estimates.
"(Corn)
feed use in the fourth quarter was bigger than people had thought so
we're going to hear talk that we're going to do a better job of
rationing in the feed sector. That's not so easy to do," Said Don Roose,
president of US Commodities.
December corn futures on the Chicago
Board of Trade surged 40 cents, or 5.6 percent, to $7.56-1/4 a bushel
by 10:29 a.m. CDT (1429 GMT) after dipping to a three-month low of $7.05
before the report. It was the steepest rally for a spot month contract
since July 5.
Corn futures were on pace for the first weekly gains in four weeks.
CBOT
December wheat climbed 40 cents to $8.95-1/2 a bushel, a 4.7 percent
gain that was the largest for a front-month contract since July 16.
November
soybeans were up 6-1/2 cents, or 0.4 percent, at $15.77-1/4 a bushel.
Still, the front-month soybean contract was poised for their second
consecutive weekly decline and the steepest two-week drop in nearly a
year.
Copyright Reuters, 2012
Feeder Cattle Limit Down

from Business Recorder:
CHICAGO: CME feeder cattle plunged by their 3-cent daily trading limit on Friday after corn stocks forecasts from the US Department of Agriculture came in short of expectations, driving corn prices up their 40-cent per bushel limit while boosting feed input costs, analysts and traders said.
Good Summary of Friday's Markets
from Investor's Business Daily:
Gold and silver prices dipped Friday as the dollar strengthened
against global currencies on safe-haven buying that followed
disappointing U.S. consumer sentiment and purchasing managers data. An
economist warns a recession could lead to a meltdown in precious metals
despite all the bullishness from global stimulus programs.
Spot gold prices shed 0.23% to $1774 an ounce intraday. During the
quarter, it reached its highest price of 2012 and came within six
percentage points of its all-time nominal high from 12 months ago.
This month Prestige Economics of Austin, Texas, raised its 2012 price
target on the yellow metal to $1,684 an ounce from $1,649 per ounce. It
also raised its 2013 target to $1,900 from $1,750 an ounce.
"The introduction of the European Central Bank's Outright Monetary
Transactions (OMT) and the implementation of the Federal Reserve's
quantitative easing ad infinitum greatly improved the prospects that our
forecast of dollar weakness will come to fruition at a swift pace,"
Jason Schenker, president of Prestige wrote in his latest monthly
outlook released Friday. "The downside risks to gold prices have been
greatly reduced now that the Fed is on an endless buying spree of
mortgage-backed securities (MBS)."
Gold prices are rising on expectations that central banks pumping up
global money supply will spark inflation. The U.S. and European stimulus
programs led to a domino effect at central banks around the world.
Japan and China have started their quantitative easing. India and
Brazil lowered interest rates to spur growth. Singapore says it's ready
to take action if needed.
"We have a global currency war where everyone is trying to devalue
their currencies. In that case the only real currency is gold or
silver," said Matthew Tuttle of Tuttle Wealth Management in Stamford,
Conn. with about $100 million in assets.
Central banks in Russia, China, India and other countries are buying
gold to diversify their reserves. Political conflict, such as that
between China and Japan and in the Middle East, has also traditionally
been positive for gold.
Why Gold Could Lose Its Luster
The Fed's newly created trillions are parked in bond portfolios at
banks instead of being lent out as intended, says John Browne, senior
economic consultant to Euro Pacific Capital in Westport, Conn. The newly
printed money isn't fueling inflation as gold buyers expect. And if the
U.S. goes into a recession, gold investors may sell their gold to raise
cash and meet margin calls ignited by falling stock prices.
"In recessions, cash becomes increasingly scarce and real assets,
including commodities, fall in price," Browne wrote in a client note.
"As a commodity, gold should fall in price as recession becomes
manifest."
"The possibility is rising of a worldwide recession, which normally
tends to push down asset prices, particularly for stocks dependent on
corporate earnings," he added.
PowerShares DB US Dollar Index Bullish (UUP),
measuring the dollar against a basket of foreign currencies, rose
inched up 0.39% to 21.90 Friday. It shed 1.8% in September and fell 2.5%
for third quarter.
SPDR Gold Shares (GLD) shed 0.69% to 171.64 Friday. It climbed 4.5% in September and 10.6% for the quarter.
Market Vectors Gold Miners ETF (GDX) fell 0.20% to 53.68. GDX surged 12% in September and 20% in Q3.
Silver Prices
Spot silver prices fell 0.38% to $34.63 an ounce.
Schenker projects silver prices will average $31 an ounce in 2012 and $34.50 in 2013.
IShares Silver Trust (SLV) gave back 0.28% to 33.30 on Friday. It added 8.2% for the month and a robust 25% for the quarter.
Global X Silver Miners ETF (SIL) let up 0.14% to 24.93. SIL returned 16.3% in September and a whopping 34% in the third quarter.
Mutual funds specializing in gold and precious metals absorbed more
than 90% of the $1.6 billion that flowed into commodity sector funds
last week on fears that global stimulus programs will erode the value of
fiat currencies, according to EPFR Global.
Economic Releases
The Institute for Supply Management-Chicago said its business
barometer fell to 49.7 from 53 in August. Economists expected a reading
of 52.8. It dropped for the first time in three years, signaling
contraction. Readings below 50 mean contraction, and readings above it
mean expansion.
The Thomson Reuters/University of Michigan Consumer Sentiment Index
rose to 78.3 this month from 74.3 in August. Economists projected a
reading of 79.


Dairy Prices Skyrocketing
The cost of feeding dairy cattle is skyrocketing, and so are dairy futures. This is the price of Class III milk futures since April. Ouch!

Grain Prices Leap On Sorry USDA Report; Food Prices to Follow!
CHICAGO (AP) — Grains futures rose Friday on the Chicago Board of Trade.
Wheat for December delivery jumped 47 cents to $9.0250 a bushel;
December corn rose 40 cents to $7.5625 a bushel; December oats rose 2.25
cents to $3.7050 a bushel; while November soybeans rose 30.25 cents to
$16.01 a bushel.

Friday, September 28, 2012
Stocks Decline on Economic Weakness
from Bloomberg:
Stocks Drop on Economy Data as Gasoline Jumps on Supplies
By Will Hadfield and Michael P. Regan -
2012-09-28T18:37:33Z
The Standard & Poor’s 500 Index slipped 0.4 percent to 1,440.91 at 2:32 p.m. in New York and is down 1.3 percent this week...
Benchmark U.S. stock indexes extended weekly declines as the Institute for Supply Management-Chicago Inc. said its business barometer fell to 49.7 this month from 53 in August. A reading of 50 is the dividing line between growth and contraction.
Wednesday, September 26, 2012


Tuesday, September 25, 2012
What If the Fed Has It Wrong?
This is the 4th major intervention from the Fed since 2009, each one apparently
inflating asset prices without having a definitive impact on the
economy other than, most importantly, preventing a lethal debt-deflation
spiral.
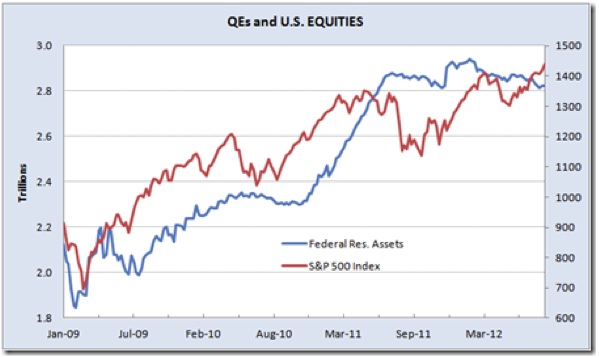
The chart above is used extensively to illustrate the close relationship between QEs and equity prices. Hence investors' Pavlovian reaction to last week's FOMC announcement of an open-ended and unlimited money printing program. Virtually every asset class rose, giving credence to Ben Bernanke's attempt to create a stimulating wealth effect.
What if the Fed has it all wrong?
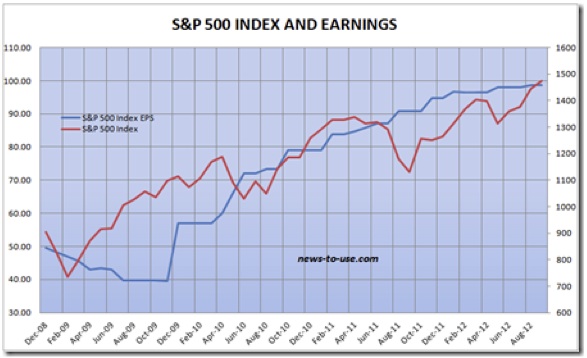
Correlation does not imply causation. Could there be another reason for the spectacular rise in equity prices since 2009? Let's try earnings, just in case that intuitive, time-tested, relationship might still be working:
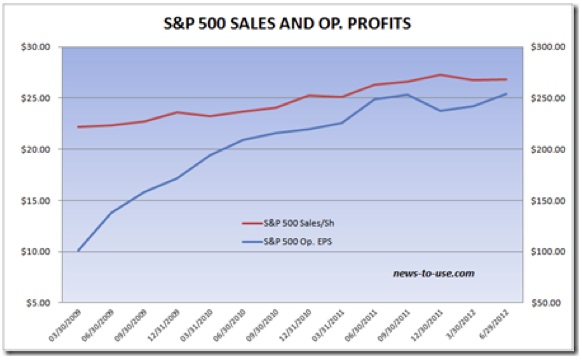
If there were a direct link between QEs and corporate profits, it should be apparent in S&P 500 company revenues. Yet, Index sales have only grown 16.5% during the last 3.5 years, nothing close to the 60% jump in Fed assets. Given that the Fed is now totally focused on growing employment, I doubt that it would take credit for the spectacular jump in profit margins since 2009, since most of it emanated from cost cutting (mostly labor) and rising productivity.
Some recent facts point to weaker earnings ahead:
• Quarterly sales and earnings have peaked in the last 9-12 months.
• Corporate profit margins are at an all-time high.
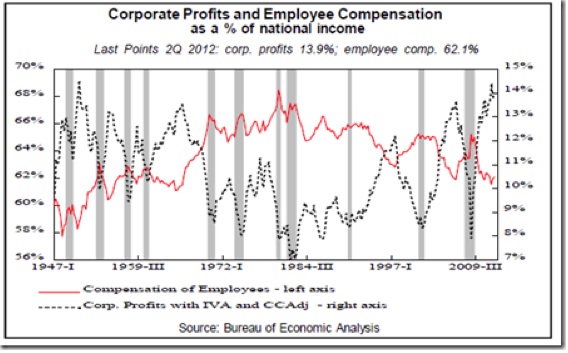
It is therefore dangerous to assume that margins will expand any further. From now on, corporations need to increase sales in order to grow their earnings. Unfortunately, demand is waning.
American wages, currently at a 50-year low as a percentage of GDP, are rising very slowly, so slowly that it is hampering consumer spending and the overall economy. At the time of previous QEs, also designed to create a wealth effect, wages were rising at a much faster clip than today. Furthermore, real wages were rising during 2009 and 2010, partly offsetting slow employment growth.
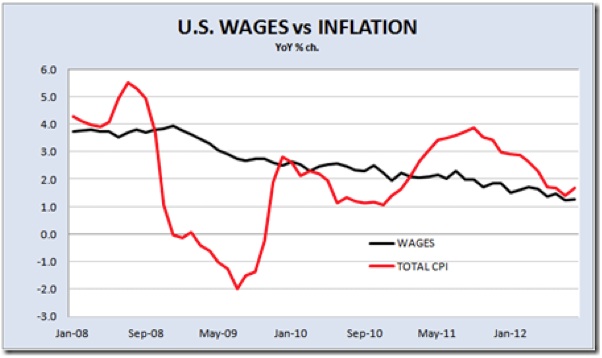
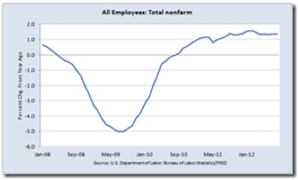
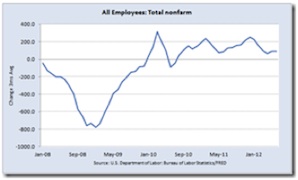
Today, employment growth remains below 1.5% YoY, a rate insufficient to reduce unemployment. Nominal wages are growing 1.2% while inflation is 1.7% and threatens to accelerate, in large part due to the impact that the Fed's actions are having on commodity prices, particularly oil prices.
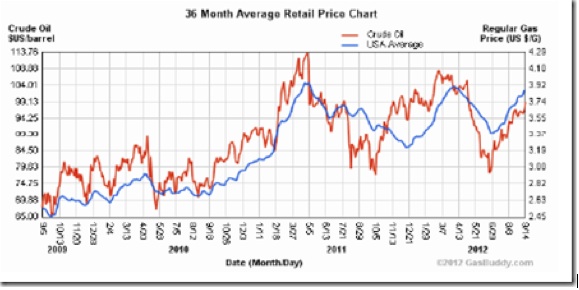
The US economy got lucky in 2011, when gasoline prices dropped 18% to $3.20/gal. just in time for the back-to-school season and Christmas. It's luck extended into 2012, when the U.S. experienced an extraordinarily warm winter. Unless something else extraordinary happens soon (SPR releases?), the exact opposite will happen to oil prices. Gasoline has jumped 16% since July, adding to the squeeze just as we enter the most important shopping period of the year (chart below from gasbuddy.com).
The following chart plots the Fed's printing with commodity prices. Unlike the relationship with equity prices, it is difficult to find anything other than excess financial liquidity to explain the spectacular rise in commodity prices. Considering how world economies have been doing lately, why is it that commodity prices have not declined significantly?
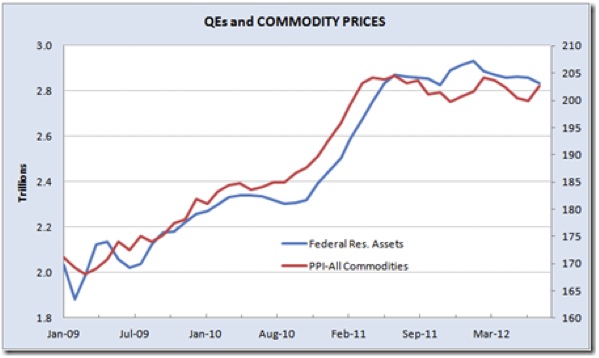
The Fed's balance sheet is set to grow another $800 billion by the end of 2013, the same amount it has increased since 2009, a period during which commodity prices jumped 20%.
The Fed wants to grow employment faster, but jobs don't grow out of thin air. Corporations create jobs when they have the means, they see a need, and there is visibility to commit. Needless to say, the last two conditions are far from being met these days. The Fed can't offset negative US politics, the European mess, nor the Chinese slowdown.
Bringing mortgage rates down further might help the slowly recovering housing sector and restart construction employment, but low wages and rising inflation remain a problem that might be perversely aggravated by the very actions the Fed is taking.
Wages are not about to accelerate, but inflation and taxation are problematic. If the American consumer can't spend, who will provide the needed spark?
If so, trailing 12-month EPS peaked last quarter and will decline in Q3. The earnings tailwind has disappeared.
There have been eight periods since 1935 when equities have risen in the face of declining earnings (see Banking [Betting] On Bankers?). In all cases, inflation declined along with earnings.
The dependable Rule of 20 says that "Fair trailing P/E = 20 minus inflation." Lower inflation begets higher P/Es. A fair P/E is thus 18.3 at the current 1.7% inflation level, 23% above the current 14.8x P/E, pointing to 1800 as fair value on the S&P 500, based on trailing EPS of $98.69. If this undervaluation is narrowed by the liquidity pumped out by the Fed, could it create enough wealth effect to push US consumers into a spending spree, in spite of negative real labor income growth?
The problem with Bernanke's wealth effect thesis lies with the new reality in America. Income and assets have lately been so significantly redistributed that only a tiny few actually feel a wealth effect from rising equity prices. Here are some sad facts:
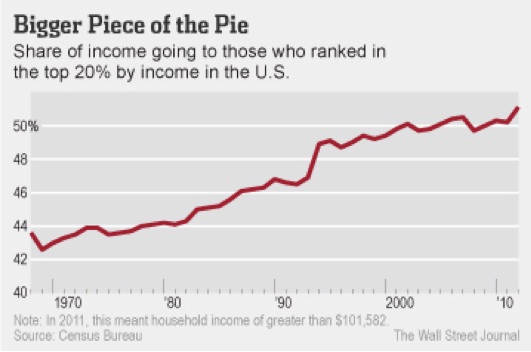
• Last year, the top 20% of households took in 51.1% of all income in 2011, up from 50.2% in 2010 and the highest share since at least 1967, according to the Census Bureau. After the top, each quintile of income earners saw their share of income decrease, with the biggest drop among middle-income earners. The middle fifth of households took in 14.3% of all income last year. (WSJ)
• In 2007, the top 20% of income earners had 53% of their financial holdings in stocks (directly and indirectly), down from 59% in 2001. Middle-income earners had 38% of their financial assets in stocks in 2007, down spectacularly from 47% in 2001.
• Stock holdings have obviously declined since 2007:

• US house values remain 30% below their 2006 peak level and now match their 2003 level.
• Total residential mortgage debt has only declined 7.5% since 2008. Some 1.5 million homes are in foreclosure, but 10.8 million homes remain in negative equity.
The "wealthy few" may feel wealthier if stocks advance, but they could nevertheless have much less after-tax income to spend when politicians finally address the looming fiscal cliff nestled within the rapidly growing mountain of debt.
Keep in mind that it is these wealthy people who run American corporations, keeping them lean and mean and flush with cash. They remember how profits literally disappeared in 18 months in 2007-08. They remember how financial markets totally froze in 2008. They see the humongous budget deficits and the debt piling on, and the not-so-distant day of reckoning. They realize that all the Qes in the world can't offset inept and irresponsible politicians on either side of the Atlantic. Yet, they are the ones targeted by the so-called wealth effect!
Call that pushing on a golden string.
Meanwhile, the less affluent, the other 80% – some 250 million people – are little concerned by an eventual wealth effect but highly, directly, and immediately impacted by the side effects of all these QEs, namely rising commodity prices and near-zero interest rates. Consider that:
• 15% of the US population lives in poverty.
• 44% of those 46.2 million poor Americans are in "deep poverty," which is half the level of the poverty line, defined as $22,811 for a family of four.
• More than 45 million Americans are in the food-stamps program, which is 15% of the population, compared with the 7.9% participation from 1970-2000. Food-stamps enrollment has been rising at a rate of 400,000 per month over the past four years. Just last month (August), nearly twice as many people went on the food-stamps program (173,000) than managed to find a new job (96,000).
• More than 11 million Americans are collecting federal disability checks.
• 11.2% of the labor force is out of work, if we include the 7 million people no longer seeking employment. This number (over 17 million workers) is unchanged since 2009.
• Full-time employment remains 1.4 million below its 2009 level. Needless to say, part-timers earn and spend considerably less.
• Most of the 43.5 million American retirees must cope with nominal interest rates, near zero through 2015, when inflation is around 2.0%.
Call that pushing on a chafed string.
Will professional investors drive equities higher?
The risk here is that, much like businesspeople, investors may remain cautious, given the numerous and highly complex difficulties the US and the world are facing. They will also consider that, at the time of previous QE program launches, equity markets were similarly undervalued, but many economic trends were then more positive:
• Earnings were in a strong uptrend on rising margins.
• Oil prices were much lower.
• US real wages were rising (not in 2011).
• The 2011-12 winter was one of the mildest on record in the US.
• Europe was not in recession.
• China was still growing strongly.
Interestingly, the undervaluation of equities, as measured by the Rule of 20, narrowed from 40% to 0% during QE1, from 23% to 7% during QE2, and from 19% to 14% during Operation Twist (see the black line in chart below). The recent rally has narrowed the undervaluation from 27% to 19%. It would be very surprising if we got near fair value anytime soon. If 10% undervaluation (average of QE2 and OT) is the best we can hope for, the resulting 16.5 P/E (90% of 20 minus 1.7% inflation) brings the S&P 500 to 1625, just about 10% above current levels.
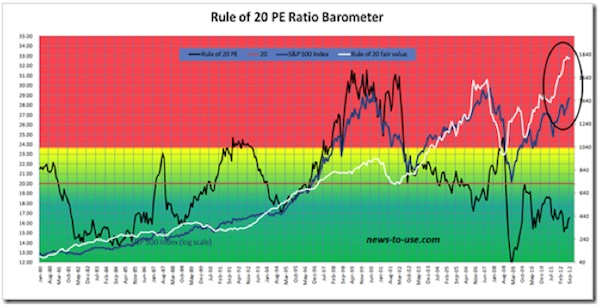
That assumes that inflation stays constant at 1.7% YoY. However, gasoline prices are +7% YoY in September, after rising 1.8% in August.. If they remain unchanged until year-end, gas prices will be +18% YoY. Not only would that considerably disrupt Christmas sales, it would also help raise inflation (gasoline is 5.5% of the CPI, energy is 9.7%). If inflation rises to 2.0%, a 10% undervaluation would get the S&P 500 Index to 1565, a mere 6% above current levels.
If the Fed has it all wrong, simply pushing on golden or chafed strings, and the only effect of QE3 is to boost inflation, only God(ot) knows what will happen.
While the Fed waits for the wealth effect to take effect, the European Central Bank is also waiting for its own Godot, following Draghi's magic with the ECB rules and regulations. Super Mario's "whatever it takes" promise is powerful but not without pitfalls:
• When, if ever, will the eurozone achieve the necessary banking and fiscal unions?
• Will Spain and Italy surrender before it is too late?
• Will ever more austerity finally work?
• When will the debt spiral stop?
• How much longer will the Germans put up with the situation, accepting that the ECB ruins its balance sheet by taking on unlimited risk on behalf of the German taxpayers, risking their fiscal sovereignty to save the "reckless Southerners"?
• How much longer will the hordes of unemployed young Europeans put up with the situation?
Central bankers have indeed delivered. In truth however, they are merely experimenting with totally unproven ways and means, hoping to gain enough time until more responsible politicians emerge. Given the significant risks still facing us until Godot shows up, investors should await more evidence that either earnings will resume their uptrend or some kind of miracle will happen.
Equity holdings should be trimmed to conservative levels. Sustainable income should be favored. Cash earns essentially nothing but is safe for now. Gold remains attractive for many, many obvious reasons.
The chart above is used extensively to illustrate the close relationship between QEs and equity prices. Hence investors' Pavlovian reaction to last week's FOMC announcement of an open-ended and unlimited money printing program. Virtually every asset class rose, giving credence to Ben Bernanke's attempt to create a stimulating wealth effect.
What if the Fed has it all wrong?
Correlation does not imply causation. Could there be another reason for the spectacular rise in equity prices since 2009? Let's try earnings, just in case that intuitive, time-tested, relationship might still be working:
If there were a direct link between QEs and corporate profits, it should be apparent in S&P 500 company revenues. Yet, Index sales have only grown 16.5% during the last 3.5 years, nothing close to the 60% jump in Fed assets. Given that the Fed is now totally focused on growing employment, I doubt that it would take credit for the spectacular jump in profit margins since 2009, since most of it emanated from cost cutting (mostly labor) and rising productivity.
Some recent facts point to weaker earnings ahead:
• Quarterly sales and earnings have peaked in the last 9-12 months.
• Corporate profit margins are at an all-time high.
It is therefore dangerous to assume that margins will expand any further. From now on, corporations need to increase sales in order to grow their earnings. Unfortunately, demand is waning.
American wages, currently at a 50-year low as a percentage of GDP, are rising very slowly, so slowly that it is hampering consumer spending and the overall economy. At the time of previous QEs, also designed to create a wealth effect, wages were rising at a much faster clip than today. Furthermore, real wages were rising during 2009 and 2010, partly offsetting slow employment growth.
Today, employment growth remains below 1.5% YoY, a rate insufficient to reduce unemployment. Nominal wages are growing 1.2% while inflation is 1.7% and threatens to accelerate, in large part due to the impact that the Fed's actions are having on commodity prices, particularly oil prices.
The US economy got lucky in 2011, when gasoline prices dropped 18% to $3.20/gal. just in time for the back-to-school season and Christmas. It's luck extended into 2012, when the U.S. experienced an extraordinarily warm winter. Unless something else extraordinary happens soon (SPR releases?), the exact opposite will happen to oil prices. Gasoline has jumped 16% since July, adding to the squeeze just as we enter the most important shopping period of the year (chart below from gasbuddy.com).
The following chart plots the Fed's printing with commodity prices. Unlike the relationship with equity prices, it is difficult to find anything other than excess financial liquidity to explain the spectacular rise in commodity prices. Considering how world economies have been doing lately, why is it that commodity prices have not declined significantly?
The Fed's balance sheet is set to grow another $800 billion by the end of 2013, the same amount it has increased since 2009, a period during which commodity prices jumped 20%.
The Fed wants to grow employment faster, but jobs don't grow out of thin air. Corporations create jobs when they have the means, they see a need, and there is visibility to commit. Needless to say, the last two conditions are far from being met these days. The Fed can't offset negative US politics, the European mess, nor the Chinese slowdown.
Bringing mortgage rates down further might help the slowly recovering housing sector and restart construction employment, but low wages and rising inflation remain a problem that might be perversely aggravated by the very actions the Fed is taking.
Wages are not about to accelerate, but inflation and taxation are problematic. If the American consumer can't spend, who will provide the needed spark?
Higher P/E Ratios to the Rescue?
Earnings have stalled, corporations are cutting guidance, and analysts are busy revising their estimates downward. Q3'12 estimates have been cut 8% since March and are now below Q2 earnings, which are themselves coming in much lower than originally expected. Q3 earnings are now seen down YoY.If so, trailing 12-month EPS peaked last quarter and will decline in Q3. The earnings tailwind has disappeared.
There have been eight periods since 1935 when equities have risen in the face of declining earnings (see Banking [Betting] On Bankers?). In all cases, inflation declined along with earnings.
The dependable Rule of 20 says that "Fair trailing P/E = 20 minus inflation." Lower inflation begets higher P/Es. A fair P/E is thus 18.3 at the current 1.7% inflation level, 23% above the current 14.8x P/E, pointing to 1800 as fair value on the S&P 500, based on trailing EPS of $98.69. If this undervaluation is narrowed by the liquidity pumped out by the Fed, could it create enough wealth effect to push US consumers into a spending spree, in spite of negative real labor income growth?
The problem with Bernanke's wealth effect thesis lies with the new reality in America. Income and assets have lately been so significantly redistributed that only a tiny few actually feel a wealth effect from rising equity prices. Here are some sad facts:
• Last year, the top 20% of households took in 51.1% of all income in 2011, up from 50.2% in 2010 and the highest share since at least 1967, according to the Census Bureau. After the top, each quintile of income earners saw their share of income decrease, with the biggest drop among middle-income earners. The middle fifth of households took in 14.3% of all income last year. (WSJ)
• In 2007, the top 20% of income earners had 53% of their financial holdings in stocks (directly and indirectly), down from 59% in 2001. Middle-income earners had 38% of their financial assets in stocks in 2007, down spectacularly from 47% in 2001.
• Stock holdings have obviously declined since 2007:
• US house values remain 30% below their 2006 peak level and now match their 2003 level.
• Total residential mortgage debt has only declined 7.5% since 2008. Some 1.5 million homes are in foreclosure, but 10.8 million homes remain in negative equity.
The "wealthy few" may feel wealthier if stocks advance, but they could nevertheless have much less after-tax income to spend when politicians finally address the looming fiscal cliff nestled within the rapidly growing mountain of debt.
Keep in mind that it is these wealthy people who run American corporations, keeping them lean and mean and flush with cash. They remember how profits literally disappeared in 18 months in 2007-08. They remember how financial markets totally froze in 2008. They see the humongous budget deficits and the debt piling on, and the not-so-distant day of reckoning. They realize that all the Qes in the world can't offset inept and irresponsible politicians on either side of the Atlantic. Yet, they are the ones targeted by the so-called wealth effect!
Call that pushing on a golden string.
Meanwhile, the less affluent, the other 80% – some 250 million people – are little concerned by an eventual wealth effect but highly, directly, and immediately impacted by the side effects of all these QEs, namely rising commodity prices and near-zero interest rates. Consider that:
• 15% of the US population lives in poverty.
• 44% of those 46.2 million poor Americans are in "deep poverty," which is half the level of the poverty line, defined as $22,811 for a family of four.
• More than 45 million Americans are in the food-stamps program, which is 15% of the population, compared with the 7.9% participation from 1970-2000. Food-stamps enrollment has been rising at a rate of 400,000 per month over the past four years. Just last month (August), nearly twice as many people went on the food-stamps program (173,000) than managed to find a new job (96,000).
• More than 11 million Americans are collecting federal disability checks.
• 11.2% of the labor force is out of work, if we include the 7 million people no longer seeking employment. This number (over 17 million workers) is unchanged since 2009.
• Full-time employment remains 1.4 million below its 2009 level. Needless to say, part-timers earn and spend considerably less.
• Most of the 43.5 million American retirees must cope with nominal interest rates, near zero through 2015, when inflation is around 2.0%.
Call that pushing on a chafed string.
Betting on Bankers?
Now that US and European central banks have delivered the financial heroin needed to compensate for inept and irresponsible politicians, should we jump back in equities?Will professional investors drive equities higher?
The risk here is that, much like businesspeople, investors may remain cautious, given the numerous and highly complex difficulties the US and the world are facing. They will also consider that, at the time of previous QE program launches, equity markets were similarly undervalued, but many economic trends were then more positive:
• Earnings were in a strong uptrend on rising margins.
• Oil prices were much lower.
• US real wages were rising (not in 2011).
• The 2011-12 winter was one of the mildest on record in the US.
• Europe was not in recession.
• China was still growing strongly.
Interestingly, the undervaluation of equities, as measured by the Rule of 20, narrowed from 40% to 0% during QE1, from 23% to 7% during QE2, and from 19% to 14% during Operation Twist (see the black line in chart below). The recent rally has narrowed the undervaluation from 27% to 19%. It would be very surprising if we got near fair value anytime soon. If 10% undervaluation (average of QE2 and OT) is the best we can hope for, the resulting 16.5 P/E (90% of 20 minus 1.7% inflation) brings the S&P 500 to 1625, just about 10% above current levels.
That assumes that inflation stays constant at 1.7% YoY. However, gasoline prices are +7% YoY in September, after rising 1.8% in August.. If they remain unchanged until year-end, gas prices will be +18% YoY. Not only would that considerably disrupt Christmas sales, it would also help raise inflation (gasoline is 5.5% of the CPI, energy is 9.7%). If inflation rises to 2.0%, a 10% undervaluation would get the S&P 500 Index to 1565, a mere 6% above current levels.
If the Fed has it all wrong, simply pushing on golden or chafed strings, and the only effect of QE3 is to boost inflation, only God(ot) knows what will happen.
While the Fed waits for the wealth effect to take effect, the European Central Bank is also waiting for its own Godot, following Draghi's magic with the ECB rules and regulations. Super Mario's "whatever it takes" promise is powerful but not without pitfalls:
• When, if ever, will the eurozone achieve the necessary banking and fiscal unions?
• Will Spain and Italy surrender before it is too late?
• Will ever more austerity finally work?
• When will the debt spiral stop?
• How much longer will the Germans put up with the situation, accepting that the ECB ruins its balance sheet by taking on unlimited risk on behalf of the German taxpayers, risking their fiscal sovereignty to save the "reckless Southerners"?
• How much longer will the hordes of unemployed young Europeans put up with the situation?
Central bankers have indeed delivered. In truth however, they are merely experimenting with totally unproven ways and means, hoping to gain enough time until more responsible politicians emerge. Given the significant risks still facing us until Godot shows up, investors should await more evidence that either earnings will resume their uptrend or some kind of miracle will happen.
Equity holdings should be trimmed to conservative levels. Sustainable income should be favored. Cash earns essentially nothing but is safe for now. Gold remains attractive for many, many obvious reasons.
Monday, September 24, 2012
Confidence Collapse
I read last night that "Import and Export volumes for China, US, Japan, and Europe are starting to drop notably." (Zero Hedge)
Now, business confidence in Europe's strongest economy is falling also. Only in the delusional and deceived USA does confidence improve, despite terrible economic conditions.

Friday, September 21, 2012
More People Finding Food Stamps Than Jobs
An alarming data point from the minority side of the Senate Budget
Committee: More Americans are being added to food stamps than are
finding jobs. The data is detailed in this chart, provided by the
committee:

As the chart shows, between April-June 2012 (the most recent three
month block for which government data is available), only 200,000 jobs
have been created while 265,000 individuals have been added to the food
stamp rolls. Additionally, in that time period, 246,000 workers were
awarded disability.
Another chart shows that the last three month block is part of a
larger trend. The chart, also from the minority side of the Senate
Budget Committee, shows that "Workforce Shrinks Since January 2009 While
Millions Sign Up For Disability And Food Stamps."

As the chart shows, since January 2009, when President Barack Obama
took office, the net change jobs has been negative (-1.3 million), while
5.7 million workers and dependents have been awarded disability and a
whopping 15.1 million have been added to the food stamp rolls.
"A total of 46,670,373 Americans are now on food stamps," according
to the minority side of the Senate Budget Committee. "The food stamp
program has doubled in size since 2008 and quadrupled since 2001."
And the government program isn't cheap: "Spending on food stamps alone is projected to reach $770 billion over the next decade."
Thursday, September 20, 2012
Stocks Modestly Lower on Weak Economic Data
from WSJ:
NEW YORK—Stocks opened lower on signs of global economic weakening, as the U.S. posted worse than expected labor-market data...
Initial claims for jobless benefits in the latest week declined
slightly from the previous week, to 382,000. That was a smaller drop
than expected by economists, who expected a decline to 373,000.
"The data points to the fact that we're in a below-average, painfully
sluggish economy," said Hank Smith, chief investment officer of
Haverford Trust, a Radnor, Pa.-based firm with $6.5 billion under
management. "The market has come a long way recently, so it wouldn't be
surprising for it to take a pause here."
PMI data for China and Europe showed contraction also. However, the Dow is down only about 20 points. Wall St is pricing stocks for a miracle in Q3 and Q4.
Monday, September 17, 2012
Stocks Barely Blink As Empire Manufacturing Plunges
from Zero Hedge:
Today's horrible piece of news, which at
least on the surface was supposed to send the market soaring, comes
courtesy of the Empire Fed Manufacturing Index, which printed at
-10.41, the lowest print since April 2009, down from -5.85, and well
below expectations of -2.0. The Index print confirmed the biggest 6
month drop since records began. The components painted a dire picture
for jobs, with the employment index sliding from 16.47 to 4.26, New
Orders tumbling from -5.50 to -14.03, while, wait for it, prices rose,
from 16.47 to 19.15. Re-stagflation here we come. Market for now seems
confused - since QE is priced into infinity, it is unclear if this
latest datapoint confirming a recessionary economy, QE can't be more-er
infiniter. Best to not respond to this, or any other macro news at
all, which is precisely what the market has done. For those who missed
it, not only has Bernanke doomed the global economy to stagflation and
imminent food riots, while making the richest 0.001% richer than ever,
he has completely broken any linkage between the economy and the
market.
Subscribe to:
Posts (Atom)