Thursday, October 15, 2009

Economic Data; Stocks Uneasy, But Holding

CPI up .2%, more than expected, still modest
Foreclosure filings 928,000 for 3rd quarter
NY Manufacturing inched higher - Manufacturing activity in the New York area improved at the fastest pace in five years, the New York Federal Reserve Bank reported Thursday, while a similar report from the Philadelphia Fed indicated a slower pace of expansion.
Meanwhile, the Philly Fed's index fell to 11.5 in October from 14.1 in September, with 28% saying business had improved and 17% saying it had worsened. The decline was in line with expectations


Wednesday, October 14, 2009

What Happens When Money Becomes Worthless?
by Martin Hutchinson at PrudentBear.com:
The Financial Times last Tuesday noted a disturbing new trend – hedge fund and other investors are increasingly seeking to invest in physical commodities themselves, rather than in futures. Given the excess of global liquidity, this is not entirely surprising. It does, however, raise an ominous possibility of a supply shortage in one or more commodities, caused by investor demand that exceeds available mine output and inventory. That could potentially produce a collapse in economic activity similar to that from the 1837-41 and 1929-33 liquidity busts, but with the opposite cause.
The problem arises because of the size of the world's capital pools in relation to its volume of trade. The total assets of U.S. hedge funds in September 2009 were $1.95 trillion (down from almost $3 trillion a year earlier). That compares with total U.S. imports of goods and services in 2008 of $2.1 trillion. However, in addition to the hedge funds, there are other huge pools of money available for deployment in commodities markets. For example China and Japan each have around $2 trillion of foreign exchange reserves, while Saudi Arabia and the Gulf states have comparable sized pools of liquid assets available for investment. Since the available inventory of commodities is a fraction of their annual production, we could potentially end up with an extreme case of too much money chasing too few goods.
This would not matter much if investment were concentrated in futures markets. The open interest in such markets is controlled by the traders, who arbitrage to close positions as the settlement date nears. Thus when huge speculative money flows pour into futures markets, they drive up the price of the commodity concerned, but do not significantly interfere with the production of that commodity, nor with the flow of the commodity from producer to consumer.
Normally, commodity investment is confined to futures markets because it is much more convenient. The cost to a hedge fund or other financial investor of holding stocks of a commodity is quite high, normally sufficient to deter investors from attempting to buy commodities directly. They will only buy commodities directly if they are afraid that the normal arbitrage mechanisms between the futures markets and the commodity markets will be overwhelmed by the volume of demand, so that investment in futures will prove less profitable than it "should."
When investment moves to physical commodities, as it may now be doing, it potentially disrupts trade flows. A ship laden with copper ore that would normally have sailed from Chile to a smelter on the U.S. West Coast is instead parked in a holding area in order that investors can profit from the rise in value of that copper. That reduces the amount of ore available to smelters. Since the balance between supply and demand of most commodities is quite delicate, and supply cannot be ramped up by more than a modest percentage at short notice, that could result in a physical shortage of the commodity at the smelter, shutting down the smelter for a period and depriving its customers of the copper products they need for their own operations.
Disruptions of commodity flows of this kind can potentially cause both hyperinflation and a major recession. The value of copper to the smelter and its customers is much higher in a shortage than if it is available normally, because the cost of closing their own operations is large – hence the price of any spare copper that might be available locally zooms upwards. Equally, the economic cost of shutting down the smelter and its customers far exceeds the value of the copper ore shipment. Products containing copper are suddenly in short supply, while workers lose their paychecks and so are forced to stop consuming at the same level.
The effect of a gross liquidity surplus is thus quite similar to that of a sudden shortage. In the shortage case, as in 1837-41 and 1929-33, prices decline sharply – in those two cases by as much as 20-25% – economic activity is hugely reduced as businesses are unable to obtain financing and workers are laid off. The resultant decrease in demand causes producers to lose money, eventually closing their doors, as well as bankrupting the financial system.
In a gross liquidity surplus, in which investment capital disrupts commodity trade flows, inflation rather than deflation results, probably very rapid inflation rather than the moderate 5% to 10% inflation we became used to in the 1970s. That inflation still further increases demand for commodities, worsening the problem. Businesses unable to obtain raw materials close their doors, workers' real incomes decline sharply (even when they keep their jobs) and Gross Domestic Product declines similarly to the deflationary case.
We have never experienced a global hyperinflation, in which money is unable to purchase goods, so it becomes worthless. In particular countries, wars have produced this effect, notably in the Revolutionary wars in both the United States and France, when the "continentals" and "assignats" became of no value. Similar effects have been produced by excess money printing in Latin America; in hyperinflationary periods citizens of Argentina have starved, even though the country is one of the world's greatest food producers. However, globally we have experienced nothing worse than the moderate worldwide inflation of the 1970s, in which trade flows were disrupted and incomes and assets affected, but commodities generally remained available in the market and output weakened but did not decline sharply.
The fascination of adding another chapter to economic historians' textbooks is not sufficient to make global hyperinflation anything other than an event to be avoided at all costs. It might help the Ben Bernanke of 2080 to make better monetary policy decisions than the current incumbent, since he would have the chance to be the world's greatest expert on the hyperinflationary crash of 2011. However, as far as this column is concerned, future generations can take their chances – we need to avoid hyperinflation happening to this generation.
The cost of avoiding this disaster appears to be steadily increasing. Once articles start appearing in the Financial Times about investors choosing to buy physical commodities rather than futures, many more such investors will be drawn into this activity. A moderate tightening of monetary policy that might well have deflected the forces of hyperinflation if it had been instituted several months ago may well prove ineffectual at this stage.
In determining the necessary monetary policy, the gold price provides a very useful signaling device (and its definitive breakout through previous highs last week provides a stern warning.) It does not matter one whit whether investors demand physical gold rather than futures, because gold has only insignificant industrial uses and the stocks of gold available in "inventories" such as Fort Knox are far more than sufficient to supply those uses for a decade if necessary. However, the commodity investment impulse is closely tied to the gold investment impulse; both reflect a well warranted distrust of fiat money and a desire to hold items of secure long-term value. Hence the gold price is available to show policymakers whether their monetary policy is appropriate.
If, following last week's breakthrough, the gold price continues to increase, heading for $2,400 per ounce, the equivalent in today's money of the 1980 high, that will be an excellent signal that monetary policy urgently needs tightening.
If, after a first monetary tightening, the gold price retreats for a few weeks and then breaks through its recent highs, that development will be a signal that monetary policy must be tightened further, as the flight to commodities has not halted.
Only when the gold price breaks definitively downwards, dropping 25% or more from its high, will policymakers know that they have succeeded in breaking the commodity investment mania. Such a development is however likely to occur only after a definitive crack in government bond markets, forcing policymakers to address their gigantic budget deficits as a matter of urgency.
Given the predilections of today's policymakers, it is unfortunately unlikely that they will tighten monetary policy sufficiently to break the commodity flight, whatever the gold price does. Instead, led by the determined Keynesians of the International Monetary Fund, they are much more likely to attempt to control the gold price itself, either surreptitiously by selling off massive quantities of the world's gold reserves, or openly by imposing limits on gold futures trading and possibly, like Franklin Roosevelt in 1933, making it illegal for ordinary individuals to own gold or to buy gold futures.
That will of course only make matters worse; it would be equivalent to trying to avoid a speeding ticket by smashing the car's speedometer. Manipulating the gold price to pretend that liquidity is not excessive does not stop liquidity from being excessive. Nor does it lead any but the stupidest institutional investor to believe that his urge to invest in physical commodities is misguided. Rather, it will cause commodities investment to be carried out through shell companies in tax havens, away from regulators' radar screens. The effect on global supply chains will be equally damaging, but policymakers will no longer have a straightforward way of determining how to avoid the resulting economic depression.
I wrote last week that tightening liquidity directly by entering into a central bank "exit strategy" is dangerous. However , the Financial Time's story itself and the gold price breakthrough have significantly increased the size of the hike in interest rates necessary to halt the flight to commodities.
Time is short, and the probability of disaster is rising.
The Bears Lair is a weekly column that is intended to appear each Monday, an appropriately gloomy day of the week. Its rationale is that, in the long '90s boom, the proportion of "sell" recommendations put out by Wall Street houses declined from 9 percent of all research reports to 1 percent and has only modestly rebounded since. Accordingly, investors have an excess of positive information and very little negative information. The column thus takes the ursine view of life and the market, in the hope that it may be usefully different from what investors see elsewhere.
Seasonal Gold
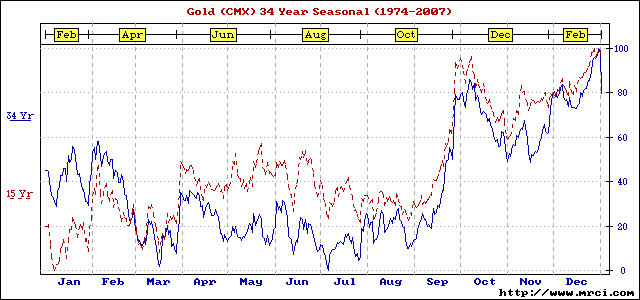
Looking at the seasonal chart for gold courtesy of 321gold via Moore Research at www.mrci.com you can see what has transpired in the past September to October period, on average, over the past 34 years; a huge September rally followed by decline in October that retraces about half that rally. Look closely and you will see the average October decline began around the end of the first week in October. Today is October the 7th.
Shifting With the Winds of Finance
from marketpsych blog:
All trading systems work. All trading systems fail. It is difficult to find a trading system that DOESN’T work in some market at some time. It is also difficult to find a system that DOES make consistent returns in all market conditions.
Here is the really good news.
Independent traders have the luxury of picking and choosing their trades. They don’t have to trade all of the time. This is their edge. They can wait until the market patterns are working for them.
It is in the evolution and transition of trading patterns that a lot of money can be made and lost. Because trading patterns are driven by humans who trade repeatedly with the same behavioral responses the destruction and emergence of new patterns create profit opportunities.
The problem we have as traders is that if we have a system that is making money in one market pattern, we get attached to that system. We build our ego on the fact that 15 of our last 18 trades were winners. This rewards our dream that we have found the secret to trading.
It’s like one of those Zen puzzles…any belief you are attached to, the market will destroy. As a trader, it is your ability to see new trading patterns emerge that create the most profit potential. To do this, the mind needs to see the markets as they are without the prejudicial filters we all carry around. If our ego is attached to a trading system and its success, the ability to see new patterns emerging is difficult.
When I was an option floor trader, I would get a “sense” that a market pattern was about to change. This “sense” was built on years of experience. Even though I might not be able to articulate what was happening, I could feel it.
At these times I would go to the market to reduce my risk. It was expensive because I would have to trade with other market makers to change my positions quickly. More often than not, nothing had changed. I would have paid $10,000 or more for the insurance. However, a few times a new pattern would emerge and I could see it because I didn’t have positions based on the previous pattern. Other market makers, with large complex positions based on the previous pattern would need to believe that the current change was an aberration and that the markets would come back to their previous patterns. As the market continued the shift, it would get more and more expensive to realize the losses, and the more stubborn these market makers would get.
Here is the cool thing. Since I no longer had a risk position, a few times I was able to visualize the new patterns very early in the shift, reset my option volatility tables and start building a new position. I would often be trading with other market makers whose values were based on the previous patterns. Slowly, one by one, the other market makers would see what was happening and the options would come in line with the new pattern. With the new option values, I made a lot of money.
As a market maker, I had to be trading and make markets for incoming orders at all times and it was expensive to shift positions. But as an independent trader, you can pick and choose the times to trade. This is a powerful advantage. You can get out of a position with a click of the mouse when you sense a market pattern is changing.
Here are some potential indicators of changing market patterns:
Psychological:
- Unusual emotions in yourself such as exuberance, fear or cockiness
- Emotions in other traders you talk to such as exuberance, fear or cockiness
- Overwhelming consensus of where market is going
- Physiological changes in yourself such a stomach pain, tenseness, funny taste in your mouth, back ache etc.
- Emotions in headlines
- Volume
- Daily range
- Volatility and implied volatility in options
- Momentum
- Size of trades or unusual large orders
- New chart patterns
- Unexpected moves
- Unusual moves that seem odd
- Time of day pattern shifts
- Opening market pattern changes
- Closing market pattern changes
- Changes in your ability to execute trades
- Change in your P&L patterns
- Unusual gaps in the market
- Sudden quiet
- Shifts in how the market reacts to news
- Changing margin requirements
Remember, all trading systems work during certain market periods. All trading systems eventually fail. It’s the law. If you can free yourself from the belief in your system as the holy grail, you can see new patterns as they emerge and profit.
Easy to say, but how do you see new patterns? In my coaching practice we create a series of Mind Muscles™. These are neurological circuits that help us create new responses to market conditions. Creating concrete visualizations is one way of building new Mind Muscles™ and behavioral responses. If you want to create a Mind Muscle™ for new pattern recognition try this exercise.
First, get comfortable in a place that you won’t be interrupted. Take a moment do some deep breathing exercises. One exercise that works well is to slow count to three on your inhale through your nose. Hold the inhale for another count of three. Exhale through your mouth to a slow count of three and rest at full exhalation for another count of three. Repeat 10 times or until you feel your body settling in.
Then close your eyes and imagine a dog, a well trained bloodhound. He is sniffing the air, the ground and various objects. Imagine this hound dog in detail, his colors, movements and sounds. He is looking for some scent that is out of the ordinary. Spend some time with him as he sniffs his world. Now give him a name. Sniffer works great if nothing else comes to mind. Call the dog to your side. Pet him and give him some love. Then tell him to go and sniff out new patterns and to bay at the top of his voice when he finds one. Call him back, reward him with love, and send him out again.
Now, when you are trading and have a moment, visualize your new bloodhound. He represents a new behavior you have created in your brain. Call him by name. Give him some love. Tell him to go sniff out pattern changes. Watch him as he sniffs both psychological indicators and market metrics. And wait for the baying to begin.
For more on the how and why of creating Mind Muscles™ please call.
Richard Friesen
RFriesen@MarketPsych.com
415.259.0652
Labels: market patterns, market psychology, Richard Friesen, stock psychology, trading profits, trading systems


Wednesday, October 07, 2009
Coaching Clients that Stay Stuck
When I am talking to a prospective coaching client, one of the questions that frequently comes up is about my success rate, or clients that don’t progress. A professional trader and potential client asked me this question today.This is a great question because it has stimulated my own thinking.
As a trader, I am all about pattern recognition (by the way, neuroscience is finding out more about how pattern recognition works in the brain…my next blog?). What is the pattern of traders that never make it?
We all have deep core needs, some of which have never been met. Most of us compensate (I know I have) and live great lives. However, sometimes that deep unmet need is connected to a belief about ourselves, our world or the markets. This belief becomes a story and this story becomes our lifeline and hope for the future. We will protect our belief in this story like life itself.
As a result, we are unable to see the market for what it is when it doesn’t fit our story.
If we felt ignored in our early years, we might create a story that successful trading will bring us acclaim. If we were told we were stupid, successful trading might prove that we are smart. If we felt powerless, sucessful trading will give us the power we deserve. If we were abused as children, successful trading will release the anger we feel. If we feel unworthy, we may sabotage our results.
For example, a former exchange floor trader who worked for my trading firm was adopted and had always felt unworthy. He had overcome a number of problems in his life (like stuttering) but his lack of self-acceptance was a deep unacknowledged wound. Before I hired him, he had made a lot of money trading then blew out (He lost all his trading capital). After training, he followed our option trading system but had mediocre results.
I brought in a hypno-therapist to work with him. She gave him the tools to visualize and build a new relationship to himself, as someone who was worthy. After a few sessions, he became a tiger in the pit. In fact, he became so aggressive that he got into a fight on the floor. My firm was fined, and I was very happy to pay. He went on to become both profitable and consistent.
But what if he had kept the story that he was unworthy? Would new trading systems, new gurus, new algorithms make a difference? Probably not.
We all have unacknowledged stories. Most of them are benign. But occasionally, one story can be so attached to a core wound that at this time, we can’t let go, even with all the help in the world.
The first step to discovering our own story, is awareness. Here is an exercise that may be helpful in expanding your own self-awareness. When trading isn’t going well, set an alarm to ring in ten minutes or more. When it goes off, freeze! Now take an inventory of your thoughts. Are you telling yourself a story? If you are feeling badly, what drives that feeling? What story creates that feeling? If you find a story, write it down in a journal.
The story is your way of protecting yourself, so give it respect like a wise elder. If you want to take this experience further, see what the story is protecting. You might find a door to a new insight.
Richard Friesen
www.MarketPsych.com
(415) 259-0652
RFriesen@MarketPsych.com

Gold Sets Another New Record at $1071.80


Tuesday, October 13, 2009

Krugman and the Pied Pipers of Debt
also from Rolfe Winkler. Smart guy!
Investors are celebrating an incipient “recovery,” but the interventions that were responsible for it are sowing the seeds of a more violent contraction down the road. The problem, quite simply, is debt. We’ve accumulated record amounts, yet many economists tell us we need more.
Leading the charge is Paul Krugman. He exhorts us to borrow our way back to prosperity, but he doesn’t acknowledge that his brand of Keynesian economics ignores the consequences of debt. If you look at a chart of America’s total debt burden, he’s leading us over a cliff.
(Click chart to enlarge in new window)

The problem begins with the flawed way Krugman and other economists measure well-being. Primarily, they look at measures of activity, like GDP. These tell us how much people spend, but say nothing about where we get the money.
Every so often, we overextend ourselves, buying too much useless stuff with too much borrowed money. So we cut back, dumping the third family car and swapping the McMansion for a townhome.
But this is problematic for Krugman and other economists. Less spending means falling GDP. It means “recession.”
They ride to the rescue with two blunt instruments — monetary and fiscal policy — that encourage more borrowing and thus more spending. More spending equals “growth” so economists congratulate themselves for engineering “recovery.”
But if recessions never happen, bad businesses and unpayable debts are never washed away. They grow like cancer inside the system.
Since the mid-1980s, we’ve intervened whenever the economy hiccuped, so sectors that should have shrunk sharply — like housing and finance — never did. Feasting on easy credit, these sectors have exploded as a percentage of the economy.
Now, since individuals and corporations refuse to borrow more, the only way to grow spending is for the government to borrow.
According to George Cooper, author of The Origin of Financial Crises, “what is missing from today’s debate is recognition that previous growth rates were artificially supported by an unsustainable credit binge, itself the result of the misapplication of Keynesian policy.”
Cooper counts himself a Keynesian but says Keynesian policy has become “dangerously distorted.”
“We should be using Keynesian stimulus only to arrest the rate of credit contraction not to reverse it. The harsh truth is that our economies desperately need a recession.”
That’s because they desperately need to de-lever. As you can see in the first chart, debt relative to GDP is at record highs.
If we want sustainable growth, spending that drives it must come from savings, not more borrowing. To get there, we must first pay old debts. And that means recession.
Krugman is clearly aware of the consequences of excessive borrowing.
“I’m terrified about what will happen to interest rates once financial markets wake up to the implications of skyrocketing budget deficits,” he wrote in 2003, citing a $1.8 trillion 10-year deficit projection from the Congressional Budget Office.
Fast forward six years, total debt has jumped 70 percent relative to GDP and optimistic projections put the 10-year deficit at $9 trillion.
This time, however, Krugman dismisses deficit “hysteria,” arguing that we can grow our way out of debt. “We did it during the Clinton administration,” he told me when he visited Reuters last week.
But we didn’t. While Clinton balanced the federal budget, Americans plowed through their savings. We kept growing because, in the aggregate, we were still accumulating debt.
(Click chart to enlarge in new window)

Krugman has also argued that we can handle larger deficits because we have in the past. After all, public debt peaked at 118 percent in 1945 compared with 65 percent today.
Two problems. First, the argument ignores tens of trillions of unfunded obligations for Medicare and Social Security, debt Krugman loudly lamented in his 2003 column.
It also ignores the higher private debt burden facing us today. According to economist Steve Keen, “Private sector debt accumulated in the 1920s was wiped out by the Depression, so in 1945 the private sector’s debt burden was only 45 percent of GDP. In that situation it was easy to wind down public debt from levels reached to finance WWII.”
Today, private debt is a suffocating 300 percent of GDP, making more public debt that much harder to pay down.
We know how this movie ends. Look at California — or Argentina.
We chortle from afar — “how did their budget get so out of whack?” — yet our own profligacy puts us squarely on that path. Like them, we’ve shown no political will to deal with debt. And so it will deal with us.
But we can print our own currency, you say. If all else fails, the United States can inflate its way out of debt.
Nonsense. If we try, our foreign lenders will cut us off.
As Krugman warned in 2003: “My prediction is that politicians will eventually be tempted to resolve the (fiscal) crisis the way irresponsible governments usually do: by printing money, both to pay current bills and to inflate away debt. And as that temptation becomes obvious, interest rates will soar.”
Yet today Krugman is leading the march, arguing that we can borrow indefinitely as long as deflation remains a threat.
Tell that to the Chinese.
What happens when they stop buying our bonds? To Cooper’s point, we’ll need government intervention to cushion the blow of de-leveraging. But there’s a difference between cushioning the blow and reinflating the bubble, which is what we’re doing, wasting trillions propping up housing and banking.
The risk is that we’ll have nothing left when we really need it, when the Great Leveraging becomes the Great De-Leveraging.
Leading the charge is Paul Krugman. He exhorts us to borrow our way back to prosperity, but he doesn’t acknowledge that his brand of Keynesian economics ignores the consequences of debt. If you look at a chart of America’s total debt burden, he’s leading us over a cliff.
(Click chart to enlarge in new window)
The problem begins with the flawed way Krugman and other economists measure well-being. Primarily, they look at measures of activity, like GDP. These tell us how much people spend, but say nothing about where we get the money.
Every so often, we overextend ourselves, buying too much useless stuff with too much borrowed money. So we cut back, dumping the third family car and swapping the McMansion for a townhome.
But this is problematic for Krugman and other economists. Less spending means falling GDP. It means “recession.”
They ride to the rescue with two blunt instruments — monetary and fiscal policy — that encourage more borrowing and thus more spending. More spending equals “growth” so economists congratulate themselves for engineering “recovery.”
But if recessions never happen, bad businesses and unpayable debts are never washed away. They grow like cancer inside the system.
Since the mid-1980s, we’ve intervened whenever the economy hiccuped, so sectors that should have shrunk sharply — like housing and finance — never did. Feasting on easy credit, these sectors have exploded as a percentage of the economy.
Now, since individuals and corporations refuse to borrow more, the only way to grow spending is for the government to borrow.
According to George Cooper, author of The Origin of Financial Crises, “what is missing from today’s debate is recognition that previous growth rates were artificially supported by an unsustainable credit binge, itself the result of the misapplication of Keynesian policy.”
Cooper counts himself a Keynesian but says Keynesian policy has become “dangerously distorted.”
“We should be using Keynesian stimulus only to arrest the rate of credit contraction not to reverse it. The harsh truth is that our economies desperately need a recession.”
That’s because they desperately need to de-lever. As you can see in the first chart, debt relative to GDP is at record highs.
If we want sustainable growth, spending that drives it must come from savings, not more borrowing. To get there, we must first pay old debts. And that means recession.
Krugman is clearly aware of the consequences of excessive borrowing.
“I’m terrified about what will happen to interest rates once financial markets wake up to the implications of skyrocketing budget deficits,” he wrote in 2003, citing a $1.8 trillion 10-year deficit projection from the Congressional Budget Office.
Fast forward six years, total debt has jumped 70 percent relative to GDP and optimistic projections put the 10-year deficit at $9 trillion.
This time, however, Krugman dismisses deficit “hysteria,” arguing that we can grow our way out of debt. “We did it during the Clinton administration,” he told me when he visited Reuters last week.
But we didn’t. While Clinton balanced the federal budget, Americans plowed through their savings. We kept growing because, in the aggregate, we were still accumulating debt.
(Click chart to enlarge in new window)
Krugman has also argued that we can handle larger deficits because we have in the past. After all, public debt peaked at 118 percent in 1945 compared with 65 percent today.
Two problems. First, the argument ignores tens of trillions of unfunded obligations for Medicare and Social Security, debt Krugman loudly lamented in his 2003 column.
It also ignores the higher private debt burden facing us today. According to economist Steve Keen, “Private sector debt accumulated in the 1920s was wiped out by the Depression, so in 1945 the private sector’s debt burden was only 45 percent of GDP. In that situation it was easy to wind down public debt from levels reached to finance WWII.”
Today, private debt is a suffocating 300 percent of GDP, making more public debt that much harder to pay down.
We know how this movie ends. Look at California — or Argentina.
We chortle from afar — “how did their budget get so out of whack?” — yet our own profligacy puts us squarely on that path. Like them, we’ve shown no political will to deal with debt. And so it will deal with us.
But we can print our own currency, you say. If all else fails, the United States can inflate its way out of debt.
Nonsense. If we try, our foreign lenders will cut us off.
As Krugman warned in 2003: “My prediction is that politicians will eventually be tempted to resolve the (fiscal) crisis the way irresponsible governments usually do: by printing money, both to pay current bills and to inflate away debt. And as that temptation becomes obvious, interest rates will soar.”
Yet today Krugman is leading the march, arguing that we can borrow indefinitely as long as deflation remains a threat.
Tell that to the Chinese.
What happens when they stop buying our bonds? To Cooper’s point, we’ll need government intervention to cushion the blow of de-leveraging. But there’s a difference between cushioning the blow and reinflating the bubble, which is what we’re doing, wasting trillions propping up housing and banking.
The risk is that we’ll have nothing left when we really need it, when the Great Leveraging becomes the Great De-Leveraging.
Gold Is Armaggedon Insurance
This is precisely the way I view gold.
from Rolf Winkkler at Reuters:
Deflation could be the biggest threat to the economy, but gold — usually an inflation hedge — is reaching new highs. That’s because smart investors aren’t playing the inflation trade, they’re buying currency crisis insurance.
With the amount being spent by the public sector, with the huge amounts of leverage still in the system, there’s a palpable fear that America won’t be able to meet its obligations. Relative to GDP, the amount we’re borrowing to finance deficits makes us look irresponsible.
When such economies hit a wall, investors make a run on the currency, typically moving their assets to a stronger currency, like the dollar.
But this time the problem is the dollar, along with other leading paper currencies, all of which are threatened by profligate fiscal and monetary policies. So some investors want out of the system entirely. Gold, as my colleague Neil Collins noted earlier, is a way to do that.
The gold market is small enough that a decision by a handful of money managers to increase their asset allocation from, say, zero to 5 percent can move the market. All the gold ever mined would fit aboard an oil tanker; its total weight of 125,000 tons amounts to a few hours’ output for the U.S. steel industry.
But economists tell us that inflation isn’t a risk now. Are they wrong? No and yes.
The conventional way economists view inflation is to look at things like “output gaps.” When the economy falls below a level of output it previously achieved, it is said to have unemployed resources. If you think of inflation as workers demanding and getting higher wages, which leads to higher prices for the goods and services they produce, then inflation isn’t a threat.
So economists tell us more borrowing and money printing won’t be inflationary as long as people are unemployed.
One problem: Their models ignore the fact that peak output was artificially inflated by a credit binge. Borrowing more to sustain an unsustainable level of spending borders on insanity, yet that’s precisely what such economic models tell us we need to do.
There’s an extra variable these models don’t account for — the Chinese and all major lenders to the United States. They don’t much care if our employment rate is below desirable levels. At a certain point, they may recognize that the United States is acting like a banana republic and choose to stop lending.
When that happens, we might see a “sudden stop” event: Capital inflows to the private and public sector cease as everyone races to get out of dollars.
Eric Sprott, CEO of Sprott Asset Management has $4.5 billion under management, $2 billion of which is invested in physical bullion — silver and gold — stored at banks in Canada. Another large chunk is invested in gold stocks.
He views gold as an insurance policy against both inflation and deflation. Central bank quantitative easing policies mean “we’re printing paper currency like crazy,” so he doubts the long-run value of fiat currencies.
On the flip side, if central banks pull back, you could enter a deflationary spiral, essentially a banking collapse, in which case “your deposits wouldn’t be returned to you. Better to have physical gold in your control.”
Most economists and investors still labor under the illusion that there’s a way out of debt that doesn’t involve a drastic reduction in the paper value of wealth. Smart investors aren’t so sure and want at least a portion of their assets out of the financial system.
A dollar crisis isn’t necessarily coming tomorrow, so there’s no guarantee gold’s price will keep going higher. Still, gold is a decent insurance policy against economic Armageddon.
from Rolf Winkkler at Reuters:
Deflation could be the biggest threat to the economy, but gold — usually an inflation hedge — is reaching new highs. That’s because smart investors aren’t playing the inflation trade, they’re buying currency crisis insurance.
With the amount being spent by the public sector, with the huge amounts of leverage still in the system, there’s a palpable fear that America won’t be able to meet its obligations. Relative to GDP, the amount we’re borrowing to finance deficits makes us look irresponsible.
When such economies hit a wall, investors make a run on the currency, typically moving their assets to a stronger currency, like the dollar.
But this time the problem is the dollar, along with other leading paper currencies, all of which are threatened by profligate fiscal and monetary policies. So some investors want out of the system entirely. Gold, as my colleague Neil Collins noted earlier, is a way to do that.
The gold market is small enough that a decision by a handful of money managers to increase their asset allocation from, say, zero to 5 percent can move the market. All the gold ever mined would fit aboard an oil tanker; its total weight of 125,000 tons amounts to a few hours’ output for the U.S. steel industry.
But economists tell us that inflation isn’t a risk now. Are they wrong? No and yes.
The conventional way economists view inflation is to look at things like “output gaps.” When the economy falls below a level of output it previously achieved, it is said to have unemployed resources. If you think of inflation as workers demanding and getting higher wages, which leads to higher prices for the goods and services they produce, then inflation isn’t a threat.
So economists tell us more borrowing and money printing won’t be inflationary as long as people are unemployed.
One problem: Their models ignore the fact that peak output was artificially inflated by a credit binge. Borrowing more to sustain an unsustainable level of spending borders on insanity, yet that’s precisely what such economic models tell us we need to do.
There’s an extra variable these models don’t account for — the Chinese and all major lenders to the United States. They don’t much care if our employment rate is below desirable levels. At a certain point, they may recognize that the United States is acting like a banana republic and choose to stop lending.
When that happens, we might see a “sudden stop” event: Capital inflows to the private and public sector cease as everyone races to get out of dollars.
Eric Sprott, CEO of Sprott Asset Management has $4.5 billion under management, $2 billion of which is invested in physical bullion — silver and gold — stored at banks in Canada. Another large chunk is invested in gold stocks.
He views gold as an insurance policy against both inflation and deflation. Central bank quantitative easing policies mean “we’re printing paper currency like crazy,” so he doubts the long-run value of fiat currencies.
On the flip side, if central banks pull back, you could enter a deflationary spiral, essentially a banking collapse, in which case “your deposits wouldn’t be returned to you. Better to have physical gold in your control.”
Most economists and investors still labor under the illusion that there’s a way out of debt that doesn’t involve a drastic reduction in the paper value of wealth. Smart investors aren’t so sure and want at least a portion of their assets out of the financial system.
A dollar crisis isn’t necessarily coming tomorrow, so there’s no guarantee gold’s price will keep going higher. Still, gold is a decent insurance policy against economic Armageddon.
New Record High for Gold, Again on Sinking Dollar
Speaking of records -- this seems like a broken one, since it repeats so often. This post seems to be the most frequently recurring one.
Dollar

Gold - just under $1070/oz.

Monday, October 12, 2009
Quarterly Review from Hoisington Capital Management
The title of this article is Ponzi Finance:
The Federal Reserve reported that as of June 30, 2009 total U.S. debt was $52.8 trillion. Total U.S. debt includes government, corporate and consumer debt. Importantly, however, it does not include a few trillion in "off balance sheet" financing, contingent unfunded pension plans for corporate and state and local governments, or unfunded liabilities of the U.S. government for such items as Medicare, Social Security and other programs. Currently GDP stands at $14.2 trillion, so there is approximately $3.73 in debt for every dollar of output in the United States, a level unprecedented in our history (Chart 1). Normally, debt levels as a percent of GDP would be uninteresting and immaterial; however, the current level of debt is unique in two ways. First, the asset side of the balance sheet purchased by the debt is falling in price. Second, the money that was borrowed to purchase those assets was often fraudulently expended. Neither the borrower nor the lender really expected the debt to be serviced. Rather, each party expected the asset price to rise extinguishing the debt.

This type of financial arrangement was correctly analyzed by the famous American economist Hyman Minsky in his paper, "Financial Instability Hypothesis", in which he described three phases of debt financing. The first is "hedge finance", where the lender expects a return on both principal and interest. The second is "speculative finance" where the lender expects to get interest on the loan but perhaps not the principal. The third case, where the lender expects neither the principal nor interest to be returned, is referred to as "ponzi finance". This was typified in the last business cycle by loans issued without documentation, no down payment home loans, extremely low cap rates on commercial real estate, and the high leverage borrowing ratio of private equity funds. Even ponzi finance works as long as asset prices are rising. But once the bubble is pricked, the debtor is left with declining asset values that preclude the rollover of their obligations.
Presently, in this worst of all post-war recessions we are witnessing the collapse of asset prices that were inflated by the speculation of earlier years. The aftermath of that speculation and its impact on the economy has been thoroughly studied prior to our present business cycle by the economists of yesteryear who marveled at the mania in the collective mindset of private citizens and their elected representatives who produced such bubbles. The most famous of these economists was Irving Fisher (1867-1947), who in 1933 wrote about this problem of over-indebtedness (Irving Fisher, 1933, Econometrica, "The Debt-Deflation Theory of Great Depressions"). He stated flatly that over-indebtedness was the difference between normal business cycles (recessions), which occur frequently through "over-production, inventory misjudgment, or commodity price fluctuations" and extreme business cycle fluctuations (depressions). Based on his analysis of the great depressions of 1837, 1873, and 1929 he outlined a pattern of economic developments that will take place when the debt cycle is broken. Seemingly old news, but it is interesting to apply his sequence of events to today's economic developments as there are disturbing similarities.

A Downward Spiral
Fisher posited that debt liquidation leads to distress selling, contracting bank deposits and declining velocity of money, all of which contribute to the fall in price levels. This accurately describes today's circumstances. Distress selling is rampant, with home foreclosures reaching all-time highs. Additionally, rapidly rising foreclosures in commercial real estate are causing the closing of financial institutions and the liquidation of their portfolios. Money supply (M2), an imperfect measure of bank deposits, is essentially flat over the last six months even though the monetary base is 100% higher than it was a year ago (Chart 2). Further, the velocity of M2 has contracted at a 12.7% rate over the past two years. The Personal Consumption Expenditure Deflator (goods purchased by consumers) has fallen from a 2.7% growth rate 12 months ago to a yearly increase of only 1.3% presently, and appears to be heading for a zero reading in 2010. GDP has recorded its greatest contraction since the 1930's, and probably is not yet at its lowest level for this cycle.
Fisher then noticed that this distress selling would lead to a fall in the net worth of businesses, a decline in profits, and a reduction in employment. Fisher may have been talking about 1929 and the 1800's, but that is precisely our present situation. Despite a 19% gain in stock prices this year, the S&P 500 has declined about 30% from its peak and stands lower than it was a decade earlier. Corporate profits are down approximately 13% on a year over year basis, and in 2008 S&P 500 profits fell for the first time since 1933. The net worth of hundreds of banks and other large corporations has fallen below zero, with some surviving only because of a massive rescue effort by the federal government. Despite these efforts, consumer net worth has fallen, price levels of homes are down about 30% from their peak levels, and business net worth has been impaired by an almost 39% decline in commercial real estate from its peak levels. Industrial production is down 13.3% since its peak, the largest 20 month decline in the post war period (Chart 3). Including potential revisions, the U.S. has lost eight million jobs in this recession, and currently 17% of the labor force is either underemployed, partially employed, or out of work seeking employment.

Fisher seems to be not so historical as prescient. He states that all the above problems create disturbances in the rate of interest, particularly the fall of nominal money rates and the rise of real interest rates. The federal funds rate is now effectively zero, and yet with the steady downward movement in price indices, real interest rates are rising. This, of course, is of concern to debtors.
The uncomfortable conclusion of Fisher's analysis is that major business cycle fluctuations are, in fact, caused by over-indebtedness and the fall in asset prices. Our present situation appears to mirror the exact sequence of events that have occurred in previous depressions. This suggests that our current "great recession" may morph into a more serious and elongated downward business cycle.
The Impossible Promise
The federal government's promise to extricate the U.S. economy from this recession involves more spending (increasing public debt) and more subsidies for consumers, such as car rebates and home buying incentives (more private debt). In other words, more debt is supposed to solve the problem of over-indebtedness. The truth is that this policy merely indentures its citizens further without providing any income for repayment of debt. In previous letters we have discussed the fact that the government spending multiplier is zero (read Professor Robert Barro's book, Macroeconomics - a Modern Approach, p. 370). This means there is no long term income benefit from stimulus programs. According to the latest academic research, the most recent $800 billion stimulus plan will boost economic activity in the short run, but will surely depress economic activity over time. The government problem is complicated by the fact that the tax multiplier is 3, meaning that a 1% change in taxes will change GDP by about 3% over time. More recent research (Barro & Redlick, September 2009, "NBER Working Paper 15369") suggests that a 1% cut in the marginal tax rate would raise GDP in the ensuing year by 0.6%. With the deficit rising due to a zero spending multiplier, the tendency will be to try to raise taxes to pay for this higher level of expenditures, which will further depress aggregate spending and output.From a fiscal policy perspective the outlook for economic growth appears to be one of stagnation for several years due to the size of the federal debt, which is expected to rise 35.7% from 2008 levels to 76.5% of GDP over the next ten years according to the Office of Management and Budget (Chart 4). This exercise in government spending is, of course, an exact replica of the Japanese experience from 1989 to the present. Their debt to GDP ratios have gone from about 50% in 1988 to about 178% today, and yet their nominal GDP is no higher than it was 17 years ago, and their employment stands at twenty year ago levels. It is somewhat unsettling that as of the last employment report the United States employed 131 million people, a level that was first reached in 2000, which means the United States has had no net job gains for almost ten years. Indeed, it appears that the fiscal chain around the free market neck is sufficiently onerous to restrain growth for several years. The promise of the government to revive growth through increased indebtedness is, indeed, an impossible promise.

The Hesitant Fed
As Fisher stated, the write-down of debt and distress selling tends to destroy money deposits and lower the velocity of money. Despite the historical evidence of that fact, our current Fed authorities appear to be oblivious to the lessons of the past. Their initial reaction to the liquidity crisis has to be applauded for their heavy work in insuring the liquidity of the financial system. Similarly, the expansion of their bank balance sheet to $2.1 trillion from $1 trillion was the precise reaction needed to counter the emerging deflation of asset prices. However, their actions increased inflationary expectations, and they have encountered a plethora of critics. In responding to this criticism the most recent statistics suggests they are beginning to lose the fight against the deflationary impulses. Consider that the monetary base rose 1000% in the three months ending December 2008, but has been held essentially flat since then (Chart 5).
The Fed's purchases of assets to increase this base automatically created deposits that positively charged the money supply growth to a 15.2% six-month growth rate (Chart 2). If the economy were operating near full capacity, a healthy banking system would take these deposits and multiply them roughly nine times; that circumstance could be inflationary. Unfortunately the banking system is not healthy, as evidenced by the fact that we have closed 95 banks this year, more than the cumulative total of the past 15 years, and another 416 banks are on a list destined to become extinct. With consumers' asset prices falling so rapidly and banks increasingly afraid of failure, banks are more interested in collecting loans than in lending. So with fewer consumers now credit worthy, loan volumes are collapsing. As loans are paid off, deposits are destroyed, and the money multiplier that should stand at nine has gone to zero. This is evidenced by the fact that the six-month change in M2 has fallen to a 1% growth rate, meaning that monetary stimulus is on hold. Get set for negative GDP in 2010.

Dollar Weakness
The inflation outlook from the monetary and fiscal standpoint looks truly deflationary, yet some believe that dollar weakness will reverse this circumstance and create inflation. This is unlikely. First, our imports are about 13% of GDP, and even if the dollar were to halve in value, the price of imported goods would not only have to compete with U.S. producers, but also their price adjustment would have to offset the other 87% of factors included in the pricing indices. Second, unlike the 1930's a 50% decline in the dollar would be difficult to engineer. Fisher recommended to Roosevelt that the U.S. should exit the gold standard, which he did in April of 1933. That was a fixed exchange rate system, and within three months the dollar lost more than 30% against the gold block countries and fell to 60% of its former value within the next five months. This spurred our exports and provided some price inflation (2.9% per year, GDP deflator) for the next four years. Then, in 1937 the tax increases (the next policy mistake) reversed the positive growth rate of the economy and drove price levels and economic activity downward again. However, even with that small period of price increases the overall price level never recovered from the 25% decline that occurred from 1929 to 1933, and thus deflation reigned. Today the declining dollar is a good thing in terms of our trade balance, but the modest change will be insufficient to offset the negative forces of insufficient domestic demand.Next year the core GDP deflator will fall to zero, with the possibility of negative levels. Likewise, long-term interest rates, which are highly sensitive to inflation, will continue to move toward lower levels. As stated in previous letters, we see no reason why longer dated Treasury interest rates will not mirror those of Japan, which provides a modern signpost for a deflationary environment. Currently the Japanese ten-year note stands at 1.3% with their thirty-year bond yielding 2.1%.
Van R. Hoisington
Lacy H. Hunt, Ph.D.


Devastating Crop Reductions Coming
After years of pushing their noses up against the candy store window, the hard-core environmental activists on Capitol Hill have picked the lock and are storming the building. There’s no telling what havoc they will wreak before the current administration sobers up and faces the reality check we all know is coming. Meanwhile, the danger of nonsensical, burdensome regulation to U.S.agriculture is real.
Earlier this year EPA embraced “indirect land use”changes in its proposed next-generation Renewable Fuels Standard. The theory is that when an acre of grain in the U.S. goes to an ethanol or biodiesel plant and not the traditional food chain, grain prices will rise and farmers in other countries will be provoked to chop down trees to plant grain to make up for that lost acre in the food chain. Thus, the blame (and carbon footprint) for that lost tree is put back on the American farmer.
If passed, this new RFS could derail a growing biofuel industry, forcing the nation to become re-addicted to foreign oil — something President Barack Obama campaigned against before the election. EPA’s adoption of this unproven theory — one that the best scientists all agree is not based on predictable behavior — makes no sense. Referring to indirect landuse theory, Iowa State ag economist Bruce Babcock says, “We’re trying to measure the immeasurable.”
It gets worse. Thanks to a circuit court decision earlier this year, EPA is considering a rule to require farmers to obtain permits through the Clean Water Act every time they spray, even if applied according to label regulations. That’s 5.6 million pesticide applications annually. “This just adds another layer of regulation and burden with absolutely no increase in environmental protection,” responded Keith Menchey of the NationalCotton Council.
EPA apparently believes it knows better than the best ag minds at USDA and the Senate and House ag committees. In April, the agency rebuffed calls for a rehearing from Ag Secretary Tom Vilsack, who urged EPA to consider the “signifi cant adverse effect” of the court’s decision on farmers.
Agriculture and the public have always had a place at the table when it comes to making sensible policy; for some reason this administration has empowered EPA to make policy decisions, and that’s not EPA’s role. Today, national security has placed renewable energy at the heart of the national agenda, and that has exposed a dangerous level of ag illiteracy on Capitol Hill. Witness the recent testimony of Margo Oge, EPA director of the Offi ce of Transportation and Air Quality. She stated before Congress, “It takes about 64 acres of corn to makea gallon of ethanol.”Madam Director, 64 acres will make 25,000 gallons of ethanol. To her credit, Oge and her assistant Gina McCarthy later agreed to accept Sen. Chuck Grassley’s invitation to visit an Iowa farm.
As the Illinois Corn Marketing Board rightly notes, these two women hold the future of biofuels in their hands, and they had never visited a farm before.
Added to this uncertainty is the latest rage over local food and organic agriculture. It’s all well and good if a yuppie couple wants to buy food based on their values at three times the going price. Viva La Difference. But heirlooms and free-range chickens won’t feed the world. Activists arrogantly forget to tell people how many more acres we would need to plow up to make up for the lower yields from those systems.
Reversing this nonsense and educating Washington will require a new educational campaign. Ag groups need to put special interests on hold and agree to a broader message that has a better impact on consumers.The message is simple: U.S. ag is the envy of the world and ladling nonsensical regulations on producers would only add to world hunger and break the pocketbooks of consumers. Stop trying to fi x something that is not broken. Organic and local food? Nice niches but they won’t feed the world.
Agriculture is an industry going through monumental change, and most of it for the good. But farmers will need to devote parts of their lives to political activism if they want to continue enjoying the freedoms they now have in their chosen profession. If you’re sitting on the bench, you’re part of the problem.
Subscribe to:
Posts (Atom)