

Wednesday, October 9, 2013
Stocks Goosed Higher Despite Ongoing Budget/Debt Impasse

Obama's Gives Yellen the Nod As Fed Chair
from the WSJ:

Monday, October 7, 2013
Will There Be Treasuries Issued Next Week?
Treasury bills have maturities of anywhere from a few days to 52 weeks. Treasury notes have maturities of between two years and ten years. Treasury bonds have maturities of 30 years. And the Treasury also sells Treasury-Inflation Protected Securites (TIPS), which have terms of 5, 10 or 30 years.
Cotton Prices Crushed As Storm Weakens
via Reuters in Mumbai, India:
Oct 7 (Reuters) - Cotton futures in India, the
world's second-largest grower, are expected to fall this week on
hopes of higher output as rains lead to better yields and due to
approaching supplies from the new season harvest amid sluggish
exports.
by Reuters US:
* Dissipating Tropical Storm leaves cotton crops unscathed
* Fiber sinks to one-month low, extends losses on sell stops
* Global stocks slide as investors remain jittery over U.S.
gov't shutdown
* USDA will not release World Agricultural Supply and Demand
Estimates report on Friday
NEW YORK, Oct 7 (Reuters) - ICE cotton sank on Monday to
post its biggest loss in over six weeks as the weakening of
Tropical Storm Karen eased worry over crop damage in the United
States, the world's top exporter, and as the U.S. government
shutdown and budget impasse kept investors skittish.

Cocoa Continues to Rise Due to Global Long-Term Supply Pressures
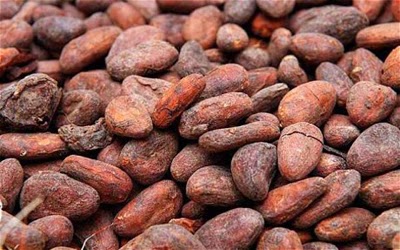
Money managers raised bullish bets on cocoa traded in London to a record as global shortages loom for the 2013-14 season that started this month, according to data from NYSE Liffe, the derivatives arm of NYSE Euronext.
Investors were net-long, or betting on higher prices, by 64,759 futures and options in the week ended Oct. 1, the Commitments of Traders report on the exchange’s website showed today. That was the largest bullish bet since publishing of trader holdings began in 2011 and compared with the previous record of 63,419 contracts in the week ended Sept. 24. The beans for December delivery fell 0.5 percent in the latest week.
from the Business Recorder of Pakistan:
NEW YORK: ICE cocoa climbed to a more than one-year high and London futures rallied to the highest in about two years on Monday as the International Cocoa Organization forecast a deficit in the next four years and as recent rains stoked worry of supply concerns in West Africa, the world's top growing region.
by the Public Ledger of Agra.net:
Cocoa futures closed significantly higher on Monday, underpinned by reports that global demand will outstrip supply, industry watchers said.
According to the International Cocoa Organization (ICCO), the global cocoa deficit will be 69,000-70,000 metric tonnes in 2013/14, up from 52,000 tonnes in 2012/13.

Corn Leaps Due to Storm Risk
Wheat and corn futures rose Monday after storms in the Midwest over the weekend threatened both crops.
Wheat for December delivery rose 7.75 cents to $6.9475 a bushel and December corn rose 6 cents to $4.4925 a bushel.
Weekend
storms delayed the harvest of the corn crop and also caused delays in
planting the winter wheat crop, said Todd Hultman, a grain analyst with
DTN/The Progressive Farmer in Omaha, Neb.

Stocks Sink Into the Close
News that a major broker doubled stock futures margins, along with the pressure of the continuing budget impasse in Washington, sank stock markets in the last hour of trading today, with the Dow closing down 136 points.
This was somewhat surprising, given that stocks had rallied out of the starting gate from deep losses, cutting those losses in half by mid-day.

Budget Impasse Doesn't Worry Wall St
Dow opened down more than 130 points, but is rallying sharply at the open. The continuing budget impasse doesn't appear to worry Wall St.


Thursday, October 3, 2013


Despite Turmoil in Washington, Stocks Still in Bubble Territory

Even after all the temporary and partial shutdowns of
various government agencies, and even with the decline of stocks by 128 points
today, the long-term charts of the S&P 500 show that stocks haven’t
declined very much, and remain in bubble territory!

Wall St Unconcerned About Partial Government Shutdowns
History would suggest that it will be short-term, but this time, Obama is refusing to negotiate at all with the House. Stocks are down only modestly, but appear to be in waiting mode, confident that imminent resolution will provide support for a relief rally. They may be waiting longer than they expect. Wall St has been blinded by both hubris and Fed easy money.


Monday, September 30, 2013
After Being Down 130 Points, Stocks Rally At Open
This despite that the budget and Obamacare impasse continues. Dow down only 90 now.


Sunday, September 29, 2013
Stocks Crushed on Obamacare/Budget Impasse
Dow is down 115 points! There appears to be no resolution in sight.

Thursday, September 26, 2013
What a Farce!
It's up! It's down! It's UP again! It's DOWN again!

Stocks Reverse Again, Rocket Higher Following Kocherlakota Speech Promising Still More Fed Intervention
from Business Insider:
Today, Minneapolis Fed President Narayana Kocherlakota, is suggesting we may need even more stimulus to get unemployment down and the economy humming.
The dovish Fed official employs buzz phrases like "whatever it
takes," and he even suggests the Fed should ignore warnings of asset
bubbles as it stimulates.
Quoting Kocherlakota:
"Doing whatever it takes in the next few
years will mean something different. It will mean that the FOMC is
willing to continue to use the unconventional monetary policy tools that
it has employed in the past few years. Indeed, it will mean that the FOMC is willing to use any
of its congressionally authorized tools to achieve the goal of higher
employment, no matter how unconventional those tools might be. Moreover,
doing whatever it takes will mean keeping a historically unusual amount
of monetary stimulus in place—and possibly providing more stimulus—even
as:
- Interest rates remain near historic lows.
- Economic growth rises above historical averages.
- Per capita employment begins to rise appreciably.
- Asset prices rise to unusually high levels, leading to concerns about “bubbles.”
- The medium-term inflation outlook rises temporarily above 2 percent.
And stocks have reversed again and are moving higher, after going back to dead flat.


Stocks Scream
The economic news must be terrible, because stocks levitated 100+ points in the first 30 minutes today.

Friday, September 20, 2013
Complete Reversal From Wednesday
The Fed appears to be losing not only its grip, but its credibility as well.

Stocks Give Back Most Post-FOMC Gains

It's not just stocks, either. Gold, grains, and even crude oil have collapsed. The Dollar has also taken back most of its post-FOMC announcement losses.
Still More Fed Fatigue

Fed Loses It's Muster
Virtually all the commodities that rose following the Fed's "no taper" decision on Wednesday have now reversed and declined sharply again, including soybeans, corn, and gold. The Euro has sold off again, and the US Dollar is rising!

Thursday, September 19, 2013
Bernanke's Bubble, Commodities Version

Wednesday, September 18, 2013

Bernanke's Bubble
This is what will one day come to be known decades from now as "Bernanke's Bubble". He has been perpetuating it now for nearly five YEARS! Today's Fed announcement is just the latest installment.

Today's Dollar Devastation
What more need be said? The Fed has said there will be NO tapering. None!
Prepare for destruction!

Friday, September 13, 2013
Bubble Status
Are we closer to a top, or a bottom?
This chart shows the stock market since the year 2000.

Monday, September 9, 2013

Tuesday, August 27, 2013
Crude Hits 2013 Price High
This is now the highest price for crude oil since May 2012. It's currently hovering around $109/barrel.

Friday, August 23, 2013

Thursday, August 22, 2013

Wednesday, August 21, 2013

Tuesday, August 20, 2013
I'm No Prophet, But I DO Make Profits!
I have studied and used various analytical techniques. In grad school, I studied "financial analysis" (balance sheets, P/E ratios, etc.) and "fundamentals analysis" (news, trends, etc.), and "market analysis". I've since studied technical analysis also. And now, of course, we have the dominant current analysis technique -- FED analysis (what the Fed is doing, saying). :) I've also studied Elliott Wave analysis with one of its most prominent practitioners. I've also studied what are called "fractals" and chaos theory. I've also recently studied bubble analysis with Didier Sornette, who is widely considered to be THE expert on log-periodic exponential asset bubbles. NONE is perfect, and ALL have serious flaws.
Technical analysis is not really a single analytical technique. There are as many variations as there are people who practice it.
But in my readings, I eventually ran across a book by Phillippe Cahen, who used a technique unlike anything I had seen before. He was an upper-level executive for one of Europe's largest investment banks, so he had instant credibility. I then bought others of his books, and the most recent ones were written in French. I spent 8 weeks translating them into English. Cahen had developed and mastered a method which he copyrighted called Dynamic Technical Analysis.
He points out in his book that most other forms of technical analysis are static, but the financial markets are dynamic. I think this is one of that technique's flaws. Thus, in order to correctly reflect the dynamic nature of the financial markets requires a "dynamic" form of analysis.
Over time, I developed my own, which is as dynamic as the markets themselves. I use the market itself to tell me when to get in, when to get out, etc. It takes bits and pieces from various analytical methodologies. I don't dismiss any analytical technique, but I also don't limit myself to any method either.
In my studies, I also made the acquaintance of a man whose name I never learned. But a close friend of his revealed to me that Phantom is a famous investor on Wall St, and a immensely wealthy man. He referred to himself only as Phantom. He offered me a book online FREE called "Phantom's Gift". In it, he doesn't offer a technique, but instead, teaches principles. That struck a chord with me, and I absorbed those principles into my own methods.
As for accuracy, I know of NO ONE, and NO analytical method, that is consistently accurate. Kyle Bass accurately predicted the real estate housing crash, so I follow his writings. He has credibility due to his track record. He made billions for the investors of his hedge fund. But other people who have accurately predicted other market phenoms have subsequently been wrong. This anomaly appears to be the rule rather than the exception. Just because someone hit a home run today doesn't mean the won't strike out tomorrow. This has lead me to devise and state to myself a little aphorism:
"Predicting the future is for prophets, not profits."
I'm no prophet. But I do make profits!
The Bubble From a Time Perspective

Not Much Correction Here
The recent correction in stocks hasn't changed the appearance of the long-term charts very much. Stocks still haven't even dropped to the 20-period moving average, and are closer to the top, than the bottom of the channel. Stocks haven't even come close to the exponential moving average!

The Bubble Lives On!
We're seeing a short-covering rally today in stocks. Wall St is still asleep!
“...a pack of lemmings looks like a group of individualists compared to
Wall Street once it gets a concept in its teeth.” Warren Buffett
“Faith in central banks today is equivalent to faith in the word dot-com
in 1999 or faith in the eternal rise of housing prices in 2006.” John
Mauldin

Wednesday, August 14, 2013


Monday, August 12, 2013
Is This a Bubble Yet?

"Wow. I didn't think we could push the Sornette bubble singularity beyond May, but we've gone to the edge of the edge." John Hussman, PhD
Thursday, August 8, 2013
What Is the Triffin Paradox (or Dilemma)?
from FT.com:
This is where incessant foreign demand for a reserve currency would force its issuing country to run persistent current account deficits. [1]
A reserve currency is a foreign currency that is traditionally held
in countries’ official reserves because of its global importance as a
medium of exchange and its inherent stability.
The reserve-currency country enjoys the consumption benefit of
running a trade deficit, while the rest of the world benefits from the
additional liquidity, which helps facilitate trade.
The cost comes from the declining value and credibility of any
currency which runs a persistent trade deficit - eventually leading to a
reluctance of creditors to hold the reserve currency. [2]
ExampleAs Francis Warnock (professor at the
University of Virginia's Darden School of Business) points out in a
paper for the Council On Foreign Relations, in 2010, the US confronted a
dilemma first identified in 1960 by the Belgian-born Yale economist
Robert Triffin.
To supply the world’s risk-free asset, the country at the heart of
the international monetary system has to run a current account deficit.
In doing so, it becomes more indebted to foreigners until the risk-free
asset ceases to be risk-free.
Sunday, July 28, 2013

Thursday, July 25, 2013

Wednesday, July 24, 2013
What Is Backwardation?
from Mish Shedlock:
Recall the definition of backwardation: Current price above future delivery price.
There are many reasons this can happen with commodities, but the typical
explanations are: temporary short-term supply shortage, expected future
supply, or expected falling demand.
Tuesday, July 23, 2013
Ben Bernanke Is Going to Blow Up the House
"What
all this clearly demonstrates is that everywhere you look, the language
emanating from governments and central banks is becoming more and more
difficult to sort out; and I am afraid there is a very simple reason for
that: they have ventured into uncharted realms and have absolutely no
idea how they will ever find their way back.
"The one thing I am
certain of, though, is that the trip our so-called leaders are taking us
on will end in disaster, and perhaps by using a disastrous outcome as
the cipher key we may find that all the symbols fall neatly, if
disturbingly, into place."
Grant Williams, chief investment strategist for Mauldin Economics
"Thus,
when I contemplate the amount of damage that will be done by four years
(and counting) of QE, I really just shudder in wonder at how big the
disaster might be, though there is no doubt it will be a disaster. The
Fed has expanded its balance sheet to $3.5 trillion and now owns over
20% of outstanding U.S. debt.
"Either it is going to continue to
buy bonds forever, which is impossible, or there is going to be a
massive dislocation at some moment in time because someone else is going
to have to buy that debt when the Fed ultimately stops, even if it
doesn't choose to sell anything (and just lets the debt run off). There
will be no painless extrication from QE, and as I have said, I don't
believe the Fed will be able to leave ZIRP willingly."
Bill Fleckenstein of Fleckenstein Capital
Tuesday, July 16, 2013

Monday, July 15, 2013
Stocks Just Inches From New All-Time Record Highs
After two days of record closing highs near the end of last week, stocks are now just inches away from fresh all-time record highs. Once Ben Bernanke indicated that he was going to continue QE indefinitely, stocks once again have gone endlessly skyward in true bubble fashion.

Subscribe to:
Comments (Atom)


