Sunday, July 17, 2011

John Mauldin: Hard Dose of Economic Reality

This week we are going to revisit some themes concerning the problems of the debt and the deficit. I am getting a number of questions, so while long-time readers may have read most of this in one letter or another, it is clearly time for a review, especially given the deficit/debt-ceiling debate. I will probably offend some cherished beliefs of most readers, but that is the nature of the times we live in. It is the time of the Endgame, where things are not as black and white as they have been in the past.
Let’s begin with a question that is representative of a lot of the questions I have been getting, from reader John:
“John, it appears that you're arguing that two contradictory things have the same effect: adding government spending doesn't help the economy, and reducing government spending hurts the economy. Which is it? At first, you say that adding government spending doesn't help, no new jobs are actually created, it fails the sharp pencil test, etc. So, we should reduce this waste, right? Well, yes, you say, but that will reduce GDP too. I just don't get it. You seem to have it both ways: increasing government spending is bad, and reducing it is bad. What is your point?”
Yes, I am saying both things, and they are not contradictory. We are coming to the end of the debt supercycle in the US, and have reached that point in much of Europe, and soon will in Japan. So while I am going to focus on the US, at least this week, the same principles apply to all the developed world.
For some 65-odd years, we have added to the national debt – individually, corporately, and as governments. But as Greece is finding out, there is a limit (more on that later). Eventually the bond market decides that loaning you more money is not a high-value proposition. If your home or your government is debt financed, you are forced to cut back. While the US is not there yet, we soon (as in a few years) will be.
One way or another, the budget deficits are going to come down. As we will see later, we can choose to proactively deal with the deficit problem or we can wait until there is a crisis and be forced to react. These choices result in entirely different outcomes.
In the US, the real question we must ask ourselves as a nation is, “How much health care do we want and how do we want to pay for it?” Everything else can be dealt with if we get that basic question answered. We can radically cut health care along with other discretionary budget items, or we can raise taxes, or some combination. Both have consequences. The polls say a large, bipartisan majority of people want to maintain Medicare and other health programs (perhaps reformed), and yet a large bipartisan majority does not want a tax increase. We can’t have it both ways, which means there is a major job of education to be done.
The point of the exercise is to reduce the deficit over 5-6 years to below the growth rate of nominal GDP (which includes inflation). A country can run a deficit below that rate forever, without endangering its economic survival. While it may be wiser to run some surpluses and pay down debt, if you keep your fiscal deficits lower than income growth, over time the debt becomes less of an issue.

GDP = C + I + G + Net Exports

But either raising taxes or cutting spending has side effects that cannot be ignored. Either one or both will make it more difficult for the economy to grow. Let’s quickly look at a few basic economic equations. The first is GDP = C + I + G + net exports, or GDP is equal to Consumption (Consumer and Business) + Investment + Government Spending + Net Exports (Exports – Imports). This is true for all times and countries.
Now, what typically happens in a business-cycle recession is that, as businesses produce too many goods and start to cut back, consumption falls; and the Keynesian response is to increase government spending in order to assist the economy to start buying and spending; and the theory is that when the economy recovers you can reduce government spending as a percentage of the economy – except that has not happened for a long time. Government spending just kept going up. In response to the Great Recession, government (both parties) increased spending massively. And it did have an effect. But it wasn’t just the cost of the stimulus, it was the absolute size of government that increased as well.
And now massive deficits are projected for a very long time, unless we make changes. The problem is that taking away that deficit spending is going to be the reverse of the stimulus – a negative stimulus if you will. Why? Because the economy is not growing fast enough to overcome the loss of that stimulus. We will notice it. This is a short-term effect, which most economists agree will last 4-5 quarters; and then the economy may be better, with lower deficits and smaller government.
However, in order to get the deficit under control, we are talking on the order of reducing the deficit by 1% of GDP every year for 5-6 years. That is a very large headwind on growth, if you reduce potential nominal GDP by 1% a year in a world of a 2% Muddle Through economy. (And GDP for the US came in at an anemic 1.75% yesterday, with very weak final demand.)
Further, tax increases reduce GDP by anywhere from 1 to 3 times the size of the increase, depending on which academic study you choose. Large tax increases will reduce GDP and potential GDP. That may be the price we want to pay as a country, but we need to recognize that there is a hit to growth and employment. Those who argue that taking away the Bush tax cuts will have no effect on the economy are simply not dealing with either the facts or the well-established research. (Now, that is different from the argument that says we should allow them to expire anyway.)

Increasing Productivity

There are only two ways to grow an economy. Just two. You can increase the working-age population or you can increase productivity. That’s it. No secret sauce. The key is for us to figure out how to increase productivity. Let’s refer again to our equation:
GDP = C + I + G + net exports
The I in the equation is investments. That is what produces the tools and businesses that make “stuff” and buy and sell services. Increasing government spending, G, does not increase productivity. It transfers taxes taken from one sector of the economy and to another, with a cost of transfer, of course. While the people who get the transfer payments and services certainly feel better off, those who pay taxes are left with less to invest in private businesses that actually increase productivity. As I have shown elsewhere, over the last two decades, the net new jobs in the US have come from business start-ups. Not large businesses (they are a net drag) and not even small businesses. Understand, some of those start-ups became Google and Apple, etc.; but many just become good small businesses, hiring 5-10-50-100 people. But the cumulative effect is growth in productivity and the economy.
Now, if you mess with our equation, what you find is that Investments = Savings.
If the government “dis-saves” or runs deficits, it takes away potential savings from private investments. That money has to come from somewhere. Of late, it has come from QE2, but that is going away soon. And again, let’s be very clear. It is private investment that increases productivity, which allows for growth, which produces jobs. Yes, if the government takes money from one group and employs another, those are real jobs; but that is money that could have been put to use in private business investment. It is the government saying we know how to create jobs better than the taxpayers and businesses we take the taxes from.
This is not to argue against government and taxes. There are true roles for government. The discussion we must now have is how much government we want, and recognize that there are costs to large government involvement in the economy. How large a drag can government be? Let’s look at a few charts. The first two are from my friend Louis Gave, of GaveKal. This first one reveals the correlation between the growth of GDP in France and the size of government. It shows the rate of growth in GDP and the ratio of the size of the public sector in relation to the private sector. The larger the percentage of government in the ratio, the lower the growth.

I know, you think this is just the French. We all know their government is too involved in everything, don’t we. But it works in the US as well. The chart below shows the combined US federal, state, and local expenditures as a percentage of GDP (left-hand scale, which is inverted) versus the 7-year structural growth rate, shown on the right-hand side. And you see a very clear correlation between the size of total government and structural growth. This chart and others like it can be done for countries all over the world.

Now let’s review a graph from Rob Arnott of Research Affiliates. The chart needs a little setup. It shows the contributions of the private sector and the public sector to GDP. Remember, the C in our equation was private and business consumption. The G is government. And G makes up a rather large portion of overall GDP.
The top line (in dark blue) is real GDP per capita. The next line (yellow) shows what GDP would have been without borrowing. So a very real portion of GDP the last few years has come from government debt. Now, the green line below that is private-sector GDP. This is sad, because it shows that the private sector, per capita, is roughly where it was in 1998. The growth of the “economy” has been limited to government.

Notice that real GDP without government spending or deficits has been flat for 15 years (which, as a sidebar, also explains why real wages for private individuals are flat as well, but that’s a topic for another letter). Now, here is what to pay attention to. For the last several years, the real growth in GDP has come from the US government borrowing money. Without that growth in debt, we would be in what most would characterize as a depression.
This is why Paul Krugman and his fellow neo-Keynesians argue that we need larger deficits, not smaller ones. For them the issue is final aggregate consumer demand, and they believe you can stimulate that by giving people money to spend and letting future generations pay for that spending. And sine WW2 they have been right, kind of. When the US has gone into a recession, the government has embarked on deficit spending and the economy has recovered. The Keynesians see cause and effect. And thus they argue we now need more “hair of the dog” to prompt the recovery, which is clearly starting to lag behind what they think of as normal growth.
But others (and I am in this camp) argue that business-cycle recessions are normal and that recoveries would come anyway, and are not caused by increased government debt and spending but by businesses adjusting and entrepreneurs creating new companies. Correlation is not causation. Just because recoveries happened when the government ran deficits does not mean that they were the result of government spending. This is not to argue that the government should not step in with a safety net for the unemployed – again, a subject for another letter.
Let’s see what Rob Arnott says about this conundrum:
“GDP is consumer spending, plus government outlays, plus gross investments, plus exports, minus imports. With the exception of exports, GDP measures spending. The problem is, GDP makes no distinction between debt-financed spending and spending that we can cover out of current income.
“Consumption is not prosperity. The credit-addicted family measures its success by how much it is able to spend, applauding any new source of credit, regardless of the family income or ability to repay. The credit-addicted family enjoys a rising “family GDP” – consumption – as long as they can find new lenders, and suffers a family “recession” when they prudently cut up their credit cards.
“In much the same way, the current definition of GDP causes us to ignore the fact that we are mortgaging our future to feed current consumption. Worse, like the credit-addicted family, we can consciously game our GDP and GDP growth rates – our consumption and consumption growth – at any levels our creditors will permit!
“Consider a simple thought experiment. Let’s suppose the government wants to dazzle us with 5% growth next quarter (equivalent to 20% annualized growth!). If they borrow an additional 5% of GDP in new additional debt and spend it immediately, this magnificent GDP growth is achieved! We would all see it as phony growth, sabotaging our national balance sheet – right? Maybe not. We are already borrowing and spending 2% to 3% each quarter, equivalent to 10% to 12% of GDP, and yet few observers have decried this as artificial GDP growth because we’re not accustomed to looking at the underlying GDP before deficit spending!
“From this perspective, real GDP seems unreal, at best. GDP that stems from new debt – mainly deficit spending – is phony: it is debt-financed consumption, not prosperity. Isn’t GDP after excluding net new debt obligations a more relevant measure? Deficit spending is supposed to trigger growth in the remainder of the economy, net of deficit-financed spending, which we can call our “Structural GDP.” If Structural GDP fails to grow as a consequence of our deficits, then deficit spending has failed in its sole and singular purpose.
“Of course, even Structural GDP offers a misleading picture. Our Structural GDP has grown nearly 100-fold in the last 70 years. Most of that growth is due to inflation and population growth; a truer measure of the prosperity of the average citizen must adjust for these effects.”
And thus the graph above showing private GDP and the difference in the GDP numbers that are reported in the media. I used Rob’s entire (and brilliant) piece as an Outside the Box last May. If you missed it, you can go to http://www.johnmauldin.com/outsidethebox/does-unreal-gdp-drive-our-policy-choices/
 
and review it.

The Trillion Dollar Question

Now, in our review, let’s get back to reader John’s question. I have used this chart before, but it bears another quick look. This is from the Heritage Foundation. It is a year old, and one can quibble about the specifics. That is not the point of today’s issue. The point is that, whatever the deficit is, it is huge. This is a chart of something that will not happen, as the bond market will simply not finance a deficit as large as the one that looms in our future. Long before we get to 2019, we will have our own Greek (or Irish or Portuguese or Japanese, etc.) moment. (Or Spanish or Italian or Belgian – so many countries, so much debt!)

For the sake of the argument and our thought experiment, let’s split the difference on that chart. Somehow we must then find about $1.2 trillion in cuts or taxes to get the deficit down to below the growth rate of nominal GDP. And another few hundred billion if we actually want to balance the budget.
And that, gentle reader, is no small hill to climb. Let’s say we cut spending and/or raise taxes by $200 billion a year for 6 years. That is more than 1% of GDP each and every year! Go back to the first chart. That means that potential GDP growth will be reduced by over 1% a year! Every year. We would need to rely upon private GDP growth, which Rob’s chart shows has been flat for almost 15 years! The growth of the last 11 years has been a government-financed illusion.
There are no good choices. The time for good choices was years ago. I was and still am a fan of the Bush tax cuts. They were not the problem; a few years after the cuts, tax revenues were up considerably. The problem was a profligate Republican Congress which allowed spending to rise even more. And you can’t just blame it on the wars. That contributed, but it was not even close to the lion’s share. If we had held the line on spending, we would have paid off the entire debt and been in good shape when the crisis hit in 2008. The following graph is from today’s Wall Street Journal editorial page. They use it to show how much Democrats allowed the budget in terms of GDP to rise and spin out of control.
I would point out that in the 8 previous years, under Bush/Hastert/Delay et al., there was also a rise in the growth of government, as the chart shows. While it was not as large, it was clearly there. The drop in the previous period was the Bill Clinton/Newt Gingrich years. How many people are nostalgic for that pairing? Say what you will about them, their collaboration was a good era for growth in the private sector – the last we have had.

And that is the crux of the problem. Either we willingly cut the deficit by a far more significant amount than anyone is discussing, or we hit the wall at some point and become Greece. $4 trillion? No, let’s talk about 10 or 12.
And that, John, is the problem. We have painted ourselves into the corner of no good choices. We are left with difficult and disastrous choices. We have condemned ourselves to a slow-growth, Muddle Through Economy for another 5-6 years, at best, as we are forced to right-size government. If we raise taxes to partially solve the problem, we have to recognize that higher taxes will result in slower private growth. That’s just the rules. There are no easy buttons to push.
So, we must cut spending and the deficit, and yes, it is going to slow the economy for a period of time. The economic literature suggests that a spending cut will have 4-5 quarters of effect and then be neutral going forward. But we are going to have to make those cuts year after year after year.
I know the Tea Party types want to do it all at once, but that would guarantee a decade-long depression. You just really don’t want to go there. It MUST be a slower, controlled “glide-path” approach. I wrote about this back in 2009, along with all the other options. Nothing has changed: http://www.johnmauldin.com/frontlinethoughts/the-glide-path-option-mwo110609/
 
. The present contains all possible futures. But not all futures are good ones. Some can be quite cruel. The one we actually get is determined by the choices we make.
It is getting time to close, so a few quick observations. While choosing a President and Congress next year will be a referendum of sorts, I would like to see a real, non-binding referendum appear on our primary ballots. How much Medicare do we want? Should we raise taxes? How do we get to $10 trillion in cuts? You would have to confirm you have read a 20-page document outlining the choices and consequences, and that should be posted everywhere and mailed to everyone. We need to have a real national conversation.p>
If Obama says he wants $4 trillion in cuts, then let him give us details rather than asking Congress to give him a plan, as he did today. He has his brain trust; surely they can come up with some details. The problem is that if he offers specifics he will have to show his supporters what he is willing to cut. And those cuts will not be without pain.
The real issue, as I have said, will boil down to how much Medicare we want and how we want to pay for it. Congressman Ryan’s cuts don’t get us even halfway there.

A Summer of Ultimatums

In closing, this from my friends at GaveKal:
“ In the past 24 hours, we have seen the Greek deputy finance minister announce that Athens would fall far short of planned asset sales (this can only come as a surprise to investors born yesterday) and the Greek prime minister publish an open letter to Eurogroup Chairman Juncker warning that Greece has done all that it could. Mr Panandreaou went on to say that the onus is now on European policymakers to meet in a closed forum, with no damaging press leaks, and emerge with a strong, unambiguous message – we have to assume that the irony of asking for more secrecy through an open letter to the general media was perhaps lost on the Greek PM. Diplomacy aside, it seems that Greece is placing an ultimatum on Europe and this for a very simple reason: the end game for the EMU is approaching much faster than most investors had expected. Indeed, the choice between fiscal union or disintegration may well have to be faced this very summer.
“In his eloquent letter, Papandreou boldly stated that, in essence, Greece is no longer prepared to make further concessions and will thus blow up Europe's financial system if it is subjected to any more pressure. In other words, it is now time for all additional concessions to come from the side of Germany, the ECB and the EU. The willingness of Papandreou to speak so boldly is hugely important since it marks a recognition by the debtors that they now have the whip-hand in these negotiations. The Greeks (and Irish) for some reason failed to realize their power last year, but they do now. This transforms the balance of power in the negotiations. As a result, Germany and the ECB have reached the moment of truth – either they comply with the debtor countries' demands or they abandon the euro. This ultimatum probably helps explain why the euro has been so weak and why it should be heading even lower.”
There will be yet another emergency meeting next Thursday. The crisis is coming to the final innings. Will Germany and the ECB finance Greece? Print money in a fashion that would make Bernanke and Krugman envious? But if we in the US do not get our own act together, in the not-too-distant future we will face our own moment of truth as the bond market forces us to choose between disastrous and worse. The cuts we will have to make under pressure will be far worse than those we can make now.

Friday, July 15, 2011

Empire Manufacturing Disappoints Market, Too!

But stocks are positive again. I won't touch this market as long as Wall Street continues to ignore all the horrific economic data. 

from Zero Hedge:


So much for the Empire Manufacturing index being a harbinger of an economic pick up. With virtually everyone on Wall Street expecting a positive print, with the average at +5.00, the actual number of -3.76 comes as yet another confirmation of the (f)utility of Wall Street groupthink. While it was a modest bounce from the June -7.79, this first July manufacturing indication, which coming negative means the contraction is now well into its second month, and has ugly undertones for Q3 GDP, which we expect most banks will revise their expectations lower in the aftermath of yesterday's JPM downgrade of the US economy. And while there was some good margin news with Prices Paid dropping by 13, or more than Prices Received which declined by 6 points, a far more troubling indicator this month is the collapse in the Number of Employees Index to 1.11 from 10.20, or the lowest of 2011. This is not good for July NFP numbers after the already atrocious June employment data. Elsewhere on the inflationary front, CPI missed expectations of a -0.1% drop, instead printing at -0.2%, the lowest since June 2010. The reason was the 4.4% plunge in the Energy Index, the largest drop since December 2008. That said, the core CPI was unchanged at 0.3%, higher than expectations of 0.2%, due to increases in prices for shelter, apparel, new vehicle, used cars and trucks and medical care. In other words: all the things that people need right after food and gas. We would venture to guess that in addition to S&P < 1,000, core CPI coming in negative is the other QE3 gating factor.

Still More Bad News

Stocks just went negative!

Ugly Day for Trading!

from Zero Hedge:


Today's bad economic data trifecta is complete, with the UMichigan consumer confidence number plummeting to 63.8 from 71.5, and well below consensus of 72.2. The number is far below the lowest Wall Street prediction of 68 (upper end of range was 75) and the worst since March 2009. The good thing for the Fed's QE3 plans is that high future inflation expectations are getting unanchored, with 1 year expectations down from 3.8% to 3.4%, and 5 Year down to 2.8% from 3.0%. A little lower and it will be just right.

h/t John Lohman

Gold Is Money


And this, during the season of the year when gold is historically weak.

by Ambrose Evans-Pritchard of UK Telegraph:

As the twin pillars of international monetary system threaten to come tumbling down in unison, gold has reclaimed its ancient status as the anchor of stability. The spot price surged to an all-time high of $1,594 an ounce in London, lifting silver to $39 in its train. 

On one side of the Atlantic, the eurozone debt crisis has spread to the countries that may be too big to save - Spain and Italy - though RBS thinks a €3.5 trillion rescue fund would ensure survival of Europe's currency union.
On the other side, the recovery has sputtered out and the printing presses are being oiled again. Brinkmanship between the Congress and the White House over the US debt ceiling has compelled Moody's to warn of a "very small but rising risk" that the world's paramount power may default within two weeks. "The unthinkable is now thinkable," said Ross Norman, director of thebulliondesk.com.
Fed chair Ben Bernanke confessed to Congress that growth has failed to gain traction. "Deflationary risks might re-emerge, implying a need for additional policy support," he said.
The bar to QE3 - yet more bond purchases - is even lower than markets had thought. The new intake of hard-money men on the voting committee has not shifted Fed thinking, despite global anger at dollar debasement under QE2.
Fuelling the blaze, the emerging powers of Asia are almost all running uber-loose monetary policies. Most have negative real interest rates that push citizens out of bank accounts and into gold, or property. China is an arch-inflater. Prices are rising at 6.4pc, yet the one-year deposit rate is just 3.5pc. India's central bank is far behind the curve.
"It is very scary: the flight to gold is accelerating at a faster and faster speed," said Peter Hambro, chairman of Britain's biggest pure gold listing Petropavlovsk.
"One of the big US banks texted me today to say that if QE3 actually happens, we could see gold at $5,000 and silver at $1,000. I feel terribly sorry for anybody on fixed incomes tied to a fiat currency because they are not going to be able to buy things with that paper money."
China, Russia, Brazil, India, the Mid-East petro-powers have diversified their $7 trillion reserves into euros over the last decade to limit dollar exposure. As Europe's monetary union itself faces an existential crisis, there is no other safe-haven currency able to absorb the flows. The Swiss franc, Canada's loonie, the Aussie, and Korea's won are too small.
"There is no depth of market in these other currencies, so gold is the obvious play," said Neil Mellor from BNY Mellon. Western central banks (though not the US, Germany, or Italy) sold much of their gold at the depths of the bear market a decade ago. The Bank of England wins the booby prize for selling into the bottom at €254 an ounce on Gordon Brown's orders in 1999. But Russia, China, India, the Gulf states, the Philippines, and Kazakhstan have been buying.
China is coy, revealing purchases with a long delay. It has admitted to doubling its gold reserves to 1,054 tonnes or $54bn. This is just a tiny sliver of its $3.2 trillion reserves. China's Chamber of Commerce said this should be raised eightfold to 8,000 tonnes.
Xia Bin, an adviser to China's central bank, said in June that the country's reserve strategy needs an "urgent" overhaul. Instead of buying paper IOU's from a prostrate West, China should invest in strategic assets and accumulate gold by "buying the dips".
Step by step, the world is edging towards a revived Gold Standard as it becomes clearer that Japan and the West have reached debt saturation. World Bank chief Robert Zoellick said it was time to "consider employing gold as an international reference point." The Swiss parliament is to hold hearings on a parallel "Gold Franc". Utah has recognised gold as legal tender for tax payments.
A new Gold Standard would probably be based on a variant of the 'Bancor' proposed by Keynes in the late 1940s. This was a basket of 30 commodities intended to be less deflationary than pure gold, which had compounded in the Great Depression. The idea was revived by China's central bank chief Zhou Xiaochuan two years ago as a way of curbing the "credit-based" excess.
Mr Bernanke himself was grilled by Congress this week on the role of gold. Why do people by gold? "As protection against of what we call tail risks: really, really bad outcomes," he replied.
Indeed.


What IS This? A Yo-Yo?

The previous plunge, and now this, all within five minutes. Time to sit back and wait for stability to return.

Plunge!

Poor Economic Data Ignored (As Usual) By Wall Street

Market chopping higher today!

from CNBC:

"We are getting a very, very sharp rebound in core inflation and much more than the Fed had bargained for. We will be at price stability and possibly through it before the end of this year," said Eric Green, chief economist at TD Securities in New York.
A separate report showed a gauge of manufacturing in New York State fell again in July. The New York Federal Reserve said its "Empire State" general business conditions index was at minus 3.76 from minus 7.79 in June.
High inflation, driven by strong energy and food prices, undermined economic activity in first quarter, with growth slowing sharply to a 1.9 percent annual rate after a brisk 3.1 percent expansion in the final three months of 2010.

Thursday, July 14, 2011

QE3 Guaranteed to Fail

by John Defeo
NEW YORK (TheStreet) -- Whether or not the Federal Reserve opts to make more large-scale asset purchases (colloquially referred to as "QE3") remains to be seen -- but I suspect that Ben Bernanke himself is beginning to realize that QE3 is guaranteed to fail.
Bernanke told Congress on Wednesday that the Fed is ready to provide additional monetary stimulus should the U.S. see adverse economic developments. On Thursday, Bernanke qualified his statement, saying that the Fed is "not prepared at this point to take further action."
Let's analyze the situation:

So What Exactly is Quantitative Easing, Anyway?

Quantitative easing is when the United States' central bank, the Federal Reserve, buys U.S. Treasury bonds.
  • Treasury bonds are a future obligation of the United States, paid out with Federal Reserve notes (dollars).
  • Federal Reserve notes are a current obligation of the United States, redeemable for goods and services.
If the Federal Reserve purchases bonds directly from the United States Treasury, they are exchanging dollars (current obligations) for future obligations. This is inflationary if the amount of obligations (money) is increasing faster that the amount of capital (goods, services, products and ideas).
However -- the Federal Reserve doesn't buy bonds from the Treasury, it buys them from "primary dealers." Primary dealers are a network of banks (including Goldman Sachs(GS), JPMorgan Chase(JPM) and Citigroup(C)) that are obligated to buy bonds from the U.S. and serve as a trading partner with the Federal Reserve.
The triangular relationship between the U.S. Treasury, Federal Reserve and major banks can be a head-scratcher -- but make no mistake, this relationship is making some people rich (we'll touch on this point later).

Criteria for the [Long Term] Success of Quantitative Easing

  1. If banks are facing a liquidity crisis -- and because of this fact -- are unwilling to lend to qualified borrowers.
  2. If qualified borrowers want to borrow money -- and most importantly, are willing to invest in entrepreneurial ideas that will provide a return on invested capital.
Quantitative easing could hypothetically improve the U.S. economy, for the long term, if both of the above criteria are met. Unfortunately, this is not the reality of our situation.
Thanks to taxpayer-funded bailouts and the first two rounds of quantitative easing, major U.S. banks are adequately reserved (in other words, they are liquid). The problem lies in point No. 2: Statements from major banks suggests a drought of qualified borrowers.
Creditworthy individuals (however small this segment of the population might be) are not borrowing. We can blame the uncertainty of tax policies, the staggering unemployment figures or the overall fragility of the economy. But at the end of the day, creditworthy individuals aren't borrowing.
The banks don't need further reserves -- the people need confidence. And confidence comes from the leadership, foresight and conviction from our elected officials, not the Federal Reserve.

Is Quantitative Easing Helping Anyone?

Yes, unfortunately.
Quantitative easing is providing major banks with arbitrage opportunities (risk-free trading profits). Goldman Sachs can buy a bond from the Treasury on Monday and sell it to the Federal Reserve on Tuesday (at a profit) -- the blog ZeroHedge has named this game "Flip That Bond."
Quantitative easing is also helping elected officials shirk their duties to the American public -- in a sense, enabling politicians to spend money the country does not have (or make good on promises that should be broken). Forbes' William Baldwin illustrates this concept beautifully.
"The government wants to spend $1,000 it doesn't have. So it sells a bond. The [ultimate] buyer is the Federal Reserve. The Fed pays for the bond with some folding money. The Treasury spends the $1,000 on farm subsidies or whatever.
The Fed makes a show of treating the $1,000 bond as an investment. It collects $40 in interest from the Treasury. But this is a charade. The Fed declares the $40 (after some overhead costs) as profit and sends the profit right back to Treasury. In reality, the interest payment never left the Treasury building.
When the dust settles, this is what has happened. The farmer has $1,000 of cash. The government did not get this cash by collecting taxes. It got the cash by creating it."

Has Quantitative Easing Ever Been Tried Before? If So, Has It Worked?

Yes -- and to the second question, I don't see any evidence it has worked.
In 1961, the Fed embarked on a similar strategy known as "Operation Twist." But Twist was dismissed as a failure by most, while others blamed the lack of efficacy on the small scale of the operation.
Quantitative easing was attempted again -- on a larger scale -- by Japan in 2001. More than a decade later, Japan has not escaped its problems, and Masaaki Shirakawa, governor of the Bank of Japan, stated that if "short-term stimulative policy measures" are the only cure, then "[policy makers] face a risk of writing the wrong policy prescription."
Unfortunately, some prominent U.S. economists (notably, Larry Summers and Paul Krugman) don't view this history as a cautionary tale, instead suggesting that stimulus only fails when enough of it wasn't done. To this point, I wholeheartedly agree with Mike "Mish" Shedlock's statement, "The disgusting state of affairs is that bureaucratic fools in the EU, US and everywhere else, all believe the cure is the same as the disease if only done in big enough size."

What's the Worst Case Scenario for the Economy

The worst-case scenario is that the nation's banks, under political pressure to lend (see Masaaki Shirakawa's statement above), begin making loans to corporations and individuals that are not creditworthy. Of course, this is exactly how the financial crisis came to fruition, and like before, will end in tears for the greater American public.

Is Ben Bernanke the Problem

I do not think Ben Bernanke is evil or stupid (nor do I think he is insane), rather, I prefer to think of him as a kindly-yet-timid doctor prescribing an obese patient antidepressants. The doctor knows that only the patient can solve the patient's problems, but the doctor lacks the courage to tell the patient, "Go on a diet, get some exercise and get the hell out of my office!"
--Written by John DeFeo in New York City

Retail "Snails" Sink Stocks

Jobless claims, over 400,000 for 14 consecutive weeks, didn't help either. We're now near the lows of the day, with the Dow down about 70 points. The brief rally, shown above, was a false rumor that a debt deal had been reached. Tirades and tantrums were the order of the day yesterday from the Teleprompter Tyrant! 

WASHINGTON (AP) — U.S. businesses added to their stockpiles for a 17th consecutive month in May. But sales fell for the first time in nearly a year, a sign that many companies could be forced to trim supply levels if the economy weakens.
Business supply levels grew 1 percent in May, the Commerce Department said Thursday. Sales fell for the first time in 11 months. It was the worst showing for sales since June of last year.

Wednesday, July 13, 2011

Phase 2 of Crisis: Era of Broken Promises

This graph had the comment shown following:


Phase 2 of the crisis:  "Broken Promises".  Where everyone is awakening to the fact that all of the promises made implictly (through fiat currency, a claim on future wealth), or explicitly (e.g. medicare, social security), are seen to be in conflict.  Not all promises will come true, so whose promise will be kept.
It will gradually dawn on everyone that none of the promises will be kept.
There will be great disillusionment at all levels of every society, globally.  If there's one thing you can do, beyond helping yourself and others, it's to help others deal with the grief of a dead illusion.  Beyond starving, that will be one of the hardest things for people to bear. -- comment by commenter Fiat2Zero on Zero Hedge

The Price of Rice

Rice was limit up today:


And from the daily chart, it isn't the first time in recent days:
Rice is becoming very expensive!

Dow Relinquishes All But 20 Points of 160-Point Gain

Wow! What a reversal today! If there was a full POMO, this would never have happened! This is far more typical of historical patterns. We are definitely climbing a new wall of worry. This is my favorite type of trading, because I can make money trading both directions.

Typical Bernanke Reversal


As is typical for any time that the Fed Chairman opens his mouth, the market has now completely reversed the impact of his words today. The large green candle at the top left of this chart is the market's reaction to his prepared statement. It is typical for the market to completely reverse the impact of Bernanke's remarks within hours of said statements. The stock market is still significantly higher for the day, despite this reversal. But we still have more than 40 minutes in the session, too, and the market is now accelerating to the downside as I type this!

Grains Respond to Bernanke's Calls for (Transitory) Inflation!

Sugar High! It May Be the Only One I Can Afford!

Bernanke Creams Dollar

Gold Reaches Another Record

And based upon what Bernanke is saying today, it's going to go much higher.

Wall Street Loves "Bubbles" Bernanke

But they hate (economic) freedom! This is the market reaction to Bernanke's promise of more money creation to come!

Tuesday, July 12, 2011

Chinese Bailout of Europe Incites Rally

It's a choppy, low-volume market today! The Dow futures were down 100 points until China announced its most recent bailout of Europe. What is their motive? Why would a sovereign wealth fund prop up a failing, insolvent country? Why would they seek to help a country that has overspent itself and is almost certain to default? This is one of those events that makes you go, "Hmmm!".

Monday, July 11, 2011

It's Getting Worse! Even Dollar Stores Feeling Pinched!

Wow! Check out that headline from CBS:


LOS ANGELES (CBS) —  More stores across the U.S. that offer deeply-discounted products are seeing their sales decline after years of growth amid America’s “Great Recession” — and one analyst said on Monday it’s another sign of even deeper downturn.
While the demand at stores like the 99-Cent Store or Dollar Tree is still relatively high, the biggest chains in the nation have fallen short of Wall Street’s expectations for several months, a trend that may prove even more ominous for the economy at large.
“I think what’s going on in those stores is that we are in a depression for 80 percent of Americans,” top retail analyst Howard Davidowitz told KNX 1070.
America’s three largest discount chains — Dollar General Corp., Family Dollar Stores Inc. and Dollar Tree Inc. —  all recently missed their quarterly earnings targets.
Davidowitz pointed to the weakness of the dollar and a gloomy consumer outlook as some of the factors behind the stores’ slump.
“In those stores, somebody comes in with $12 to do all their shopping,” said Davidowitz. “The person who used to come in with $12 now comes in with $8.”
“In other words, the economy is continuing to be worse, the Obama depression continues to explode,” he added.
Analysts say rising food and transportation prices are likely eating into the profit margins of discount stores, which risk driving away price-sensitive customers with any potential price hikes.
Core customers at most U.S. discount chains typically have a household income of $40,000 or less.

Dow Crushed 170 Points

Europe is crumbling.

Saturday, July 9, 2011

Friday, July 8, 2011

Fascinating Debt/Economics Presentation From a Biblical Ethical Perspective

Risk Off? Not In the Grains Markets!

This Is What a Depression Looks Like!

It's a Depression! Labor Force Participation Rate Plunges to 25-Year Low!

from Zero Hedge:

This chart needs no commentary. At 64.1%, the Labor Force Paritipcation rate just dropped to a fresh 25 year low: the civilian labor force declined by 272K from 153,693 to 153,421. And tangentially, the employment to population ratio also slumped to a multi decade low of 58.2%.

Gold, Treasuries Leap! Crude Oil, Dollar Plunge!

Gold


Treasuries

Crude Oil

Dollar

Awful Jobs Report!

There is simply no way to spin this positively! Dow futures plunged from +60 to -100 in about ten seconds! Without the birth/death "adjustment", we would have lost 113,000 jobs! But Wall St will ignore this and bid up stocks quickly!


from Zero Hedge:


Absolute disaster. Total jobs per the establishment survey: +18K on expectations of 105K, Private Jobs + 57K on expectations of 132K. Last month total was revised from 54K to 25K. Combined April and May revision down 44K. The household survey was down by 445K from 139,779 to 139,334. Birth death adjustment + 131K. Complete humiliation for Wall Street's economists, the lowest prediction of whom came Bob Brusca at +60K. From the NFP: "Nonfarm payroll employment was essentially unchanged in June (+18,000), and the unemployment rate was little changed at 9.2 percent, the U.S. Bureau of Labor  Statistics reported today. Employment in most major private-sector industries changed little over the month. Government employment continued to trend down." It is time for Joe LaVorgna to retire, with his 175K forecast, or off by a factor of 972%.
Birth Death:

Some key jobs categories:
Employment in government continued to trend down over the month (-39,000). Federal  employment declined by 14,000 in June. Employment in both state government and local government continued to trend down over the month and has been falling since the second half of 2008.

Manufacturing employment changed little in June. Following gains totaling 164,000 between November 2010 and April 2011, employment in this industry has been flat for the past 2 months. In June, job gains in fabricated metal products (+8,000) were partially offset by a loss in wood products (-5,000).

Construction employment was essentially unchanged in June. After having fallen sharply during the 2007-09 period, employment in construction has shown little movement on net since early 2010.
There is no sugarcoating this report. Absolutely abysmal.

Thursday, July 7, 2011

Market Doubles Good News, Ignores Bad News

"Who cares about headfakes: the market is back in its mania phase when good news are doubly accentuated, and bad news are immediately ignored." Tyler Durden, Zero Hedge

Unending Follow-Through

But No Follow-Through

ADP Shows Moderate Growth, Beats Forecast; Stocks Leap

 "Employment in the U.S. nonfarm private business sector rose 157,000 from May to June on a seasonally adjusted basis, according to the latest ADP National Employment Report released today. The estimated advance in employment from April to May was revised down, but only slightly, to 36,000 from the initially reported 38,000. Today’s ADP National Employment Report estimates employment in the service-providing sector rose by 130,000 in June, nearly three times faster than in May, marking 18 consecutive months of employment gains. Employment in the goods-producing sector rose 27,000 in June, more than reversing the decline of 10,000 in May. Manufacturing employment rose 24,000 in June, which has seen growth in seven of the past eight months."

Wednesday, July 6, 2011

What SIgns to Look For Foreshadowing a U.S. Credit Event

Since a U.S. dollar collapse is ranked as the greatest risk to the world, and dollar's fate is largely dependent on if the bond market has faith in Uncle Sam, it might be helpful to add five additional warning signs that the bond market is freaking out (see chart):

  • Prices of bonds maturing start falling (i.e., investors start to demand higher interest rates to hold U.S. government debt).
  • A narrower spread between rates on Treasury bills and other short-term credit or near substitutes, e.g. LIBOR - This would be a sign of waning faith in the U.S. government.
  • A narrower spread between Treasuries and near substitutes - A sign of falling creditworthiness of Uncle Sam.
  • Price spikes in U.S. CDS (credit default swaps, insuring against a U.S. debt default) - According to Markit, the most noticeable movement has occurred in 1-year spreads, which have converged closer to 5-year spreads, and is up about 430% since early April, while 5-year CDS also has risen about 46%.
  • Higher volatility in the U.S. bond market - Another sign of lost confidence from bond investors.

(Click to enlarge) Chart Source: The Washington Post
So far, out of the 20 signs, there's one that's sending up a red signal flare - U.S. sovereign debt CDS, which is directly linked to the dollar (see chart above).
The U.S. does not have control over many of the indicators listed here, but at least the No. 1 risk factor -- the U.S. dollar -- is influenced by the national debt and by the monetary and fiscal policies set by the U.S. government and the Federal Reserve.
The longer the debt ceiling debate lingers, the more likely the bond market would start reacting and demanding higher interest rates. A sovereign credit downgrade as a result of missing the debt ceiling deadline would just translate into billions more in interest payments, piling on to the existing debt.
The United States is not like Iceland or Argentina, resorting to default as retorted by some could mean calamity not only to its citizens, but also to the rest of the world. Unless the government and this Congress get their act together, there will be no bailout, and instead of one lost generation to the Great Recession, there could be multi-generation missed in the next Grand Depression.
EconMatters.com

Still-Stalled Stocks -- Flat Today

That's three days this week that stocks have been flat. Now that is "stalled"!

Services ISM: Not Positve!

Bad, but not dreadful! But it gets worse the deeper we look!

from Zero Hedge:

June's Services ISM just printed at 53.3, down from 54.6 in May, and missing expectations of 53.7. As a reminder for the US, which is a 70% service economy, this number is far more indicative of the true direction of the economy. Among the components, there was a decline in the New Orders, Prices, Backlogs, Imports and, huh, Inventories? Yes, the same inventories that accounted for 66% of the Manufacturing ISM surge are dropping here. Of the 17 non-manufacturing industries reporting all reported growth, except for the all too critical Financial & Insurance and the completely irrelevant Health Care & Social Assistance. Oh yes, all commodities except for diesel and gasoline were reported up in price. And now that WTI is almost back to $100, that's about to end shortly. Some deflation. And now, talk of a triple dip recession may resume.

Stocks Stall

Gold Explodes Another $18

That's $45 in two days! The latest Greece bailout has fallen to pieces, and stocks are now stalling out, so gold is the safe place to be again.

Tuesday, July 5, 2011

Fed Keeps the Bailout Bucket Bailing

from MyBudget360:


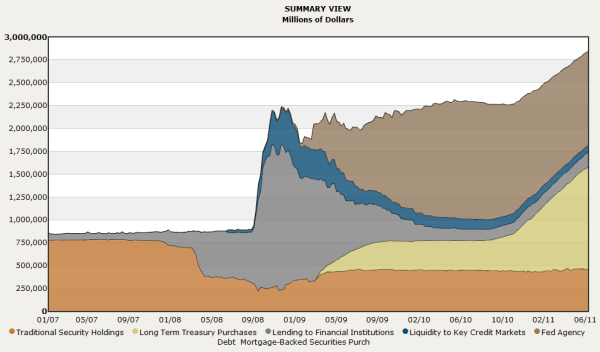
The Federal Reserve is primarily concerned with one thing and that is to protect the interests of the banking industry.  The Fed has no desire or need to protect the underlying economy.  If they can get away with allowing banks to jump from one bubble to another they will do so.  The success of the overall economy is only consequential if it aligns with the deeper interests of the banking cabal.  This weekend former Fed Chair Alan Greenspan mentioned that simply bailing out Greece was a temporary measure.  When pressed he went back into “Greenspeak” and rambled on in his typical obtuse language.  The reason why global banks fear Greece is not because of the country itself, but because the country has billions of dollars in debt that global banks hold.  These banks do not want to pay for their bad bets and would rather shift the cost to the overall population in general.  The Fed balance sheet here in the U.S. is now up to $2.84 trillion, another record that gets no airtime in the press.  The Federal Reserve continues with clandestine bailouts only to protect the interests of the banking elite.

Fed balance sheet reaches $2.84 trillion
federal reserve balance sheet
The Federal Reserve balance sheet is now up to $2.84 trillion.  The Fed has become the silo for shadow bailouts including bailouts for the commercial real estate industry, toxic residential loans, mortgage backed securities, and even loans that have no business being on its books.  Yet all this is seen as providing more liquidity for the banking system in the country.  Since the crisis started four years ago little benefit has been seen in the underlying economy.  Keep in mind the fiscal stimulus which is a fraction of what the Fed now holds on its balance sheet is what many Americans see on infrastructure projects.  The total amount spent since August of 2008 approximates $550 billion (roughly 3 percent of GDP).  On the other hand the Federal Reserve balance sheet specifically targeted to the banks now is up to 20 percent of GDP.
Of course little is discussed in the press about the Fed balance sheet.  The Federal Reserve has specially focused on bailing out the banking sector and this has worked well.  The too big to fail banks are now larger and profits are back to record levels.  Their biggest success was ripping off the public and more specifically have kept most of their hidden secrets buried deep in the belly of the un-audited Federal Reserve balance sheet.  We know that the Fed is holding $2.84 trillion in various “assets” but what exactly is being held?  They would like the public to believe that only pristine assets are being held in exchange for U.S. Treasuries but in reality the Fed is purchasing every questionable asset under the sun.  The Fed is ignoring the needs of the economy and simply focusing on protecting the interests of the banking elite.
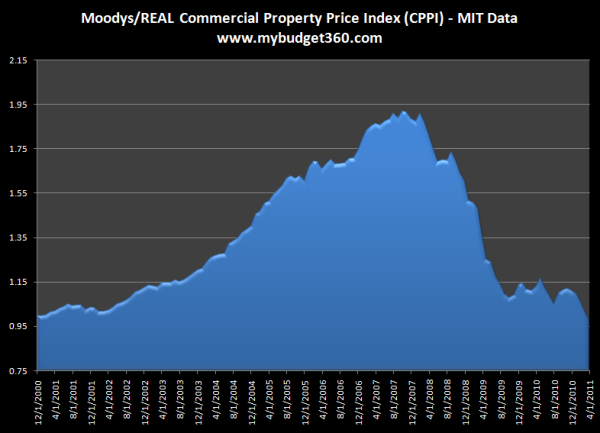
Case and point with commercial real estate
commercial real estate 2011
Source:  MIT
Commercial real estate values have plummeted by 50 percent since their peak.  The crash has been monumental and devastating for the industry.  Yet banks have shifted many of these bad loans fixed to CRE and have “temporarily” placed them at the Federal Reserve.  This isn’t a tiny industry.  The CRE sector at its peak reached a nominal value of $6.5 trillion.  Today the value has fallen closer to $3 trillion.  Many of the CRE properties are solidly underwater yet the Fed has given the banks time to figure out ways to stuff their bad loans into the belly of the Fed balance sheet.
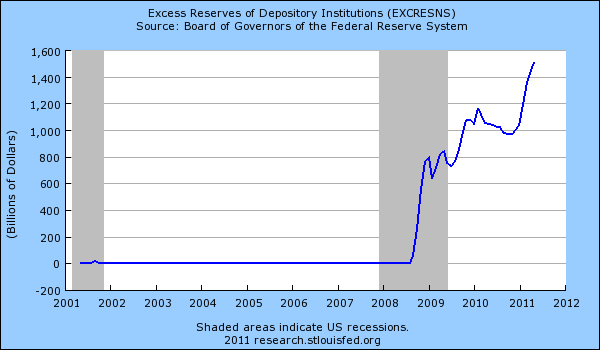
The banking system has plenty of money to lend out to the public:
excess reserves
The above chart shows how much money banks currently have that is readily available to lend to the public.  Yet these too big to fail banks would rather keep the funds at the Fed and earn 0.25 percent on the money while they decide what other bubble they will jump into next.  The too big to fail banks have nearly $1.6 trillion in excess money to lend to the American public!  This is money that back in 2007 they claimed they needed to help small businesses and keep credit going.  All of that was a lie and what really was the main purpose of the bailouts was to save the banking industry on the backs of taxpayers.  As the chart clearly shows, the banking system is simply looking for their next big profit machine and all that excess reserves has come from the Fed being friendly with their banking cronies.
Squeezing the working and middle class
The line out of Wall Street banks has now shifted from:

-(2007)  We need money from the Fed to keep money going to American families and small businesses.
And the new line now follows:
-(2011)  We need to cut spending and wages to keep competitive in the global marketplace.
What happened to lending to American families and small businesses, the actual reason for the bailouts?  These financial liars of course will say anything to steal more taxpayer money.  Now it is a narrative of more stealing.  These bankers of course don’t follow that line of cutting their own wages but then again, what do expect from the new oligarchy sponsored by the Fed?
The stats show something very different:
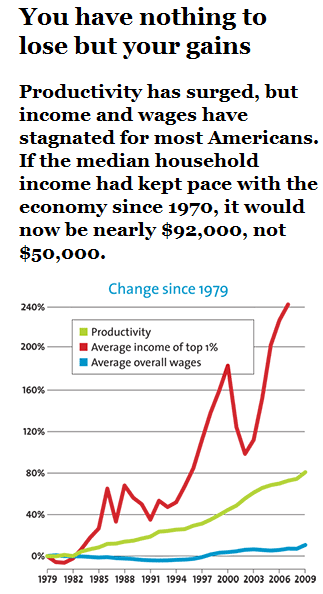
gains in wages
Source:  Mother Jones
I’m glad the middle class battle is now being picked up by more places.  If median household incomes had kept pace with the productivity of the economy the median household should now be earning $92,000 a year instead of $50,000.  As the chart above clearly shows, the vast majority of productivity gains have gone to the top 1 percent who have seen average income soar by over 240% since 1979 while average overall wages for working and middle class families have gone up roughly 10 percent in real terms.
The Fed and its banking cabal would like you to believe that now, everyone needs to live on wages slightly above minimum wage while the pinstriped suit bankers continually squeeze out more and more profits through bailouts, rip offs, financial alchemy, or simply by robbing taxpayers.  This is the new business model.  The Federal Reserve has failed its mission in many facets because when push comes to shove it is willing to sacrifice the economy for the sake of the elite banking sector.  Banks should become like a utility and strictly regulated with force.  Commercial and investment banking should be completely split.  Hedge funds should receive no special privileges especially when many make money by creating investments that sink the economy and also receive bailouts thanks to political connections.  You wonder why unemployment is still too high and wages continue to fall?  Look no further than the beast that is the Federal Reserve.

And Gold Finds It's Mettle Again

Gold was up $30/oz. today!

The Courtly Cost of Crude


The IEA must be fuming. While our strategic reserve is smaller by 30 million barrels, the price is $8 higher than it was when the sale was announced.

Market Turns Choppy, Indecisive

Stocks haven't successfully pressed their case for going lower. The market is very choppy, making trade very difficult. Today's bad news wasn't bad enough to turn the tide. This is likely to empower a more bullish sentiment, especially following last week's overwhelming bull run.

Universal Disapointment

Durable goods ex-transportation and factory orders data both disappointed the market this morning. Stocks, after a brief spike on the durable goods including transportation, have since sunk to near the lows of the day.

Bad Debt Everywhere -- Even in China


This, too, will be ignored on Wall Street.

Monday, July 4, 2011

Greece -- An Intractable Problem

Zero Hedge reported this morning that Greece is already in default on its June payment! Will these people never learn? Apparently not! The ink isn't even try on this bailout, and its already in trouble!

from FT.com:

When Greece passed a €28bn austerity package last week, it appeared that months of infighting had come to an end: Athens would get its next aid payment, avoiding sovereign default, and the European Union would sign off on a second, €120bn bail-out to keep Greece solvent through 2014.
But only one of those things is now assured: the €12bn July aid payment is expected to be finalised by the International Monetary Fund on Friday. The second Greek rescue is now being held up by what one senior European official called “an impossible knot” – getting private holders of Greek bonds to help pay for the bail-out, but without the financial markets judging the plan to be a default on Greece’s debt commitments.

When the Obama administration releases a report on the Friday before a long weekend, it’s clearly not trying to draw attention to the report’s contents. Sure enough, the “Seventh Quarterly Report” on the economic impact of the “stimulus,” released on Friday, July 1, provides further evidence that President Obama’s economic “stimulus” did very little, if anything, to stimulate the economy, and a whole lot to stimulate the debt.

The report was written by the White House’s Council of Economic Advisors, a group of three economists who were all handpicked by Obama, and it chronicles the alleged success of the “stimulus” in adding or saving jobs. The council reports that, using “mainstream estimates of economic multipliers for the effects of fiscal stimulus” (which it describes as a “natural way to estimate the effects of” the legislation), the “stimulus” has added or saved just under 2.4 million jobs — whether private or public — at a cost (to date) of $666 billion. That’s a cost to taxpayers of $278,000 per job.   
In other words, the government could simply have cut a $100,000 check to everyone whose employment was allegedly made possible by the “stimulus,” and taxpayers would have come out $427 billion ahead. 
Furthermore, the council reports that, as of two quarters ago, the “stimulus” had added or saved just under 2.7 million jobs — or 288,000 more than it has now.  In other words, over the past six months, the economy would have added or saved more jobs without the “stimulus” than it has with it. In comparison to how things would otherwise have been, the “stimulus” has been working in reverse over the past six months, causing the economy to shed jobs.
Again, this is the verdict of Obama’s own Council of Economic Advisors, which is about as much of a home-field ruling as anyone could ever ask for. In truth, it’s quite possible that by borrowing an amount greater than the regular defense budget or the annual cost of Medicare, and then spending it mostly on Democratic constituencies rather than in a manner genuinely designed to stimulate the economy, Obama’s “stimulus” has actually undermined the economy’s recovery — while leaving us (thus far) $666 billion deeper in debt. 
The actual employment numbers from the administration’s own Bureau of Labor Statistics show that the unemployment rate was 7.3 percent when the “stimulus” was being debated. It has since risen to 9.1 percent. Meanwhile, the national debt at the end of 2008, when Obama was poised to take office, was $9.986 trillion (see Table S-9). It’s now $14.467 trillion — and counting.
All sides agree on these incriminating numbers — and now they also appear to agree on this important point: The economy would now be generating job growth at a faster rate if the Democrats hadn’t passed the “stimulus.”

S&P Says Greek Bailout Amounts to Default