

Tuesday, September 12, 2017
Friday, September 8, 2017

Tuesday, September 5, 2017
Bullish Bonds Spell Worry


Thursday, August 31, 2017
End-Of-Month Rally for Corn

Wednesday, August 30, 2017
Cliff-Diving Corn
I'm amazed this morning that even with the plunging price of corn over the past two months, the price of corn is down sharply today also. Here is today's chart:


Thursday, August 17, 2017
Morose Economic Data Sends Stocks Tumbling
The Dow was down 251 points with just minutes left in the trading session today.

Monday, August 14, 2017
Sniff, Sniff! Smells Like a Bubble to Me!
This headline from Marketwatch today sure smells like a classic bubble!

Thursday, August 10, 2017
War Drums? Imagine The Real Thing!
If you think today's stock market plunge was bad, imagine what would happen if war actually happened! We wiped out about a month's worth of gains today!

Thursday, August 3, 2017
Sure Looks Like a BUbble
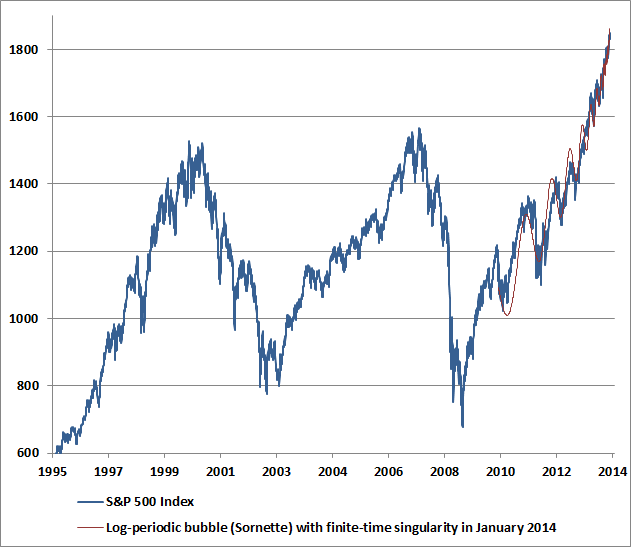
In the image, the red line is the calculation of a log-period bubble base on the formulas of Dr. Didier Sornette. This bubble matches his calculations perfectly. It is a flawless example of a financial bubble.
Friday, June 23, 2017
Corn Prices Crushed
Corn prices today dropped below support to multi-month lows. These are the lowest prices of this year!


Friday, June 16, 2017

Friday, June 9, 2017

Tuesday, June 6, 2017

Monday, May 15, 2017
Economic Data Stalls As S&P Continues Near Record Highs
How long can this continue? There seems to be a dismissiveness on Wall St of the economic data, even as the S&P 500 continues near a new record high this morning. Even the Fed's own data is showing weakness! This divergence will eventually close, and when it does, history suggests that it will be UG-LY!


Tuesday, October 11, 2016
Ominous Sign Stocks Have Peaked
Margin debt suggests that the stock market has topped out. It is a reliable leading indicator that points at a subsequent decline on a consistent basis.
Mark Hulbert on Marketwatch said this morning that "...margin debt typically peaks in advance of the stock market itself. In
2007, for example, margin debt peaked in July, three months before the
bull market topping out in October. As Wolf Richter of the Wolf Street
investment blog bluntly put it: Margin debt “has a bone-chilling habit
of peaking right around the time stocks crash.”
A word to the wise is sufficient!
Tuesday, September 6, 2016
Ouch! Fed's Own Labor Market Indicator Declines 7 of 8 Months!
Nevertheless, stocks are higher today1 What a bubble!


Wednesday, August 24, 2016
Central Bankers Make Bubbles Much Worse
"...Recessions are a normal condition to a market
economy as they are regulating any excess, bankrupting the weakest
players or those with the highest leverage. However, one of the
mandates of central banking is to fight a process
(business cycles) that occurs "naturally". The interference of
central banks such as the Federal Reserve appear to be exaggerating
the amplitude of bubbles and the manias that fuel them. It could be
argued that business cycles are being replaced by phases of booms
and busts, which are still displaying a cyclic behavior, but subject
to much more volatility. Although manias and bubbles have taken
place
many times before in history under very specific circumstances
(Tulip Mania, South Sea Company, Mississippi Company, etc.), central
banks appear to make matters worst by providing too much credit and
being unable or unwilling to stop the process with things are
getting out of control (massive borrowing). Instead of economic stability regulated by
market forces, monetary intervention creates long term instability
for the sake of short term stability."
--Professor Dr. Jean-Paul Rodrigue, Hofstra University
Monday, August 15, 2016
When Is a Bubble Not a Bubble?

Stock Valuations At Bubble Levels
The outcome of years of yield-seeking speculation induced by central banks is that investors across the globe have now locked in zero prospective total returns in virtually in every asset class for the coming decade... We actually view this period as the extended top-formation of the third speculative bubble in the past 16 years, not as a representative sample of things to come. -- Dr. John Hussman, PhD, August 15, 2016
Subscribe to:
Posts (Atom)



