Saturday, March 1, 2008

How Much Will the Dollar Buy at Current Inflation Rates?


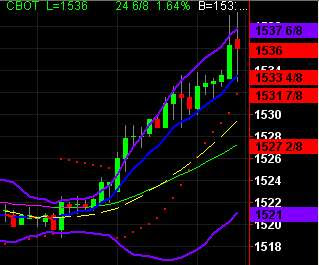
Here is an interesting article that calculates how much less the US Dollar will buy at current rates of inflation based upon the CPI and PPI. Read it and weap! The above chart is a glimpse. Read the article for the details:

Inflation's Power: The Dollar in 25 Years!

Friday, February 29, 2008

Soybeans Continue UP, Wheat Continues DOWN


The three grains have taken divergent paths into the close of the day session and week. Corn was relatively unchanged for the day. Soybean prices have once again closed higher and reached new all-time high prices. One factor that appears to continue to support strong soybean (and corn) prices is that soybeans are used for food for both humans and livestock, as well as continued talk of using soybeans as a fuel source to replace crude oil. Wheat has continued to sell off. The upper chart is soybeans, and the lower one is wheat.

Soybeans Move Off Center

Note the heavy buying interest in the Klinger Volume indicator just as prices took off!

Wheat Begins to Recover

Wheat prices are now beginning to show signs of a bottom and recover. The 15-minute chart at left is still bearish, but the shorter-term 3-minute (middle) and tick charts (right) are showing emerging bullishness.

Soybeans Goes Flat Following Price Rise


Soybeans prices are up strongly today, but have since gone flat. I am awaiting the next break-out.

Biofuel Grains UP, Wheat DOWN

Corn and soybean prices are strongly up overnight, whereas wheat has continued its sell-off that has occurred over the past few days. This soybean 30-minute chart tells the story of continued bullish strength in grains, or at least the biofuel ones, corn and soybeans. Soybeans and corn have hit new all-time high prices overnight.
On the other hand, this 30-minute chart for wheat also shows the continued selling of wheat futures over the past few days.

New Grain/Biofuel ETN

A new ETN that capitalizes on the world's grains that are being used as biofuels is the Elements Biofuels ETN. It includes only the agricultural commodities related to biofuels. Of course, much of the price strength in grains and other agricultural commodities is due to their being used as a form of fuel. The Elements Biofuels ETN (ticker: FUE) is currently composed of futures contracts for various agricultural commodities; this current composition is about 45% soybeans/soybean oil, 24.51% sugar, and 21.13% corn. Other biofuel grains make up the balance.

Thursday, February 28, 2008

Bernanke's Blunder?

Following Fed Chairman Bernanke's testimony before Congress today, here is the score. Perhaps those Congressmen should have asked Mr. Bernanke this:

Can you spell, "inflation"?
Scores:
All these charts are from today, February 28, 2008!
(There are many more currencies and commodities, but these are the ones I follow.)

Bernanke: zero


U.S. Dollar: DOWN

Foreign Currencies: 5 US Dollar: 0

Euro: UP


Yen: UP

Canadian Dollar: UP

Australian Dollar: UP

Great British Pound: UP


Commodity Inflation: 10

Commodity Index: UP

Crude Oil: UP

Gold: UP

Silver: UP

Corn: UP

Coffee: UP

Soybeans: UP

Cocoa: UP

Cotton: UP

Sugar: UP

Soybeans and Corn: WOW!


There is no stopping this bull trend. Both corn and soybeans have reached new all-time highs, and new all-time closing highs. This soybean chart says it all!

Wheat: 75 Cent Sell-Off


Wheat has sold off today, but also erratically, just as with soybeans and corn, which are both higher today. Difficult, but highly profitable trading in all the grains today.

Good As Gold


The prices of gold and crude oil have also reached new highs today. Crude oil prices were somewhat bearish yesterday following the EIA report that crude oil stocks in the United States rose more than expected, but new turmoil in Nigeria has put additional oil supplies at risk, driving price higher.

This chart shows gold today, but the crude oil chart is very similar.

First Time: $15 Soybeans


Soybeans have reached a new record high well over $15.00 per bushel in what has been a labored trading session. It wasn't as easy getting here as it looks in this chart. Trading has been difficult, but profitable.

Soybeans Regains Volatility Ceded to Wheat


For the past few days, wheat had become the most actively-traded of the grains. The overnight volume for wheat two nights ago was 60,000 contracts. However, soybeans are once again the most volatile grain product, having taken the lead back today from wheat. Wheat is still very active, but has once again fallen behind soybeans for the time being.

Strength of Agricultural Commodities

Here is a good argument for the strength of agricultural commodities, even in a week economy, by Bud Conrad, a fellow futures trader:

Bud Conrad on Market Crisis and Opportunity

Wednesday, February 27, 2008

Money Flooding Commodities Markets

Here is another excellent article from Gary Dorsch. As usual, it is very well researched.

Too Much Money Chasing Too Few Commodities

Dizzying Wheat

I stopped posting today because the volatility in wheat was so dizzying, it was hard to keep up with it all. This was the most profitable day of my trading career. Volatility equals profits for traders.

Klinger + ATR indicator Leads


On a day like today, where volatility is high, the value of the Klinger Volume indicator is obvious. Note that at the locations where I have placed the arrows, the Klinger+ATR Volume indicator tends to anticipate an imminent change in direction of the market.

When the market changes direction so rapidly, accurate execution of trades can become difficult, and a trader must remain extremely alert at all times. Many of these trades last less than 2 minutes each.

On occasions that the Klinger indicator suggests a change of direction, but price action consolidates rather than reverses, the likelihood increases that when prices reverse again in the direction of the previous trend, that trend force will be amplified. Additionally, if prices do not reverse powerfully in the direction of the original trend, the probability of a new trend or consolidation increases. In truth, one never knows precisely what is going to happen. There is no perfect indicator except prophecy!

Wheat Back Down!

Wheat Back Up!

Roller Coaster Wheat


And now, prices collapse by $1.10 from its high minutes ago, once again.

Wheat - From Lock Limit Down to Lock Limit UP in Just Hours!


After reaching lock limit down at 7:00 EST, wheat has now exploded higher to reach lock limit up again, a price gain within a few hours of $1.70. Unbelievable!

Gleaming, Glistening Gold


Gold has responded to the falling US Dollar by moving to fresh all-time high prices.

Wheat Rebounds 40 Cents in 5 Minutes!


Volatility for grain prices, and particularly wheat, has gushed higher with anticipated force at the open of the grains market this morning. When volatility is high, traders can make excellent profits by acting quickly and executing trades with precision.

US Dollar Continues to Move Even Lower Today


As shown on this 15-minute chart, the Dollar has continued to lose value again today.

Wheat Prices Plunge to Lock Limit DOWN!


Wheat prices plunged overnight to lock limit down, after going lock limit UP 90 cents yesterday, and increasing 70 cents last night. Prices on wheat dropped more than $2.00 in overnight trading, after rising 70 cents in the first few minutes! I've never seen anything like this before in the futures markets!

Historical Precedent Just Two Weeks Ago?

This is very likely a short-term event, and may be a great buying opportunity, if history repeats itself. When the CME increased its lock limits from 30 cents to 60 cents 2 weeks ago, prices plunged because the increase in margins forced brokers to liquidate the long positions of many traders that no longer had account margins that were sufficiently large to cover their positions. This may have occurred again last night, since the CME increased the lock limit from 90 cents (just 30 cents 2 weeks ago) over the weekend to $1.35 -- more than doubling it in just two days! More forced selling has almost certainly occurred. I suspect prices may likely rebound within the next few days -- perhaps even today!

Inflation May Be Worse Than We Think

I strongly recommend this editorial, published today in the Wall Street Journal, and written by David Ranson.

Inflation May Be Worse Than We Think

Perhaps many people have also noticed that the U.S. Dollar has fallen to new all-time lows yesterday and overnight, and inflation continues to surge even higher. Yesterday, wholesale inflation reached 26-year highs, but this occurred before the recent explosion of commodity prices to new records almost across the board. Inflation measures in future months are certain to rise not only higher, but considerably so. If anything, the plunging Dollar and surging commodities have baked higher inflation into the cake.

Isn't it time, perhaps, for the Bernanke Fed to stop worrying about saving Wall Street bankers, and think more about saving Main Street? Where is Volcker when we need him?

Tuesday, February 26, 2008

CME Expands Wheat Lock Limit Yet Again

When wheat begins trading this evening, the CME has once again increased the maximum trading range of wheat. This time, wheat can trade up to $1.35 in one day! That's more than four times the amount wheat was permitted to trade just over 2 weeks ago! Today's settlement was $12.14 4/8, and the new lock limit this evening will be $13.49 4/8. Astounding!

New All-Time Record Low for US Dollar Index


Following my previous posting, the U.S. Dollar plunged to a new all-time record low and a new record low closing. This old record had held since last November, and the Dollar had been holding within a trading range since then. Today, it broke out to the down side. This is an ominously frightening sign of possibly even higher and accelerating inflation to come. I expect that not only will the USD continue to fall farther; commodities will, in turn, move higher still.

USD: Over the Cliff?

On the other hand, one explanation for stratospheric commodity prices may that the USD is beginning to plunge again. If you could see over the edge of the cliff, you might be able to see the USD down there somewhere, as it cascades into the global gorge. This seems reminiscent of the Road Runner cartoons that I watched as a boy, when Wile E. Coyote would chase the road runner over a cliff, and we would watch the coyote plunge to the canyon below, with a small puff of dust as he hit bottom. This time, however, it will be no small puff of dust. It will be more like an atomic mushroom cloud!

The USD index is only 20 ticks away from its all-time low, and the EURUSD cross is only a few cents from its all-time high.

USD Index Daily chart
USD Index Intra-Day charts for 2-26-2008

Commodities Higher Across the Board

Commodity prices have moved higher again today almost across the board. Note here the daily chart for the Goldman Sachs Commodity Index, showing a very long green candle for today, indicating that commodities have moved yet substantially higher. Nearly any commodity or commodity index an investor could select would be higher today. Crude oil, natural gas, precious metals, wheat, soybeans, corn, sugar, cotton, cocoa, and several others have all reached new highs today. Is it any wonder that last green candle is so tall today? This market is beginning to feel overbought and possibly in bubble territory to me. I am going to begin looking for a harsh retracement before the commodity bull continues.

GSCI futures
Grains
Sugar
Cotton
Cocoa

Meanwhile, Wheat Has Locked Limit Again


At the same time that the other grains have surged to new highs, wheat has once again reached its daily upper lock limit, which is also a new record high price and will likely be a new record closing high.

Soybean Bulls: Resistance Is Futile!


The soybean bulls have blown out all resistance, moving to fresh record high price today at $14.93 6/8 per bushel, and escalating prices once again well past yesterday's closing record high. The grains bull charges onward! Soybean prices have now closed higher 17 of the last 23 days!

Break-out Followed by More Resistance


Soybeans prices broke through the resistance level of yesterday's settlement price, and following a good trade, are now meeting more resistance at today's former high (see the high in the left chart). This may not last long, either, as the bulls have firmly regained the upper hand.

Resistance at Yesterday's Settlement Price


Note in this chart of soybeans today that prices are struggling to main the settlement price from yesterday, denoted here by the dotted red line.

Each day, there are usually 2-3 very good trades that make most of the money. They most frequently occur near the beginning of the trading session during the day. 95% of all trading volume occurs during the day session between 10:30 am and 2:15 pm EST. However, these small trades add up also. I often will make more money on short, small trades like those depicted here than on the 2-3 large trades.

How do I know which trades will be the big ones, and which ones will be worth only a few ticks? I don't! I have to be in it, to win it! Thus, I keep reminding myself that I must keep my head in the game at all times! Being resolute in taking trades is a necessity in this business. Today and yesterday are good examples of staying with the trading to come out ahead and achieve my objectives. Grit, guts, constancy, and dauntless tenacity are a necessary character trait that are required and developed in this business.