Friday, June 26, 2009

How International Markets Can Help Time Trading U.S. Markets

Below is a video by Peter Navarro which explains how he uses a select group of international exchange traded funds to better help him time trades in the domestic market, in particular, the S&P 500 (SPY). The three international indexes he follows include the FXI (following 25 large and liquid Chinese companies, sometimes called the Dow of China - betting that as China goes, so goes Asia), the IEV (following the S&P Europe 350 Index), and the ILF (following the S&P Latin America 40 Index).http://link.brightcove.com/services/player/bcpid1079049304?bctid=27461401001


While I have not back-tested these specific indexes for providing leading signals, the video does remind us of the benefits of looking at other data for helping one to spot trends and even forecast movements in domestic indexes. A number of years ago I was engaged in some research that was looking to see if the S&P 500 could be used to help predict trends in various international indexes. After all, the feeling was that as the U.S. goes, so goes the rest of the world - or so we assumed. As our research progressed, and we began doing correlation studies, principle component analysis, information-based data mining, and everything else we could throw at the problem, it became clear that in many instances we had it backwards. The international indexes were more predictive in helping forecast the U.S. market. While some of these correlations broke down over time, it nonetheless helped send the message that we could not assume that the U.S. markets were always driving the world markets, or that the influence was always consistent, in either size or direction. While this is more clear today, and less of a surprise, it still seems as though few traders and investors use such information. The three international ETFs mentioned above are a good place to start your own studies.

Bloomberg: Cap and Trade Will Increase Oil Imports, Reduce Domestic Production

from Bloomberg:
America’s biggest oil companies will probably cope with U.S. carbon legislation by closing fuel plants, cutting capital spending and increasing imports.

Under the Waxman-Markey climate bill that may be voted on today by the U.S. House, refiners would have to buy allowances for carbon dioxide spewed from their plants and from vehicles when motorists burn their fuel. Imports would need permits only for the latter, which ConocoPhillips Chief Executive Officer Jim Mulva said would create a competitive imbalance.

“It will lead to the opportunity for foreign sources to bring in transportation fuels at a lower cost, which will have an adverse impact to our industry, potential shutdown of refineries and investment and, ultimately, employment,” Mulva said in a June 16 interview in Detroit. Houston-based ConocoPhillips has the second-largest U.S. refining capacity.

The same amount of gasoline that would have $1 in carbon costs imposed if it were domestic would have 10 cents less added if it were imported, according to energy consulting firm Wood Mackenzie in Houston. Contrary to President Barack Obama’s goal of reducing dependence on overseas energy suppliers, the bill would incent U.S. refiners to import more fuel, said Clayton Mahaffey, an analyst at RedChip Cos. in Maitland, Florida.

“They’ll be searching the globe for refined products that don’t carry the same level of carbon costs,” said Mahaffey, a former Exxon Corp. refinery manager.

Prices Seen Rising

The equivalent of one in six U.S. refineries probably would close by 2020 as the cost of carbon allowances erases profits, according to the American Petroleum Institute, a Washington trade group known as API. Carbon permits would add 77 cents a gallon to the price of gasoline, said Russell Jones, the API’s senior economic adviser.

“Because it’s going to be more expensive to produce the stuff, refiners will slow down production and cut back on inventories to squeeze every penny of profit they can from the system,” said Geoffrey Styles, founder of GSW Strategy Group LLC in Vienna, Virginia. “We will end up with less domestic product on the market and a greater reliance on imports, all of which means higher, more volatile prices.”

U.S. motorists, already facing the steepest jump in gasoline prices in 18 years, would bear the brunt as refiners pass on added costs, Exxon Mobil Corp. Chief Executive Officer Rex Tillerson told reporters after a May 27 meeting in Dallas.

CBO Says Budget Shortfalls Are Going From Bad to Worse

from the Washington Post:

The nation's long-term budget outlook has darkened considerably over the past six months, and President Obama's plan to extend an array of tax cuts and other policies adopted during the Bush administration has the potential to "create an explosive fiscal situation," congressional budget analysts reported yesterday.

In a new report, the Congressional Budget Office found that extending the Bush administration tax cuts, reining in the alternative minimum tax and canceling a scheduled reduction in payments to Medicare doctors would dramatically slash tax collections at a time when federal spending would be "sharply rising."

States Running Out Of Funds to Pay Unemployment

from CNBC:
The government checks keeping Candy Czernicki afloat are fast running out. The reason? U.S. states obligated to pay benefits to the swelling ranks of jobless Americans are piling debt onto strained budgets.

CNBC.com

Fifteen states have depleted their unemployment insurance funds so far, forcing them to borrow from the U.S. Treasury.

A record 30 of the country's 50 states are expected to have to borrow up to $17 billion by next year, said Rick McHugh of the National Employment Law Project, a nonpartisan advocacy group.

"We are setting the stage for big pressures for states to restrict eligibility and benefit levels," McHugh said. "Those type of restrictive actions undercut the (Depression-era program's) economic and social stability purposes."

The state-run unemployment insurance programs are normally financed with payroll taxes paid by employers on each worker. But the funds' tax revenues are falling at the same time as benefit demands are rising.

Nine million Americans are receiving jobless benefits, triple the number who got checks at the beginning of the year. Experts predict the number of recipients will peak sometime this summer as long-term unemployed run out of benefits, which were recently extended and last for 59 weeks in most cases.

States Running Out Of Funds to Pay Unemployment

from CNBC:
The government checks keeping Candy Czernicki afloat are fast running out. The reason? U.S. states obligated to pay benefits to the swelling ranks of jobless Americans are piling debt onto strained budgets.

Fifteen states have depleted their unemployment insurance funds so far, forcing them to borrow from the U.S. Treasury.

A record 30 of the country's 50 states are expected to have to borrow up to $17 billion by next year, said Rick McHugh of the National Employment Law Project, a nonpartisan advocacy group.

"We are setting the stage for big pressures for states to restrict eligibility and benefit levels," McHugh said. "Those type of restrictive actions undercut the (Depression-era program's) economic and social stability purposes."

The state-run unemployment insurance programs are normally financed with payroll taxes paid by employers on each worker. But the funds' tax revenues are falling at the same time as benefit demands are rising.

Nine million Americans are receiving jobless benefits, triple the number who got checks at the beginning of the year. Experts predict the number of recipients will peak sometime this summer as long-term unemployed run out of benefits, which were recently extended and last for 59 weeks in most cases.

More on the Global Warming Sham

from WSJ:

Steve Fielding recently asked the Obama administration to reassure him on the science of man-made global warming. When the administration proved unhelpful, Mr. Fielding decided to vote against climate-change legislation.

If you haven't heard of this politician, it's because he's a member of the Australian Senate. As the U.S. House of Representatives prepares to pass a climate-change bill, the Australian Parliament is preparing to kill its own country's carbon-emissions scheme. Why? A growing number of Australian politicians, scientists and citizens once again doubt the science of human-caused global warming.


Among the many reasons President Barack Obama and the Democratic majority are so intent on quickly jamming a cap-and-trade system through Congress is because the global warming tide is again shifting. It turns out Al Gore and the United Nations (with an assist from the media), did a little too vociferous a job smearing anyone who disagreed with them as "deniers." The backlash has brought the scientific debate roaring back to life in Australia, Europe, Japan and even, if less reported, the U.S.

In April, the Polish Academy of Sciences published a document challenging man-made global warming. In the Czech Republic, where President Vaclav Klaus remains a leading skeptic, today only 11% of the population believes humans play a role. In France, President Nicolas Sarkozy wants to tap Claude Allegre to lead the country's new ministry of industry and innovation. Twenty years ago Mr. Allegre was among the first to trill about man-made global warming, but the geochemist has since recanted. New Zealand last year elected a new government, which immediately suspended the country's weeks-old cap-and-trade program.

The number of skeptics, far from shrinking, is swelling. Oklahoma Sen. Jim Inhofe now counts more than 700 scientists who disagree with the U.N. -- 13 times the number who authored the U.N.'s 2007 climate summary for policymakers. Joanne Simpson, the world's first woman to receive a Ph.D. in meteorology, expressed relief upon her retirement last year that she was finally free to speak "frankly" of her nonbelief. Dr. Kiminori Itoh, a Japanese environmental physical chemist who contributed to a U.N. climate report, dubs man-made warming "the worst scientific scandal in history." Norway's Ivar Giaever, Nobel Prize winner for physics, decries it as the "new religion." A group of 54 noted physicists, led by Princeton's Will Happer, is demanding the American Physical Society revise its position that the science is settled. (Both Nature and Science magazines have refused to run the physicists' open letter.)

The collapse of the "consensus" has been driven by reality. The inconvenient truth is that the earth's temperatures have flat-lined since 2001, despite growing concentrations of C02. Peer-reviewed research has debunked doomsday scenarios about the polar ice caps, hurricanes, malaria, extinctions, rising oceans. A global financial crisis has politicians taking a harder look at the science that would require them to hamstring their economies to rein in carbon.

Credit for Australia's own era of renewed enlightenment goes to Dr. Ian Plimer, a well-known Australian geologist. Earlier this year he published "Heaven and Earth," a damning critique of the "evidence" underpinning man-made global warming. The book is already in its fifth printing. So compelling is it that Paul Sheehan, a noted Australian columnist -- and ardent global warming believer -- in April humbly pronounced it "an evidence-based attack on conformity and orthodoxy, including my own, and a reminder to respect informed dissent and beware of ideology subverting evidence." Australian polls have shown a sharp uptick in public skepticism; the press is back to questioning scientific dogma; blogs are having a field day.

The rise in skepticism also came as Prime Minister Kevin Rudd, elected like Mr. Obama on promises to combat global warming, was attempting his own emissions-reduction scheme. His administration was forced to delay the implementation of the program until at least 2011, just to get the legislation through Australia's House. The Senate was not so easily swayed.

Mr. Fielding, a crucial vote on the bill, was so alarmed by the renewed science debate that he made a fact-finding trip to the U.S., attending the Heartland Institute's annual conference for climate skeptics. He also visited with Joseph Aldy, Mr. Obama's special assistant on energy and the environment, where he challenged the Obama team to address his doubts. They apparently didn't.

This week Mr. Fielding issued a statement: He would not be voting for the bill. He would not risk job losses on "unconvincing green science." The bill is set to founder as the Australian parliament breaks for the winter.

Republicans in the U.S. have, in recent years, turned ever more to the cost arguments against climate legislation. That's made sense in light of the economic crisis. If Speaker Nancy Pelosi fails to push through her bill, it will be because rural and Blue Dog Democrats fret about the economic ramifications. Yet if the rest of the world is any indication, now might be the time for U.S. politicians to re-engage on the science. One thing for sure: They won't be alone.

Dollar Drops on China's Calls for New Global Reserve Currency

Controlling Speculators -- A Guarantee of Higher Prices

here is my reply today to someone calling for Congress to control commodity traders:

I guarantee that this will cause HIGHER fuel prices, NOT lower them! There are several reasons:

1) CFTC study last fall, following the commodity boom last year, found that speculators were NOT the cause of higher prices.
2) The study found that speculators were EVENLY split between long and short positions.
3) The study found that NON-exchange-traded commodities rose HIGHER and FASTER in price than exchange-traded ones! Speculators tend to STABILIZE prices, not drive them. Speculators are the first ones to see an overbought market and short that market. They FOLLOW trends; they don't create trends!
4) Speculative trades represented a smaller percentage of trades in 2008, during the commodity boom, than they did in 2006 when there was no commodity boom. Presence of speculators tends to DAMPEN and reduce price swings, NOT exacerbate them!
5) Speculative trades in any given commodity represented only 15-18% of the total. Since they were evenly split between longs and shorts, speculative longs were only about 8-9% of the total in any given commodity. There is no way a small minority of the trades could have controlled or driven the market.
6) There are other liquid futures exchanges around the world, including Shanghai, Dubai, Europe, Singapore, etc. If investor funds are unwelcome in the United States, these funds will go overseas to other futures markets. The capital flight will crush the Dollar, and this will lead commodity prices HIGHER! Lower Dollar = Higher commodity prices!
7) Smaller, less liquid markets. Remember when the Hunt Bros. cornered the world silver markets? The small silver market was easily manipulated, until prices rose so high that even housewives were selling their silver in pawn shops. The market grew until the Hunt Bros. could no longer manipulate the market and prices collapsed. A blue whale can throw its weight around MORE in a small pond than in the Pacific Ocean. Less liquidity and smaller markets EMPOWER large market participants, and make it EASIER for them to manipulate prices. The larger the pool of liquidity, the LESS any one player -- including speculators -- can influence prices. The worst thing we can do is shrink the size of the market. This would give Goldman Sachs MORE market influence, not less.
8) The oil and other commodities will flow to those places that are willing to pay market prices for them -- like China.They are signing long-term contracts for every barrel of oil they can find. If we try to manipulate prices here by controlling the market, that oil will go ELSEWHERE. Do you want to wait 5 hours in line to fill your gas tank -- and pay $7-$8 per gallon for the privilege? Just try to control prices by shutting speculative traders out of the market, and you'll have that privilege.
9) Speculators play a critical role in the futures markets -- one that the liberal news media ignores. They provide liquidity and constant price discovery to the market. Absence of these two -- LIQUIDITY and PRICE DISCOVERY -- were what caused the mortgage crisis because those derivatives couldn't be bought, sold, or priced. So now we want to impose those same conditions on the commodity markets? That would be a disaster!
10) The futures markets were developed to bring MORE money and speculative funds into the markets because until they existed, prices for all commodities were erratic with huge swings and price fluctuations. In the fall, farmers could only get pennies for their crops, but during the winter, grain prices were so high no one could afford to buy them. The futures markets brought speculators in and thereby reduced the peaks and valleys, making prices more stable throughout the year. Hence, the use of "contracts". This brings MORE price stability, not less.

Congress and overspending affect commodity prices more than speculators. They aren't the only factor, of course, but if you look at charts for the price of crude oil this year, it is an almost perfect inverse correlation with the Dollar. If you want to see cheaper oil, then lobby Congress for a stronger Dollar, not hobble the futures markets!

Thursday, June 25, 2009

Cap and Trade Smoke and Mirrors

This will, over the long term, devastate the U.S. economy. The intent is good, but the end never justifies the means.

from WSJ:

House Speaker Nancy Pelosi has put cap-and-trade legislation on a forced march through the House, and the bill may get a full vote as early as Friday. It looks as if the Democrats will have to destroy the discipline of economics to get it done.

Despite House Energy and Commerce Chairman Henry Waxman's many payoffs to Members, rural and Blue Dog Democrats remain wary of voting for a bill that will impose crushing costs on their home-district businesses and consumers. The leadership's solution to this problem is to simply claim the bill defies the laws of economics.

Their gambit got a boost this week, when the Congressional Budget Office did an analysis of what has come to be known as the Waxman-Markey bill. According to the CBO, the climate legislation would cost the average household only $175 a year by 2020. Edward Markey, Mr. Waxman's co-author, instantly set to crowing that the cost of upending the entire energy economy would be no more than a postage stamp a day for the average household. Amazing. A closer look at the CBO analysis finds that it contains so many caveats as to render it useless.

For starters, the CBO estimate is a one-year snapshot of taxes that will extend to infinity. Under a cap-and-trade system, government sets a cap on the total amount of carbon that can be emitted nationally; companies then buy or sell permits to emit CO2. The cap gets cranked down over time to reduce total carbon emissions.

To get support for his bill, Mr. Waxman was forced to water down the cap in early years to please rural Democrats, and then severely ratchet it up in later years to please liberal Democrats. The CBO's analysis looks solely at the year 2020, before most of the tough restrictions kick in. As the cap is tightened and companies are stripped of initial opportunities to "offset" their emissions, the price of permits will skyrocket beyond the CBO estimate of $28 per ton of carbon. The corporate costs of buying these expensive permits will be passed to consumers.

The biggest doozy in the CBO analysis was its extraordinary decision to look only at the day-to-day costs of operating a trading program, rather than the wider consequences energy restriction would have on the economy. The CBO acknowledges this in a footnote: "The resource cost does not indicate the potential decrease in gross domestic product (GDP) that could result from the cap."

The hit to GDP is the real threat in this bill. The whole point of cap and trade is to hike the price of electricity and gas so that Americans will use less. These higher prices will show up not just in electricity bills or at the gas station but in every manufactured good, from food to cars. Consumers will cut back on spending, which in turn will cut back on production, which results in fewer jobs created or higher unemployment. Some companies will instead move their operations overseas, with the same result.

When the Heritage Foundation did its analysis of Waxman-Markey, it broadly compared the economy with and without the carbon tax. Under this more comprehensive scenario, it found Waxman-Markey would cost the economy $161 billion in 2020, which is $1,870 for a family of four. As the bill's restrictions kick in, that number rises to $6,800 for a family of four by 2035.

Note also that the CBO analysis is an average for the country as a whole. It doesn't take into account the fact that certain regions and populations will be more severely hit than others -- manufacturing states more than service states; coal producing states more than states that rely on hydro or natural gas. Low-income Americans, who devote more of their disposable income to energy, have more to lose than high-income families.

Even as Democrats have promised that this cap-and-trade legislation won't pinch wallets, behind the scenes they've acknowledged the energy price tsunami that is coming. During the brief few days in which the bill was debated in the House Energy Committee, Republicans offered three amendments: one to suspend the program if gas hit $5 a gallon; one to suspend the program if electricity prices rose 10% over 2009; and one to suspend the program if unemployment rates hit 15%. Democrats defeated all of them.

The reality is that cost estimates for climate legislation are as unreliable as the models predicting climate change. What comes out of the computer is a function of what politicians type in. A better indicator might be what other countries are already experiencing. Britain's Taxpayer Alliance estimates the average family there is paying nearly $1,300 a year in green taxes for carbon-cutting programs in effect only a few years.

Americans should know that those Members who vote for this climate bill are voting for what is likely to be the biggest tax in American history. Even Democrats can't repeal that reality.

Foreign Demand for U.S. Debt May Be a Mirage

This is an interesting story from the Fund My Mutual Fund blog:

I found this little tidbit in the Wall Street Journal and it really shows (again) it is just business as usual, in all branches. One of the big stresses in the market has been the enormous glut of US debt coming (both new and rollover). In the past week alone the Treasury put on the market a staggering $104B of debt. Sit back and think about that for a moment... then annualize it ($104B x 52 weeks). Then sigh.

But I digress! Money is free in America as it grows on trees. Going back to the earlier point, the stress is eventually our foreign owners, err creditors will (a) demand much higher rates of return i.e. higher yields - to compensate for all the debt we are issuing and the long term risks it entails or (b) they will begin walking away. This is more an issue in the long term bonds (10 year or 30 year) rather than short term. Indeed China for example has been slowly moving their purchases away from the long term and into short term - much easier to walk away from when the day eventually comes. [May 21, 2009: NYT - Chinese Becoming More Picky About Debt]

Without getting technical, in the bond market there are direct and indirect purchases... indirect being foreign issuers. From the Federal Reserve's New York branch website

Purchases by indirect bidders, in particular, are a fairly good proxy for foreign purchases of Treasury notes, but not Treasury bills.


For those that don't know, "notes" are generally 2 years of duration or longer. "Bills" are the very short term things like 3 months, etc.

Long story short people will now obsess over the INDIRECT purchases of our longer term notes. This is expressed as a percentage; the higher the better in terms of "demand" from foreign central banks.

We've recently had some long term auctions that went reasonably well, and the indirect purchases allayed some fears. Cool right?

Err... fine print time. Follow as with all government reports - when the data begins to work against you, start to make adjustments. Banana Republic style... because folks, we can't handle the truth. We've done it for inflation, employment, GDP - we've lose entire reports like M3 (money supply)... its a pattern. As for this one? Another feather in the cap for Uncle Timmy G.
  • The sudden increase in demand by foreign buyers for Treasurys, hailed as proof that the world's central banks are still willing to help absorb the avalanche of supply, mightn't be all that it seems.
  • When the government sells bonds, traders typically look at a group of buyers called indirect bidders, which includes foreign central banks, to divine overseas demand for U.S. debt. That demand has been rising recently, giving comfort to investors that foreign buyers will continue to finance the U.S.'s budget deficit.
  • But in a little-noticed switch on June 1, the Treasury changed the way it accounts for indirect bids, putting more buyers under that umbrella and boosting the portion of recent Treasury sales that the market perceived were being bought by foreigners.
Boo Yah! If you don't like the results; change the parameters! We've been doing it for 25 years, why change now?
  • The new definitions are deep in the arcane world of Treasury auctions. The change involves buyers who place orders through primary dealers. Those had been counted as direct buyers, but as of June 1 they were classified as indirect buyers, making that group larger than before. Because investors view that group as being dominated by foreign buyers, they assumed foreign demand was higher.
  • Getting a better sense of investors' appetite, especially overseas, is imperative to the U.S. at this time when it needs to sell record amounts of debt in order to tackle surging budget deficits and fund massive stimulus programs to revive the economy.
So what does Treasury have to say for themselves?
  • Treasury officials didn't respond to requests for comment.
I assume CNBC was all over this yesterday? In between the cheerleading? Or will report it the next time we have a bond auction that went "swimmingly well as foreigners showed up in droves".

Surely.

And here from the WSJ:

The sudden increase in demand by foreign buyers for Treasurys, hailed as proof that the world's central banks are still willing to help absorb the avalanche of supply, mightn't be all that it seems.

When the government sells bonds, traders typically look at a group of buyers called indirect bidders, which includes foreign central banks, to divine overseas demand for U.S. debt.

Corn and Wheat Both Back Near Support Levels Near Lows of 2009

It's amazing to me that both grains would both be close to the lows of the year, given that the stock market is still relatively strong. Both are daily charts.

Corn - searching for support at around $4/bushelWheat - nearly at support from past Spring

It's Been a Long Time Since I've Seen This

Both stocks and treasuries are moving higher strongly at the same time! Very strange!

Stocks
Treasuries

Stocks Rebound Forcefully

Hey Warren! If There are "Green Shoots", Then Why Would We Need More "Stimulus?

If find it amusing that Warren Buffett thinks we need another stimulus to the economy. If the first two didn't work, why would a third one? It will only add to an already monstrous deficit! And if there really are "green shoots", to use Barack Obama's term, and the economy is growing again, then why would one be needed at all? This is a tacit admission of defeat, since claiming that another one is needed is an acknowledgment that the first two didn't accomplish what they promised, and since unemployment is now substantially higher than they promised if we implemented stimulus #2!

from Bloomberg:
Billionaire investor Warren Buffett said the U.S. may need a second economic stimulus package as unemployment is poised to continue rising.

“It looks like we’re going to need more medicine, not less,” Buffett said today in a Bloomberg Television interview. “We’re going to have more unemployment. The recovery really hasn’t got going.” Buffett is chairman and chief executive officer of Omaha, Nebraska-based Berkshire Hathaway Inc.

Stocks Can't Hold Gains, In Red Leading Into Open

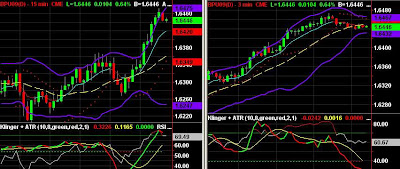
I was surprised last night when stocks rose very solidly and sharply at about 10:00 pm local time, but didn't see any follow-through (see green maribozu candle spike higher at left side of chart). I was unable to locate a news event that caused this gain, an 80-point spike in the Dow within 15 minutes. It's enough to convince me of a conspiracy or government manipulation of some sort.

Then, overnight, stocks failed to follow through with further gains, instead sinking back into negative territory to begin the trading day today. Pundits have indicated that until now, the stock market rebounded on faith, but so far, data has failed to confirm that faith with signs of lasting improvement. Thus, stocks have begun to sink again (chart shows declining trendl throughout the night). The right side of the 15-minute chart (above), and the shorter-term charts (below) show the story of steady declines. This morning's unemployment claims showed an increase, both in the weekly data and the 4-week average. This is not a sign of bottoming unemployment.

Has the Fed Thrown In the Towel on Quantitative Easing?

This morning on CNBC, pits reporter Rick Santelli suggested that in yesterday's Fed statement, the Fed appears to have "given up" on artificially lowering interest rates through treasury purchases. This would be suggestive of additional future interest rate hikes. Despite that, the treasury auction was well bid yesterday and recently. This chart is suggestive of a consolidation.

Wednesday, June 24, 2009

It Looks More Like the Great Depression Than Pundits Admit

from John Mauldin's Outside the Box, written by two economic historians, Barry Eichengreen of the University of California at Berkeley and Kevin O'Rourke of Trinity College, Dublin:

New findings:

  • World industrial production continues to track closely the 1930s fall, with no clear signs of ‘green shoots'.

  • World stock markets have rebounded a bit since March, and world trade has stabilized, but these are still following paths far below the ones they followed in the Great Depression.

  • There are new charts for individual nations' industrial output. The big-4 EU nations divide north-south; today's German and British industrial output are closely tracking their rate of fall in the 1930s, while Italy and France are doing much worse.

  • The North Americans (US & Canada) continue to see their industrial output fall approximately in line with what happened in the 1929 crisis, with no clear signs of a turn around.

  • Japan's industrial output in February was 25 percentage points lower than at the equivalent stage in the Great Depression. There was however a sharp rebound in March.

The parallels between the Great Depression of the 1930s and our current Great Recession have been widely remarked upon. Paul Krugman has compared the fall in US industrial production from its mid-1929 and late-2007 peaks, showing that it has been milder this time. On this basis he refers to the current situation, with characteristic black humour, as only "half a Great Depression." The "Four Bad Bears" graph comparing the Dow in 1929-30 and S&P 500 in 2008-9 has similarly had wide circulation (Short 2009). It shows the US stock market since late 2007 falling just about as fast as in 1929-30.

Comparing the Great Depression to now for the world, not just the US

This and most other commentary contrasting the two episodes compares America then and now. This, however, is a misleading picture. The Great Depression was a global phenomenon. Even if it originated, in some sense, in the US, it was transmitted internationally by trade flows, capital flows and commodity prices. That said, different countries were affected differently. The US is not representative of their experiences.

Our Great Recession is every bit as global, earlier hopes for decoupling in Asia and Europe notwithstanding. Increasingly there is awareness that events have taken an even uglier turn outside the US, with even larger falls in manufacturing production, exports and equity prices.

In fact, when we look globally, as in Figure 1, the decline in industrial production in the last nine months has been at least as severe as in the nine months following the 1929 peak. (All graphs in this column track behaviour after the peaks in world industrial production, which occurred in June 1929 and April 2008.) Here, then, is a first illustration of how the global picture provides a very different and, indeed, more disturbing perspective than the US case considered by Krugman, which as noted earlier shows a smaller decline in manufacturing production now than then.

Updated Figure 1. World Industrial Output, Now vs Then (updated)

Updated Figure 1. World Industrial Output, Now vs Then (updated)

Source: Eichengreen and O'Rourke (2009) and IMF.

Similarly, while the fall in US stock market has tracked 1929, global stock markets are falling even faster now than in the Great Depression (Figure 2). Again this is contrary to the impression left by those who, basing their comparison on the US market alone, suggest that the current crash is no more serious than that of 1929-30.

Updated Figure 2. World Stock Markets, Now vs Then (updated)

Updated Figure 2. World Stock Markets, Now vs Then (updated)

Another area where we are "surpassing" our forbearers is in destroying trade. World trade is falling much faster now than in 1929-30 (Figure 3). This is highly alarming given the prominence attached in the historical literature to trade destruction as a factor compounding the Great Depression.

Updated Figure 3. The Volume of World Trade, Now vs Then (updated)

Updated Figure 3. The Volume of World Trade, Now vs Then (updated)

Sources: League of Nations Monthly Bulletin of Statistics, http://www.cpb.nl/eng/research/sector2/data/trademonitor.html

It's a Depression alright

To sum up, globally we are tracking or doing even worse than the Great Depression, whether the metric is industrial production, exports or equity valuations. Focusing on the US causes one to minimise this alarming fact. The "Great Recession" label may turn out to be too optimistic. This is a Depression-sized event.

That said, we are only one year into the current crisis, whereas after 1929 the world economy continued to shrink for three successive years. What matters now is that policy makers arrest the decline. We therefore turn to the policy response.

Policy responses: Then and now

Figure 4 shows a GDP-weighted average of central bank discount rates for 7 countries. As can be seen, in both crises there was a lag of five or six months before discount rates responded to the passing of the peak, although in the present crisis rates have been cut more rapidly and from a lower level. There is more at work here than simply the difference between George Harrison and Ben Bernanke. The central bank response has differed globally.

Updated Figure 4. Central Bank Discount Rates, Now vs Then (7 country average)

Updated Figure 4. Central Bank Discount Rates, Now vs Then (7 country average)

Source: Bernanke and Mihov (2000); Bank of England, ECB, Bank of Japan, St. Louis Fed, National Bank of Poland, Sveriges Riksbank.

Figure 5 shows money supply for a GDP-weighted average of 19 countries accounting for more than half of world GDP in 2004. Clearly, monetary expansion was more rapid in the run-up to the 2008 crisis than during 1925-29, which is a reminder that the stage-setting events were not the same in the two cases. Moreover, the global money supply continued to grow rapidly in 2008, unlike in 1929 when it levelled off and then underwent a catastrophic decline.

Figure 5. Money Supplies, 19 Countries, Now vs Then

Figure 5. Money Supplies, 19 Countries, Now vs Then

Source: Bordo et al. (2001), IMF International Financial Statistics, OECD Monthly Economic Indicators.

Figure 6 is the analogous picture for fiscal policy, in this case for 24 countries. The interwar measure is the fiscal surplus as a percentage of GDP. The current data include the IMF's World Economic Outlook Update forecasts for 2009 and 2010. As can be seen, fiscal deficits expanded after 1929 but only modestly. Clearly, willingness to run deficits today is considerably greater.

Figure 6. Government Budget Surpluses, Now vs Then

Figure 6. Government Budget Surpluses, Now vs Then

Source: Bordo et al. (2001), IMF World Economic Outlook, January 2009.

[They added some country data in their revision that I put here, hence the two figure 5's, but they are labeled as such on the website and I did not change their labellling – JFM]

New Figure 5. Industrial output, four big Europeans, then and now

New Figure 5. Industrial output, four big Europeans, then and now

New Figure 6. Industrial output, four Non-Europeans, then and now.

New Figure 6. Industrial output, four Non-Europeans, then and now.

The facts for Chile, Belgium, Czechoslovakia, Poland and Sweden are displayed below;

New Figure 7: Industrial output, four small Europeans, then and now.

New Figure 7: Industrial output, four small Europeans, then and now.

Conclusion

To summarise: the world is currently undergoing an economic shock every bit as big as the Great Depression shock of 1929-30. Looking just at the US leads one to overlook how alarming the current situation is even in comparison with 1929-30.

The good news, of course, is that the policy response is very different. The question now is whether that policy response will work. For the answer, stay tuned for our next column.

Economic Recovery? Not So Fast, Say Income Tax Revenues!

from Barron's online:
The collapse in tax revenues should show the FOMC how far short the economy is from recovery.

THE FEDERAL OPEN MARKET COMMITTEE
supposedly is discussing an "exit strategy" at its policy meeting that ends Wednesday. That presumes that its destination is anywhere in sight.

Notwithstanding the so-called green shoots that appear to be popping up in various series of economic statistics, other numbers show things to be withering, if not rotting outright. What's more these data are not seasonally adjusted or otherwise fudged. They're tax receipts, and nobody pays taxes on phony, phantom jobs or earnings.

According to Trim Tabs, income-tax withholdings in the past four weeks are down 6.1% from a year ago; in the last two weeks, they're down an even bigger 8.1% from last year. That marks a sharp deterioration from May, when income-tax withholdings were off "only" 4.8% from a year ago.

"The deterioration in growth since May indicates wage declines and job losses have accelerated," according to note to TrimTabs' clients.

Meanwhile, "other" taxes were down 39.5% year-on-year, down from 33.6% in May. Corporate income taxes were down 35% from a year ago in the latest four weeks after having been down 12.3% year-on-year in May.

TrimTabs' numbers corroborate the dismal numbers on state personal tax revenues, which were down 26% in first four months of the 2009 from a year earlier.

According to the Nelson A. Rockefeller Institute of Government, 34 of 37 states that submitted data reported declines. Arizona, one of the epicenters of the housing collapse, saw the biggest drop, a stunning 55%. The Nos. 2 and 3 states were South Carolina and Michigan, with declines of 38.6% and 34.4%, respectively. California, whose massive budget woes are front and center, had the fourth-highest decline, at 33.8%

Not only do plunging tax revenues tighten the fiscal vise on the federal, state and municipal coffers, they provide unambiguous confirmation of the truly dire straits of the economy.

These numbers, of course, are at odds with the surge in the stock market, which had lifted the averages by about a third from those March lows. Now, however, equities appear to be rolling over, which could be nothing more than profit-taking to nail down wins ahead of the end of the second quarter.

But the advance also seems to be losing steam in bourses abroad as well as in commodities, which suggests much of the surge was liquidity-driven, not unlike last summer's spike in crude oil prices to $147 a barrel. We'll see.

ONE BOURSE THAT HAS HAD an "official" bear market appropriately enough is Russia. The RTS index, which is denominated in dollars, fell another 2.9% Tuesday, bringing its decline since June 2 to 21%.

Faring even worse has been the Templeton Russia and East European Fund (ticker: TRF), which was among the egregiously overpriced closed-end funds featured here a couple of weeks ago ("The Closing of the American (Investor) Mind", June 10.)

Since then, the price of the Templeton Russia and East European Fund has come crashing down even harder, to 15.95 from 23.15, a loss of 31% in a mere fortnight.

Part of that reflects the air coming out of the closed-end fund's premium over net-asset value, which was deflated by half. Even so, TRF still commands an outrageous 48% premium to NAV, down from the absurd 98% premium when I pointed it out in my earlier column. That's the danger of paying too much for a closed-end fund, or anything for that matter, no matter how hot the stock seems at the time.

Stocks Begin Selling On Fed Statement

Treasuries Crash, Interest Rates Rise on Fed Statement

Treasury Buying Is Back

Treasury Bears Come Back

Once the auction was complete, the treasury bulls and bond vigilantes came back into the market. Look at the sharp reversal!

Treasury Auction Went Well

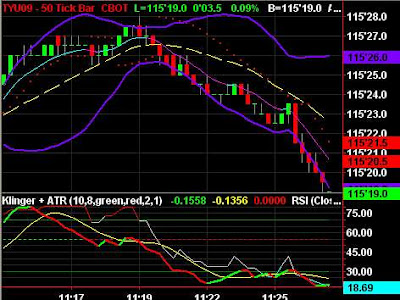
It appears from this 50-tick chart that the treasury auction went very well less than 20 minutes ago. Treasuries are rising very powerfully! Still, over the long haul, I and other traders (see my last post) are very bearish on treasuries. The shear volume of debt is staggering and unsustainable!

Watch the Dollar, Treasuries

I've been feeling this same way for the past week or so. From Mike Hinman at Lind/Waldock:

U.S. Dollar Takes Centerstage, by Mike Hinman

In just about every market, there has been a unique theme presenting itself during the last few months: the U.S. dollar has taken the global center stage. If you want to survive these trying times, I think you have to keep your eye on the dollar. Why? You don’t want to get caught up in multiple trades that will ultimately have the same end result. This is the first big mistake I am seeing these days. Some traders believe they have positions that are independent of each other, when in reality, it’s like having multiple units of the same position. This correlation has been high as of late across the board. It doesn’t hold true every single day for every market, but it does tend to get back to the same end result over time.

The next big question is what to do. There are two schools of thought on this subject. The first one is to diversify across the board. You will have a better chance catching the one that outperforms, but you will also be caught in the one that underperforms. I understand the reasoning behind this, but I don’t recommend it. The right answer, as far as I’m concerned, is to identify the leader and load up on that one regardless of how many units you need. It’s not the easiest thing in the world to pick out the “perfect” market, and sometimes you pick wrong. But in the long run if there is a clear leader for the trade you want, it usually ends up most profitable (or less costly, you can’t win them all) if you go this route.

Ok, so now the big question is what is the U.S. dollar going to do? Let’s take a look at a daily chart of the ICE Dollar Index futures contract, which tracks the value of the dollar against a basket of six global currencies.

First things first – I see a bullish flag formation establishing higher lows and a flat top. The breakout should come on the flat side, and we should be getting close to that day. The swing trade should bring this market up to the mid 82’s, so that’s my first objective until the next pull back and buying opportunity. These numbers coincide with a few trend lines that I don’t necessarily follow or would recommend trading off of, but it’s a good thing to keep an eye on and be aware of.

hinman-6-22-09-dollar_index_daily1

One thing I do pay attention to is the sentiment index and how investors feel. When the dollar was on its lows just three weeks back, the Daily Sentiment Index for the dollar was showing 6 percent were bullish. So 94 percent of people were bearish the U.S. dollar in the short run. The individuals who make up this index are the same people who always seem to show up late to the party. That boat was heavily lopsided, and finally tipped.

Your average investor can’t understand how the U.S. dollar could go higher with our government printing money and issuing debt at an unheard of pace. There are two reasons for what is occurring. The first has to do with the amount of wealth and U.S. dollar-denominated debt that is being destroyed. At this stage of the game, there is more destruction than creation. It’s like pouring water into a well that never fills up.

The second part of the equation has to do with the financial health of the rest of the world and how investors would much rather flock to the U.S. dollar than anything else in a crisis. This is what I see in the short run. We are in the very early stages of major trend reversals if my overall analysis is correct. I can’t give you an exact definition on the “short run” just yet. It may be three months, six months, or even two years, I’m not sure yet.

Inflation Likely Ahead

In the long run, which I am guessing is two years or more, I see the exact opposite of what I just described. All that U.S. debt and printed dollars will make their way into circulation. I think the value of the dollar will collapse. Inflation will take charge and all commodity prices will head higher. It won’t happen now because too many people are anticipating it. It will most likely come when you least expect it.

Now that you have my view on the U.S. dollar in the short run, you can probably tell that I have turned bearish on commodities and currencies in general. The key is to pick the sick sister of the bunch. I personally think corn and the metals, specifically gold and silver, look the worst.

Treasuries

Let’s now look at Treasury bond futures. Investors are bearish bonds. The daily sentiment index for Treasury bonds was 8 percent bullish just last week. These individuals think the dollar is worthless, the world will look for a new reserve currency, interest rates will have to go up to attract investors and everyone, specifically China, will start selling their bonds. I don’t think this is going to happen. I just made the case for a strong dollar in the short run. The world will not look for a new reserve currency–not yet anyway. That will take years, and I have doubts it could even happen in my lifetime. And, China couldn’t sell that much U.S. debt without causing them grave financial stress. The bottom line – look for bonds to head higher with the dollar in the short run.

hinman-us_treasury_bonds-6-22-09

How to Survive as a Trader

Liquidity and volume have been drying up in general recently. This has caused all the markets to be more volatile without rhyme or reason on a daily or even hourly basis. This is not the environment I enjoy. The first and most important rule in choppy times is to reduce your size. This keeps you around tomorrow if you go on a cold streak. Most people over-trade and chase their losses in poor times. Double down when you are making money, not losing.

You must truly believe in the positions you are entering. I have found the right way to tackle good trades is to first decide what you want to do, and then get in. That usually means buying when it looks awful, and selling when it looks good. Don’t get this confused with picking tops or bottoms. I’m talking about getting in on counter-trend moves.

Last but not least, when you have profits, take the money and run. It disappears too quickly if you don’t. Pushing positions in this environment has not been turning out well. Don’t get caught in that trap. The time will come for trend following, it just isn’t here today.

Corn, Wheat Continue Distribution

I think soybeans are still overbought, but corn and wheat are certainly continuing the liquidation trend. Corn and wheat are now very close to the support levels from which they rallied this past Spring ('09). We should see them find support again soon. That said, this liquidation is so powerful, it may drag soybeans off its perch, too! The most recent USDA planting report showed that more acres would be transferred to soybeans that had been intended to be planting in other crops, but even with these recent changes, the soybean crop is expected to be smaller than the 2008 crop.

CornWheat

Investors Show Caution

this is amazing given that it is from the Obamapoligist Network, CNBC:

A growing chorus of economic signs pointing to slow growth is sending some investors away from risk amid worries that a market correction is in the works.

The results of such fears have been evident in the stock market over the past week.

While Wall Street on Wednesday was poised to avoid its seventh down session in the past eight trading days, analysts were worried that some of Fed Chairman Ben Bernanke's "green shoots" were turning brown.

While no one is putting forth any doomsday scenarios—calling the low in March still seems a safe bet—the idea of a substantial summer pullback is gaining momentum.

"Slow growth and higher taxes—that's not a recipe for higher stocks," says Michael Pento, chief economist for Global Delta Advisors in Parsipanny, N.J. "The threat of a deflationary spiral is looking pretty good for now and that's what spooked the market."

The dour signs for the economy have been piling up lately. The White House on Monday conceded that 10 percent or worse unemployment is fairly inevitable, while the World Bank earlier that day predicted slow global growth.

At the same time, talk has accelerated for a Fed exit strategy from its onslaught of money easing and other liquidity measures. On top of all that, the Mortgage Bankers Association predicted far fewer originations this year than originally thought, and the National Association of Realtors said existing home sales in May gained less than expected, which was followed by a report that new home sales had unexpectedly decreased.

Wednesday's report on durable goods orders provided a brief respite from the gloom, but all of the economic noise has caused portfolio managers to start preparing for slower growth.

"The one thing that we can be sure of is that recoveries follow recessions. It's a safe bet that the economy will recover," says Peter J. Tanous, president and director at Lynx Investment Advisory in Washington, D.C. "What has to change are two things: 1) Our estimate of future growth. That may be a sea-change. It may not be as fast as thought. Secondly, how we build our portfolios to safeguard our original investment."

Investors who stayed heavily in stocks during the downturn lost portfolio value of 35 percent or more.

For Tanous, the steep, rapid slump should be a lesson that US investors were too weighted toward risk and leverage and need to rethink their strategies as the economy embarks on a journey that likely will take years before full recovery.

"Investors just got a punch to the gut," he says. "Did you learn anything? Are you going to listen to the people who say stocks are really cheap now? They are, and you should own them, but maybe you should own less of them than you used to."

Predictions vary as to how much of a pullback stocks will see, but the consensus seems to be around 10 percent.

Linda Duessel, equity market strategist at Federated Investors in Boston, says the Standard & Poor's 500 could see as low as 830 but thinks the damage will be minimal and merely reflective of a natural retracement following the dramatic run-up.

"From an investing standpoint, the question I'm getting asked most often is, do you think it's too late to get in," Duessel says. "A pullback to the 800s might be a nice time to get in."

Some investment advisors say they are staying in stocks but are returning to quality after a whipsaw rally from March to June that saw the biggest gains in the hardest-hit sectors of the previous slump, a phenomenon that Morningstar analyst Paul Larson calls a "junk rally."

"As financial innovation goes into reverse a little bit and things get a little simpler, that's going to be a drag on economic growth at least for a few years," Larson says. "My strategy is to focus on the high-quality names, the ones that are going to be assured survivors."

That's a recurring theme from portfolio managers who are looking for strategies to pursue in the next wave of the market cycle. Many of them agree that the rally off the March lows is just about out of steam and are trying to position themselves going forward.


It's a Rally!

Stocks rallied, breaking a losing streak that brought us to the dynamic support level of the lower Bollinger Bands. Improved durable goods orders are given much of the credit.

from Reuters:
An unexpected jump in U.S. durable goods orders last month backed hopes that the economy was healing, but news from the hard-hit housing market remained mixed.

New orders for long-lasting U.S. manufactured goods rose by a much stronger-than-expected 1.8 percent in May, Commerce Department data on Wednesday showed.

Analysts polled by Reuters had forecast durable goods orders would decline 0.6 percent last month.

May's increase, the third gain in 4 months, followed a revised 1.8 percent gain in April.

U.S. stocks opened higher after the much durable goods data, while U.S. government bond prices fell, although trading was also somewhat overshadowed by a Federal Reserve policy statement due later.

"The economy is bottoming here, and we're looking for the Fed to maybe change its statement slightly and maybe start to suggest a more neutral balance of risk. A nod, basically, to an exit strategy," said Kim Rupert at Action Economics LLC in San Francisco.

The Fed is due to deliver its policy decision about 2:15 p.m. EDT. It is expected to leave interest rates unchanged in a range between zero and 0.25 percent, and many economists think it will lean against rate hike speculation by emphasizing they will stay low for an extended period.

Tuesday, June 23, 2009

Housing Recovery Still Distant

from Reuters:
Sales of previously owned U.S. homes rose for a second straight month in May but were weaker than expected, adding to growing fears of an anemic economic recovery from a deep recession.

The chief economist of the National Association of Realtors, which released the data on Tuesday, said sales in some areas appeared to be slowing and warned of the danger of a "delayed" housing market recovery.

from CNBC:

I hate to say I told you so, but on May 1st and again on June 1st, I told you about the potential negative ramifications of the Home Valuation Code of Conduct. Today the Realtors confirmed what I had been hearing all across the mortgage industry.

Home Appraisal

“In the past month, we have suddenly been bombarded with many stories of, at the last moment, transactions falling apart because appraisals are coming in unrealistically low,” said National Association of Realtors Chief Economist Lawrence Yun. “As a result it opens up a new round of negotiations between a buyer and a seller or in many cases the buyer just steps away.”

Weak Stocks Boost Treasuries, Cut Yields

Stock market weakness and consolidation are boosting treasuries, as investors once again flee to what is perceived as a safe haven (see gold also in earlier post). My concern over the long-term is that eventually, treasuries will no longer be perceived as a safe haven. Then, commodities will likely sky-rocket as investors buy anything physical. If government and politicians try to intervene, then investors will flee the Dollar, causing commodities to rocket even higher, and there will be shortages of many commodities.

StocksTreasuries

Dollar Drubbing

The Dollar is taking a beating today.

Dollar
EuroAussieBritish Pound

...and Commodiities Rebound Higher!

Crude Oil
Soybeans
Gold

Monday, June 22, 2009

In Sign of Reversal, Russia's Stock Market Moves Into Bear Market Territory

from Bloomberg:
Russia’s Micex Index tumbled more than 20 percent from its 2009 peak, becoming the world’s first benchmark equity index to enter a bear market since global stocks began rallying in March.

The index of ruble-denominated shares slid 7.8 percent to 937.98 as of 6:46 p.m. in Moscow, bringing its decline since June 1 to 22 percent. The 30-company gauge led a worldwide retreat in stocks this month on concern the global recession will persist for longer than investors anticipated.

“The market needs to pause because it has been going up too much,” said Nicholas Field, who helps manage about $11 billion in emerging-market stocks at Schroders Plc in London, including Russian equities. “Nothing goes in a straight line.”

The MSCI All-Country World Index slid 5.8 percent from its 2009 high, paring its gain from a six-year low on March 9 to 39 percent.

The Micex, which rallied as much as 135 percent since October, is tumbling this month after reaching the most expensive level relative to profit estimates since January 2007, according to data compiled by Bloomberg. Russia’s economy may shrink 7.5 percent this year as industrial production collapses, unemployment rises and investors pull capital from the world’s largest energy exporter, the World Bank said today. That compares with the Washington-based lender’s forecast for a 2.9 percent contraction in the global economy.

Treasuries Rally, Stocks Swoon

TreasuriesStocks

World Bank: It's Going to Be Worse Than We Thought

from Bloomberg:
The World Bank said the global recession this year will be deeper than it predicted in March and warned that a flight of capital from developing nations will swell the ranks of the poor and the unemployed.

The world economy will contract 2.9 percent, compared with a previous forecast of a 1.7 percent decline, the Washington- based lender said in a report today. Growth will be 2 percent next year, down from a 2.3 percent prediction, the bank said.

The bank, formed after World War II to fund health and development projects in poor countries, said that while a global recovery may begin this year, impoverished economies will lag behind rich nations in benefiting. The lender called for “bold” actions to hasten a rebound and said the prospects for securing aid for the poorest countries were “bleak.”

“The recovery is not going to be V-shaped,” said Alvin Liew, an economist at Standard Chartered Bank in Singapore. “We may see slower consumer demand over a prolonged period.”

The bank is more pessimistic than its sister organization, the International Monetary Fund. The IMF, which is forecasting a global contraction of only 1.3 percent this year and growth of 2.4 percent in 2010, said June 19 that it plans to revise estimates “modestly upward.”