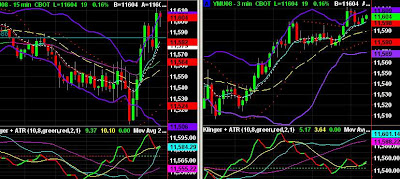
So far this week, the Dow has had three days of triple-digit up and down days. The market has moved up 300 and 200 points, and down 200 points. Last week, there were two days that exceeded 200 points up, and two days that exceeded 200 points down. If this doesn't make for a manic market, I don't know what does.
Over the past month, the Dow has been trading within the Bollinger Bands and hasn't breached them and closed outside them. This is considered to be a prime set-up for a Cahen breakout based upon the Dynamic Technical Analysis trading methodology. It also suggests a period of minimal volatility on the longer time frame, despite the large numbers of triple digit days. The Bollinger Squeeze indicator also shows the small red dots that indicate that volatility is too low to trade on this time frame. Long-term trades at this point would be very risky and imprudent. When I trade stocks, I will only day trade them for now.
The longer we must wait for that breakout to occur, the more forceful that breakout will be when it occurs. In this daily chart for the Dow, we can clearly see that the Dow has been contained within a trading range defined by the Bollinger Bands since July 16th.
Direction of BreakoutWhile the breakout may occur in either direction, up or down, the Klinger Volume indicator suggests a breakout to the upside -- for the moment. Volume is building for the stock index futures to move higher.
The Bollinger Squeeze indicator seems to suggest a bearish breakout, while the MACD indicator also suggests a bullish breakout. Note also that the number of bullish candles (green ones) over these past few weeks outnumber the bearish (red) ones by a ratio of nearly two to one (2:1), especially this week. That also suggests a greater likelihood of a bullish breakout. Furthermore, the lows have edged progressively higher, while the highs have remained about the same, which seems a somewhat bullish omen. And most of the trading has been done above the Bollinger Moving Average (20 period SMA). As the older candles age out of the Moving Average, it will begin to move higher, unless prices drop below the MA and take the average lower within the next few days. This might also be considered to be bullish because the moving average tends to serve as support.
Bullish Stock Market BiasI've mentioned prevously that there always seems to be a bullish bias for stock indexes. This is because the Fed and the U.S. government approve of stock price inflation. All the rescues, bail-outs, stimulus, credit supports, interest rates, monetary policies, PWGFM (President's Working Group for Financial Markets, also known as the Plunge Protection Team) interventions, and liquidity injections are intended to provide price support for Wall Street and create the impression of prosperity. Our government loves inflation, despite the jaw-boning to the contrary. Asset inflation creates the illusion of prosperity, and provides cover for elected officials to continue overspending, but unfortunately doesn't provide any sustainable benefits. Inflation is the policy!
 I strongly recommend a very fine article on the seasonal buying patterns of gold. I had wondered about these seasonal aspects for years, but this is the best article I've read on the subject.


