Saturday, March 15, 2008

If Grain Is So Expensive, Why Are Livestock Prices Falling?

This is important for America to understand. At the same time that grain futures prices are skyrocketing, prices for livestock are plummeting. Look at these two charts for Feeder Cattle (upper chart) and Lean Hogs (lower chart):
Why The Dichotomy?
At the same time that the prices of corn and other grains that feed livestock are going up like a mushroom cloud, why are prices for livestock plummeting?

I have posted these two charts above because I want to display graphically the phenomenon that is occurring. As can be seen in these two charts, prices for lean hogs and feeder cattle are plunging at the same parabolic rate as grains prices have been rising. Because it is too expensive to continue feeding the animals at current grain prices, ranchers are being forced to sell their livestock and send it to slaughter much sooner than planned. The cost to feed the animals is rapidly escalating, and rather than face bankruptcy by continuing to feed them, they are disposing of the animals. With so many animals being prematurely sent to slaughter, futures prices for pork and beef are plunging downward. Wholesale buyers are having a bonanza, buying the younger animals and reducing their input costs, increasing their profits (we're not seeing cheaper beef or pork at the grocery store, are we?).

So why should we care?
Because in about 12-14 months' time, the number of livestock animals in the United States will be significantly fewer, and then, meat prices will soar for two reasons:

  1. Grains prices will go even higher still, as the number of animals on feed increase back to normal levels, further increasing upward price pressure on corn and other feed grains.
  2. Fewer livestock animals available for meat production now will increase the price (lower supply + same demand = higher prices) for them later (lower supply leads to higher prices later) and will drive prices for hogs, poultry, and cattle futures through the roof.
When this occurs, the livestock ETF (ticker - COW) will then rise as rapidly as fireworks on the Fourth of July (or many more Americans will become vegetarians). We should begin to see this occur within 12-14 months according to livestock futures traders I've communicated with. In recent weeks and months, COW has been sliding toward the pits. See the COW chart below.
All of this is the terrible consequence of a badly misguided government policy of turning food (corn, soybeans, sugar) into fuel (ethanol). The only people who will ultimately benefit from this fiasco are the politicians! Meanwhile, America continues to slide toward energy oblivion!

Friday, March 14, 2008

US Dollar: Fresh New Lows

The US Dollar today has once again sunk to fresh new lows, both as an all-time low and a new closing all-time low. There has been some tough talk this week by the Bank of Japan and the European Central Bank about intervening in the currency markets to prop up the Dollar, but with the tame CPI report earlier today, renewed certainty of fresh Fed rate cuts has resulted in the market ignoring threats, and the USD sinking to new lows today.

Corn -- They're Buying

Look at the buying that has stepped into the corn futures market in the 2nd half of the trading day. Look at the blue box in the lower panel on the right side. Now that's volume!

Wheat Begins Rebound Toward Close

You may notice on this chart that I am experimenting with a shorter-term EMA as well. I have also removed the Parabolic SAR from my charts for today. I simply find little use for it.

Lockdown: Soybeans & Wheat

Both soybeans and wheat (above) have reached (for wheat, came within a hair's breadth) lock limit down prices. What a remarkable event, considering that both grains have been in a bull trend for extended periods and that they both have a wide lock limit range.

The weekly chart, below, puts the bearishness of soybeans prices over the past few days into perspective. This chart extends back to about April 1, 2007. This weekly chart, by the way, could have been extended much farther into the past, and would have gone much lower still. It is significant also that prices have now closed below the Exponential Moving Average and the Klinger Volume indicator is also showing heavy distribution pressure -- and this is the weekly chart! Since prices have closed at lock limit down, this suggests that for long-term traders, if prices continue downward on Monday, even long-term traders may choose to sell as well.

New Record for Gold: $1009.20

Soybeans Bounce Up From Lock Limit Down

Soybeans have touched and bounced off their lock limit down price this morning, after moving modestly higher overnight on weak volume. The first chart is the short-term intra-day for today. For the past few days, s0ybean trading has been listless and we have seen unconvincing trading within fairly narrow ranges. Trading has been fairly poor. Today, we have seen a solid break-out to the down side. It remains to be seen how the market will play out today.

Daily Chart
We see in this daily chart that the Exponential Moving Average continues to provide dynamic resistance to soybean prices, and prices have now broken down as I anticipated that they might. Prices have now broken through the previous soybean low of March 10th. While I personally am resistant to trying to predict the future, partly because it creates a bias in my mind that leads me to make market errors that cost me money, I also recognize what happens when prices pass below the Exponential Moving Average. It tends to serve as a form of dynamic resistance. Note on the chart that prices havve touched the EMA four consecutive days in a row, and then moved substantially lower. Why? I don't know. I just observe the phenomenon. And because of this phenomenon and its repeating pattern, I also have expectations about market behavior based upon past performance of these indicators over many incidences. The Klinger Volume indicator here has continued to show heave selling of soybeans. I still expect that this soybean bear will be short-term in nature, due to the strong longer-term fundamentals and depletion of grains in storage in the United States, but this price break-down may be a much needed, albeit temporary, correction.
Exponential Moving Average
Excerpts from Robert Colby's book, "The Encyclopedia of Technical Market Indicators":
"The EMA is the best of the moving average techniques, and it is increasingly preferred by technical analysts over other moving average methods."
"...the EMA rrepresents an excellent compromise between the overly sensitive weighted moving average and the overly sluggish simple moving average."
"the simplest and most streamlined of all moving average techniques."
"A significant advantage of this superior computational method is that the EMA is never distorted by old data suddenly dropping out of the calculation."
"This is the best simple trend-following indicator we tested against daily DJIA /Dow Jones Industrial Average/ data."

For more information on the Exponential Moving Average and the settings that Mr. Colby used, as well as many other technical indicators, please buy his book.

Bombshell: Fed Rescues Bear Stearns

Using its new $200 billion collateral window pre-emptively for mortgage-backed securities, the Fed and JP Morgan Chase has stepped into the financial markets to rescue Bear Stearns from a liquidity crisis. This has turned the positive sentiment following the flat CPI data into a financial crisis literally within less than an hour, and has turned market sentiment once again within an hour. The nagging question hanging over the market now is, "Who else?" What other investment banking firm is going to be faced with a liquidity crisis in the next few days or weeks?

US Gov: Feb CPI, Inflation Tame

The U.S. government CPI data released this morning is reporting that energy and commodity prices during February 2008 dropped! I'm not sure what planet they were living on, but the consequence is a stout rally in stock market futures. It also makes a near certainly the likelihood that the Fed will lower interest rates aggressively next week when the FOMC meets. Fed Fund futures are predicting a 75 basis point cut with nearly 100% certainty.

Perhaps there is an explanation for this clearly erroneous number. If the data was collected in the early days of the month, when crude oil prices fell to $86.34, it is possible that the reported data accurately recorded a price drop from earlier figures. However, since the consequence of this CPI report is 1) further aggressive Fed easing and 2) an even weaker US Dollar, it is even more likely that future inflation data will heat up even more.

If the data for CPI and commodities was collected prior to the most recent run-up occurred, then the market reaction, combined with next month's explosive numbers, will both add even greater fuel to inflation down the road. This CPI report will provide the Fed with cover to ease even more aggressively, thus further weakening the dollar and likely igniting still higher inflation and commodity prices.

It appears that just about everyone suspects this CPI report as containing bad data, and this simply increases the likelihood that CPI will go much higher in future months. Perhaps it will also moderate the impact if market participants view the CPI report with suspicion.

Thursday, March 13, 2008

News Flash: Gold $1000, Oil $111

Import Prices From China -- Up Six Months in a Row!

My friend Rick Santelli on CNBC reported today that import prices from China to the United States have risen six consecutive months in a row, reaching a new high today of 3.4%! Before this period, import prices from China fell month after month. Now, instead of manufactured goods from China causing deflation, imported goods are adding to inflation, and are stoking the fears of even higher inflation ahead.

Also on the inflation front, here is a good article today on Bloomberg:

Bernanke Cuts in `Heat of the Battle' May Wreck Inflation Call

Wheat Tops Out Again

Wheat prices, after climbing rapidly the past few days, have once again topped out. Wheat is closing lower today on fairly solid selling interest (see bottom left, Klinger Volume is solidly red and falling). It remains to be seen whether there will be follow-through to lower prices on Friday.

Soybeans Condolidation

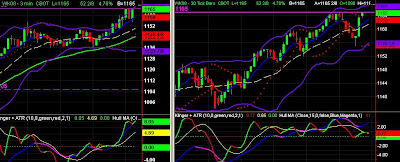
Note in this chart that soybean prices found resistance today at the Exponential Moving Average on the daily chart (left). The chart on the right is the 15-minute chart. The same occurred on Tuesday. Also notable is the continued strong selling as reflected in the Klinger Volume indicator on both the daily and intra-day chars. Even with two green candles indicating up days, the volume indicator continues to signal more selling. This is particularly important on the daily chart, because it suggests selling by large funds and commercials. Still, the pattern, by itself, on this chart seems to indicate that a consolidation is forming for now. As the EMA moves lower, there will added pressure for prices to move lower. On the intra-day charts, trading has improved, but not markedly. These last few days have been difficult, but still profitable.

What Impact the Fed?

I ran across this chart today, and found it interesting. It shows what impact Fed actions have had on the markets. The initial 50 basis point cut in August ignited a new high in October, but since then, Fed actions have had mostly short-term impact and markets have moved lower within days.

Untradable Grains

Grain charts are too erratic for me to trade profitably today. When this happens, I read a book and watch the charts. When the charts begin to look right to me again, I'll begin to trade. Until then, I watch and wait.

I watch for three conditions in order to trade:

  1. Tight spreads. On this measure, soybeans and corn are fine. Wheat spreads haven't widened to the point that I won't trade them.
  2. Sustained, reliable movements, either up or down. This is hard to describe, but I know what it looks like. Perhaps the term market noise is a good way to describe poor trading conditions. Right now, the charts don't look right.
  3. Volatility. Without volatility, it become worthless to try to trade because the risk/loss ration is too high and profits can't be obtained.

Soybeans Firm Up Overnight, Wheat Softens

Soybean futures continue to firm up into what may emerge as a consolidation phase overnight. It is still early to know, but soybean prices have been fairly flat for the past four trading days. Range trading may the be order of the day for the foreseeable future.

Wheat futures prices, on the other hand, have softened on light volume overnight. After the rapid run-up in wheat prices over the past few days, this is to be expected.

Debt Spiral!

Carlye Capital is behind the morose sentiment in stock markets, as the subsidiary of the private equity firm is deep in hot water and unable to meet its margin calls.

Inflation Up Less Than Expected?

Following a month in which both food and crude oil prices surged higher than they have in years, government reports reported that prices for these two items fell! Go figure! Clearly, the data is in error, and next month, these prices will certainly surge even higher still.

Crude Oil

Crude prices reached $110.70 overnight!

Dow Approaches Open, Down 150 Points!

Stock index futures overnight have been sinking gradually, but without significant retracements upward. It has been a gradual decline, but are off their lows.

$1000 GOLD!

Gold has finally hit the $1000 benchmark, igniting more concerns of higher inflation.

Wednesday, March 12, 2008

USD: I Know, It's Hard to Believe!

Meanwhile the USD continues to sink even lower tonight, setting new all-time record lows. (My posting headline is a facetious attempt at sarcasm.) Mr. Bernanke, are you trying to sink the ship? You're sure doing a fine job of it!

Time to Start FIlling the Life Raft for Stocks

The Fed's rally yesterday was very short-lived. Even I'm surprised! But more disconcerting still is that the S&P 500 futures tonight are continuing to fall ever farther, as depicted on this chart of the plunging stock market futures in the evening trading hours today. As of 12:40 am EST, more than 43,000 contracts have been traded during the evening hours here in the United States. Could you pump that raft up a little faster, please? It's getting a little wet in here...

It's Crude and It's Ugly! Very Ugly!

Believe it or not, crude oil was at only $86.34 per barrel on February 7, just slightly more than one month ago! Today, crude oil surpassed the $110 per barrel price on the April 08 contract. That is a 27.4% increase in just 5 weeks. Crude oil has risen 19 of the last 25 trading days. At that rate of inflation, compounding every five weeks, crude oil will cost nearly $150 per barrel by April 30th and more than $200 per barrel before the 4th of July. At some point soon, this escalating price spiral will crush demand, and this point can't be all that far away. That is ugly for the world economy! Something's gotta give! Soon!

USD Sinks to Another New Low

Softening Soybeans?

Look at this daily chart for soybeans. There is a downtrend in place! Soybean prices have been down 6 of the past 7 days. Prices have closed below the Exponential Moving Average the past 5 consecutive days. Who would have ever thunk it? But the charts don't lie!
One of the reasons that new emerging trends are so hard to recognize is that they tend to occur at a time that our thinking is so strongly biased by past conditions to different, opposing or contradicting circumstances. The new trend flies in the face of long-held beliefs and ideas that we have accepted as certainties. Recognizing these biases is one of the most important skills we must develop as traders.

But look at the volume-based selling in the lower panel (red line)! Even with that one strong day of upward prices when the lock limit down days ended, the Klinger Volume indicator didn't even flinch in continuing to point in a downward momentum path. That's strong selling! It seems difficult to imagine that there could be a soybean bear emerging when soybean prices have been rising so long. There will come a true test soon, as the price lows from March 10th are tested and hold for a consolidation (or renewed uptrend), or are tested and breached for a longer-term downtrend.

The soybean bull has been steadily pushing prices higher since mid-2006, so a pull-back of a few days hardly a bear makes. Still, the forcefulness of the recent sell-off must be considered as significant, especially in the face of continued strong global demand. My instinct tells me that this will likely develop into a consolidation rather than a long-term bear market. But the futures markets have humbled me more times than I can count! Those last two candles (today and yesterday) are both spinning tops, representing market indecision, and the long green one preceding them reversed a series of lock limit down days. Only time will tell!

Wheat: Up, Up and Away

Wheat is where the trading action is today, with wheat prices approaching lock limit up (green line) yet again. Record-low stocks of wheat in storage and firm global demand are driving wheat prices higher. Also, poor weather in some parts of the winter wheat-growing regions of the United States are pressuring prices. Amazing how different things are today from just a few months ago. Note also the daily chart below, which has been extremely volatile.

Bean Bearishness Sets In

Soybean prices have turned bearish, and prices have finally begun to show some steam to the downside. Note especially on the 3-minute chart that the Klinger Volume indicator is showing strong selling into the weak price rise this morning (blue box, bottom left). This appears to have been prescient of this price plunge within the past few minutes.

Soybeans: Erratic, Unconvincing Trading


I have learned over time that I must always remain alert to the emergence of a new opportunity, but today's soybean trading has been erratic and unconvincing thus far. We are changed less than 5 cents from yesterday's settlement price. Wheat is similarly erratic and unreliable. The CME seemed to suggest this possibility on their pre-market commentary, with no strong news having occurred overnight. This chart suggests difficult trading conditions. I will probably spend a lot of time reading and watching the charts today. I will use the time productively regardless.

Wheat: USDA Says Stocks at 60-Year Low

From the CME website this morning:

"tightness is expected to persist with the USDA pushing ending stocks to a 60-year low".
U.S. grain stocks are at60-year lows! Note since World War II has grain in storage been so low in the United States! I hope you have some grain in storage, or you may soon not be able to eat! That sounds very bullish for wheat prices long-term.

On the other hand, the CME website also conveys a somewhat bearish sentiment for soybeans. Of course, as it says in Mark Douglas' book, "Trading in the Zone", one of the five fundamental truths of trading is that "anything can happen".

Tuesday, March 11, 2008

Stock Stampede! Great Legs!

The latest Fed rally today has legs! The Dow closed today higher by more than 400 points, and continues even higher in after-hours futures trading! This one may be just the ticket to put in a firm bottom on the stock market and provide the boost necessary to ensure that the United States economy is able to begin a well-anchored recovery. I am being told by some of my insider friends that by allowing investment bankers to borrow against some of their questionable derivatives and exchanging them for U.S. Treasuries at 28-day intervals, this latest Fed move may be able to provide liquidity to the financial markets without igniting more inflation. This action would provide short-term relief to Wall Street without huge new injections of additional money (emphasis on the word additional). If this move forestalls deeper Fed rate cuts next week, it might work. We shall see!

I'm not that easily convinced. But the rally today in stocks suggests that the financial markets are seeing optimism and a possible end to the quagmire! The charts seem to reflect the stock market optimism today. The only thing that worries me is the possibility that while this action might not increase the money supply, much of that additional liquidity will end up in the commodities markets, kindling still higher prices in energy, metals, and agricultural products and igniting yet higher inflation. Fed Chairmen have admitted that while they can pour money into the markets in an attempt to grease the economic engine, they can't control where that money will go. Again, we shall see!

One thing is for sure:
This was an undeniable stock stampede today!

Has the USD Bottomed?

Personally, I think it is too early to tell, especially with further Fed rate cuts a certainty. However, this chart may be sending an early signal of a bottom, or at least a consolidation, for the greenback.

Sagging soybeans!

I'm a Grain Bull (Medium to Long Term)

I read this on the CME's website this morning:

Soybean prices moved higher today after trading higher overnight. The USDA's latest Supply and Demand Report was released this morning and it pegged US soybean ending stocks at 140 million bushels compared to 160 million bushels on last month's report. This was below trade expectations and the drop was caused by a 20 million bushel increase in US exports to 1.025 billion bushels. The stocks/usage ratio fell to just 4.6%. Since 1965, there has been only one other year (4.5% in 03/04) in which the stocks/usage level was lower. The old crop tightness only adds to the importance of receiving both a jump in planted area and a high yield for the coming season.
That sounds very bullish to me. If stockpiles of U.S. grain are at multi-decade lows (lowest since 1965), and current price levels depend upon both a "jump in planted area" and "a high yield for the coming season", what will happen to grain prices if the weather doesn't cooperate, planted area doesn't meet expectations, or for some other reason, yields are lower than expected? Last week, the CME also indicated that the percentage of U.S. grain up-coming (future) yield that had already been sold was about 95%, compared to the average of about 80%. That's grain that hasn't even been planted yet, and it is already 95% committed/sold. To me that is very bullish for the medium to long-term. And what would happen if there was a drought this summer in the mid-west? Or even a drought in Australia (as happened in 2006) or in one of the other major grain-producing nations, thus increasing demand for already tight global supplies?

Wheat Locks Limit Up

Wheat has locked limit up this morning, after trading mostly sideways to modestly higher overnight.

(Inflation) It's Baaaa-aaaack!

With oil rising to $109.72 per barrel, a new record, this morning before falling back somewhat, the rapidly rising specter of inflation can not be denied. I see headlines like this on Marketwatch.com this morning:

Fed Turns On the Spigot of Money Again


I see such headlines, followed by this as the first sentence of the article:
The Federal Reserve and other leading central banks announced further steps Tuesday to flood dysfunctional credit markets with enough money to get them working again.
On dictionary.com, the definition of inflation is:
1.Economics. a persistent, substantial rise in the general level of prices related to an increase in the volume of money and resulting in the loss of value of currency (opposed to DEFLATION).

This definition suggests the influence of monetary policy (volume of money) as the cause of inflation. It's a good definition because it clearly states both the cause -- volume of money -- and the consequence -- loss of value of currency. Obviously, there are additional variables, like supply, demand, and geopolitics, but the primary influence, especially in a world where crude oil and gold are priced globally in U.S. Dollars, is an overabundant money supply. This headline should make anyone shudder, after seeing the impact of Fed monetary policy on inflation over the past few months.

While other commodity prices have moderated slightly over the past week, grain and some softs prices have surged higher once again, and appear to be poised to continue higher still.

The stock markets were initially pleased as punch at the latest Fed "trick", as the above website called it, but at the time of this writing, that initial gain has now been sliced in half! I suspect that, like past Fed dog and pony shows, this one will last only a day or two also. The current rally may have even been caused by short covering after the market opened, in which case the market will likely sell off during the day, as investors realize that the Fed's latest "fix" (another marketwatch.com term) is just that -- a temporary "fix" for a credit-addicted Wall Street. It stops the shaking, but only temporarily, just like a quick "fix" of heroin stops the shakes for a drug addict -- temporarily. And just like with a heroin addict, larger and more frequent credit fixes will become more and more necessary to save the economy, until the victim hits rock bottom -- or worse.

While I personally hold no positions of any kind in the stock market or stock indexes at this moment, I empathize with those who do. When the Fed intervenes repeatedly during the hours when the stock market is closed, as they always do (acting always before the market opens) creating fools gold rallies while investors can't take any action to defend or remove their positions, these Fed "tricks" become cruel jokes indeed. This is one reason why I hold no stock or stock index positions, except long and short-term ones (day trading), and am reluctant to take one. I get the message, Fed! But if we believe in free markets, doesn't that also mean (Fed and/or government) intervention-free also?

Fortunately, in the futures markets, I can quickly exit a position when the Fed acts, due to futures' near-24-hour trading schedule, but I have sympathy for people who are locked into a position until the stock markets open one hour after the Fed intervenes with its latest "magic trick" fix . There is a cruel hidden message from the Fed to investors not to short the market or the Fed will punish you by acting to hurt you while you are defenseless (ie., while the market is closed). Is that not a cruel trick? Again, I get the message, Fed!

Chick Goslin, in his book, "Trading Day By Day", mentions the constant government interventions into the stock market as a risk to anyone who shorts the stock market. What a great way for the Fed to keep propping it up and ensure perennially higher stock markets. And is that not the very definition of a bubble?

The Fed is the worlds greatest -- and worst -- illusionist, both at the same time! Cheap tricks!

Monday, March 10, 2008

$108 Crude Oil, $10.00 Natural Gas

Extreme Corn


Corn, after touching lock limit down at the beginning of the day, has rallied to within less than one cent of being lock limit up today. What a remarkable rally in the grains today. Even soybeans, while closing slightly down, has rallied back to close essentially flat for the day.

Soybeans Rally Back to Flat

Unstoppable Corn

Wheat Locks Limit UP


The Soybean: What's Not to Love?

How can you look at these charts for soybeans today and not love this little legume? Look at how smoothly those charts transition from buying to selling and back again. It just doesn't get much better than this! After various days of beans moving lock limit down, the volatility that has emerged today for corn and soybeans has been a very welcome sight. This is one of the reasons why I enjoy trading soybeans so much. Smooth trading with super liquidity makes soybean trading enjoyable and somewhat easier than other futures. The soybean is also a versatile food, since it is high in protein, low in fat (no cholesterol), highly nutritious, and can even be made into a fuel source (soybean oil). Long live the soybean!

Soybeans Sink Again


Traders have been unable to sustain gains in soybeans. Note in the charts I've posted today that soybean prices barely reached break-even, and then prices sold off again. Beans are still down for the day, even after a strong rally. This volatility today provides traders with superior conditions for trading.

Grain Explosion! The Glorious Grains Are Back!

Lead by wheat, the grains have now exploded higher, following the sell-off over the past few days. Commodities across the board today have surged higher on continued US Dollar weakness. This looks like a potent bottom for the grains.

Wheat

Corn

Soybeans

Resurrection Grains Trading


All the grains have now rebounded higher, and the bearishness appears to have now lifted. Even soybean prices have rebounded, recovering more than 30 cents from their lows early in the session. Wheat is even higher for the day, and corn briefly moved higher for the day. It's about time!

Crude Oil: New Record High at $107

Crude oil has reached a new record high over $107/barrrel this morning.

Wheat Weak, Soybeans Lock Limit Down

Global softening demand and good conditions for a strong soybean harvest in South America are continuing to suppress soybean prices, which have opened lock limit down this morning. "Traders continue to cite liquidation in soybeans and soybean oil as a key influence in generating weaker wheat prices," according the the Chicago Mercantile Exchange. However, wheat trading overnight showed soft volume, and trading has begun in a lackluster way. Corn is also soft, having just reached lock limit down moments ago, less than ten minutes into the trading session. Wheat, it appears, is the only game to play today, until the bottom is reached in soybean and corn trading.

Corn

Somebody Is Selling Gold

The price of gold is down for the last three days in a row, assuming it closes lower again today, as it is trading down again. Note also in the circled area of this chart, that the Klinger Volume indicator is signaling significant volume-based selling of gold. Note also that the price of gold has reversed and is contained within the trading range of the light blue trend lines that have contained gold prices since approximately late November 2007. I will be watching closely for signs of a consolidation or the emergence of fresh buying activity, which will most likely appear first on the Klinger Volume indicator.

This selling activity is somewhat surprising, given the continued devaluation of the US Dollar and promises of additional Fed easing. I suspect this is probably more likely a consolidation based upon fears of recessionary demand easing, rather than a strong phase of gold distribution. But that just a hunch, and nothing more. I recall that weeks ago, before the latest rise in gold prices, the Klinger indicator turned up before prices did. I would expect that perhaps the same circumstance would emerge again in the future.

Here is a Bloomberg article confirming my thoughts:

Gold, Silver Prices Fall

Beans Begin Trading Again


Soybeans have once again begin trading again, although prices are still very close the the lock limit price for the day.

Sunday, March 9, 2008

Soybeans: Lock Limit Down -- Day Two!


Soybeans, as I expected have locked limit down for a second consecutive day. However, the number of pending short contracts is relatively few, so I don't know if soybeans will remain lock limit down into the day trading session tomorrow. There are only about 1600 contracts pending at this hour Sunday evening, but the number is growing minute by minute, so over the next few hours, who can guess what will happen?

Corn is also down dramatically, but has not yet reached lock limit.