These charts for corn and crude oil are symbolic of what commodity prices are doing under the threat of a trade war.


These charts for corn and crude oil are symbolic of what commodity prices are doing under the threat of a trade war.

I was shocked this morning to see that the price of corn had dropped 10 cents. That's a huge drop!

Gas prices will soon begin to reflect the higher price of crude oil. We have now hit a higher price that the high hit in mid-May.

This isn't going to be good for the economy. Crude oil is up five of the past six days.

I was quite shocked at how sharply the price of crude oil climbed Friday. I understand that OPEC was unable to agree on production increases.

Bloomberg writer Richard Breslow this morning expressed a rather sanguine assessment of the current equity markets, despite price strength.

I was stunned when I saw this chart. After all that we've been told that the Federal Reserve has reduced its balance sheet and begun to normalize, this chart shows that it hasn't happened.

I'm looking forward to being able to take advantage of this drop in the price of corn.

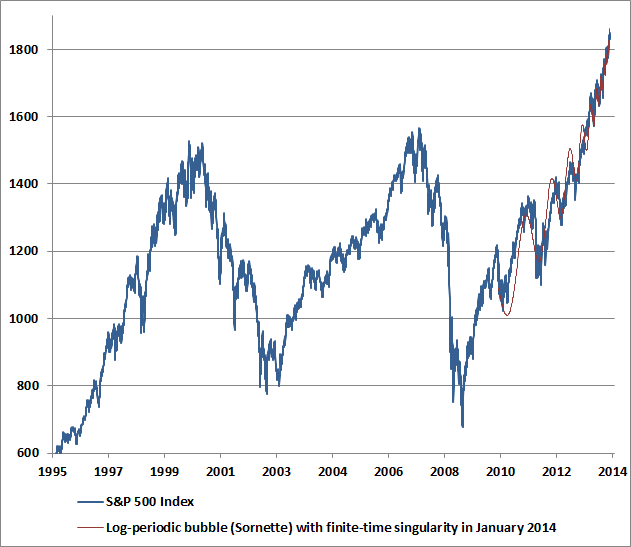
One of the signs of a maturing bubble that is showing froth and may be about to burst is that the really big money of professional investors runs for the exits. They see trouble ahead, and they quietly exit the markets so as to preserve their capital when the market collapses.

On May 24, the Russians and Saudis announced that they would soon increase oil production. Since then, the price of crude oil has reversed, and the price has declined significantly. And we have seen a more recent decline in the price of gasoline.

Once again, I find it interesting that the BLS announced that unemployment had reached an 18-year low of 3.8%. But at the same time, the BLS announced on the same day that the number of American adults not in the labor force hit a new all-time record high of 95.9 million! That's the highest in American history! Ouch!

Crude oil price rocketed more than $2 per barrel today. And this evening, it was up another 55 cents just minutes ago. We must prepare for even higher gasoline prices. Ouch!

This morning, I saw two articles on the same website. One indicates that we have hit a new record number of Social Security recipients in the United States:


The US today has 95.4 million American adults not in the workforce. That's about 40% of the adult population. That's more than the number of adults working and paying taxes! But the Bureau of Labor Statistics tells us that we have only 4.1% unemployment.
Screen capture from the BLS' own website:


This image of a margin-adjusted CAPE, provided by Hussman Funds, shows that stocks continue to reach new highs of excessive valuation.
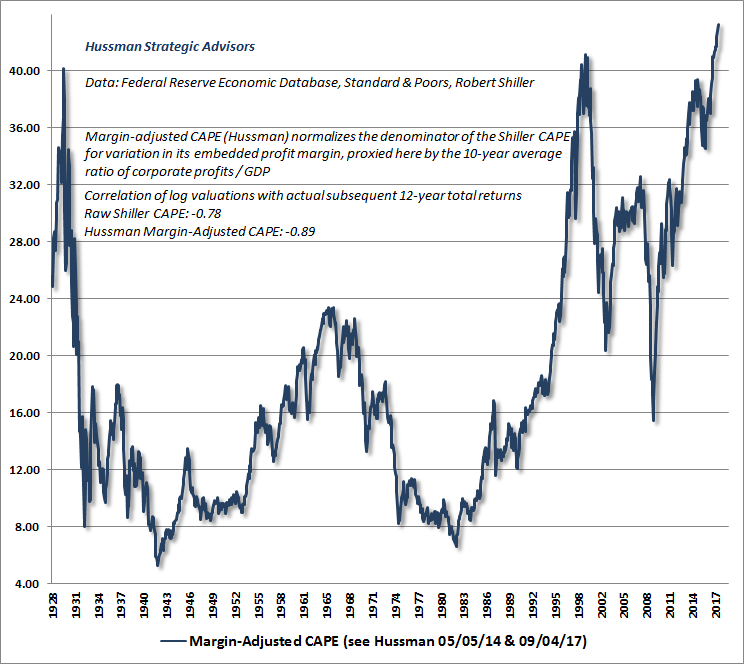
"Oh, but this time is different," they say. Nope! That language is actually an expression of a bubble mentality! It is, itself, proof of a bubble. And every bubble in history has ultimately burst. There has yet to be an exception. This one will too!


I'm amazed this morning that even with the plunging price of corn over the past two months, the price of corn is down sharply today also. Here is today's chart:


The Dow was down 251 points with just minutes left in the trading session today.

This headline from Marketwatch today sure smells like a classic bubble!

If you think today's stock market plunge was bad, imagine what would happen if war actually happened! We wiped out about a month's worth of gains today!

Corn prices today dropped below support to multi-month lows. These are the lowest prices of this year!


How long can this continue? There seems to be a dismissiveness on Wall St of the economic data, even as the S&P 500 continues near a new record high this morning. Even the Fed's own data is showing weakness! This divergence will eventually close, and when it does, history suggests that it will be UG-LY!


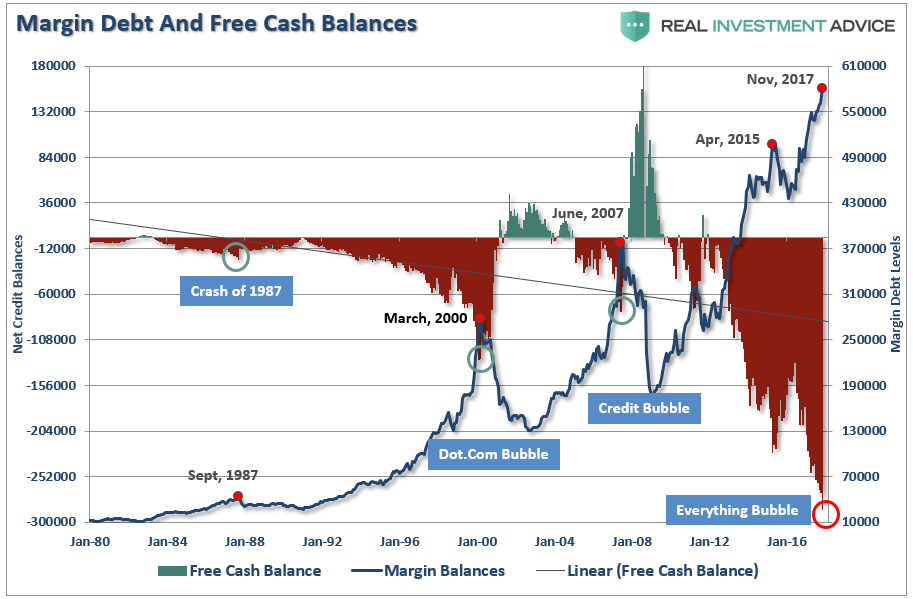
Margin debt suggests that the stock market has topped out. It is a reliable leading indicator that points at a subsequent decline on a consistent basis.
Mark Hulbert on Marketwatch said this morning that "...margin debt typically peaks in advance of the stock market itself. In
2007, for example, margin debt peaked in July, three months before the
bull market topping out in October. As Wolf Richter of the Wolf Street
investment blog bluntly put it: Margin debt “has a bone-chilling habit
of peaking right around the time stocks crash.”
A word to the wise is sufficient!
Nevertheless, stocks are higher today1 What a bubble!


"...Recessions are a normal condition to a market
economy as they are regulating any excess, bankrupting the weakest
players or those with the highest leverage. However, one of the
mandates of central banking is to fight a process
(business cycles) that occurs "naturally". The interference of
central banks such as the Federal Reserve appear to be exaggerating
the amplitude of bubbles and the manias that fuel them. It could be
argued that business cycles are being replaced by phases of booms
and busts, which are still displaying a cyclic behavior, but subject
to much more volatility. Although manias and bubbles have taken
place
many times before in history under very specific circumstances
(Tulip Mania, South Sea Company, Mississippi Company, etc.), central
banks appear to make matters worst by providing too much credit and
being unable or unwilling to stop the process with things are
getting out of control (massive borrowing). Instead of economic stability regulated by
market forces, monetary intervention creates long term instability
for the sake of short term stability."
--Professor Dr. Jean-Paul Rodrigue, Hofstra University

The outcome of years of yield-seeking speculation induced by central banks is that investors across the globe have now locked in zero prospective total returns in virtually in every asset class for the coming decade... We actually view this period as the extended top-formation of the third speculative bubble in the past 16 years, not as a representative sample of things to come. -- Dr. John Hussman, PhD, August 15, 2016