This is not unusual for the end of the year. I'm not trading with volume so paltry. Trading signals are unreliable and risky!
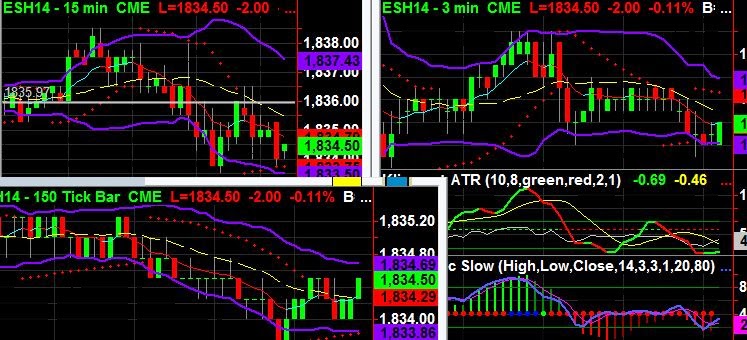

This is not unusual for the end of the year. I'm not trading with volume so paltry. Trading signals are unreliable and risky!

from Dr. John Hussman's market commentary earlier this week:

This from Dr. John Hussman:

Following is the text of an email I sent earlier today:
I hope you and your family had a great Christmas!
I read
several articles on the Kiyosaki website. I am a fan of Robert Kiyosaki,
and I've read 2-3 of his books (just not recently)! I like this quote
in particular from his website, written by Richard Duncan:
"The press has attributed the Fed’s decision to taper to an improvement
in the outlook for the economy. I don’t believe that is the correct
explanation. The recovery is still too weak and uncertain to justify
tapering on those grounds. In my opinion, the real reason is to prevent
excess liquidity from creating a new, destabilizing asset price bubble
in stocks and property."
But stocks continue the ramp-up into
record territory. The futures are higher today (Dec 26), and are set to
hit the 50th all-time record high this year -- again, if stocks remain
at these levels by the end of the day today. But the volume is razor
thin, even for holiday trading (thin trading is typical for holidays,
but this is exceptional even for a holiday)!
I also perused
Richard Duncan's economics website, and saved it. He's very sharp, in my
opinion. I then did some research on Mr. Duncan. He has been
interviewed numerous times in the media. He has also written some
best-selling books. I then remembered having seen him in a very lengthy
interview several months ago, which I found on Youtube and watched
again. He had just released his new book titled The New Depression in
early 2012. He said that due to excessive debt over the past several
decades to fuel domestic consumption, we have created bubble upon
bubble, and that bubble will eventually collapse in a depression that he
says will last for "generations" (HIS word, not mine).
I also
read some of the reviews of Mr. Duncan's book on Amazon.com. There were
two reviews that were extensive and were several pages long. You can
read them there if you want, but be forewarned that they were quite
lengthy! They were some of the most expansive reviews I've ever read on
Amazon. They must have taken hours to write. After reading them, I
decided that I didn't need to buy Duncan's book because I knew all the
salient points in them.
Two of the lengthier reviews critiqued
Duncan's proposed "solution" to our debt crisis. In the book, he
proposes that the US government borrow even MORE, go into even deeper
debt, and "invest" in advanced technologies in alternative energies,
nanotechnology, etc. He said that he believes that if the government
does this, it can ensure that the US "empire" will endure another
century. So his solution is even MORE government debt and government
programs in a bet that we can perpetuate our technology edge for the
next century. The lengthy reviews were skeptical, but fair.
Over
the past year, I've read at least five books that are dedicated, either
in whole or in part, to describing asset bubbles and their
characteristics. One of them was so arcane that I had to borrow it from
the BYU library, where it had only been checked out 3 previous times in
10 years. I've taken notes of some of the characteristics of what
constitutes bubbles. What we are seeing now in stocks manifests every
single characteristic of a bubble that I've read. Attached is a chart
that Dr. John Hussman published this week (the one with the white
background) . It shows the current stock market, and is literally a
textbook example of what an asset bubble looks like. In fact, in the
advanced stages of what he called a log-periodic Sornette-style bubble
(Swiss academic Didier Sornette was the author of the book I borrowed
from the BYU library, which I heard about from Hussman), the asset
bubble goes parabolic as investors not only increase their bets without
abandon, but they even go into DEBT to do it. Margin debt is now at
record levels, which Hussman also mentioned this week in his online
commentary on his website. Margin debt not only amplifies the gains on
the way up, but the losses to investors also amplify the speed of
decline on the way down. Crashes occur much faster than rallies for this
reason. Hussman reminds us that we have already seen TWO stock market
crashes in the past ten years (2003 and 2007-2008). But he also says
that stocks may increase an additional 5% before they crash again. That
would put the S&P 500 at about 1920. It's trading on my futures
charts at 1832 as I type this. We could reach 1920 over the next 90
days.

In Hussman's chart, note that as the asset bubble matures,
the asset goes increasingly parabolic -- straight up! There are no more
pull-backs or retracements whatsoever. Stocks, for example, have barely
looked back since mid-2012, since the fed began QE-Infinity! On his
chart, the red line is what a bubble historically looks like, and the
blue line is the current S&P 500. They are virtually identical!

On
my other chart that I've attached (black background), which is a screen
capture from my own (monthly) charts on my PC from one week ago (and
stocks have gone even higher since), you'll also see that stocks are no
longer even pulling back to the exponential moving average (light blue
line). They are even trading much of the time above the purple line,
which is the upper Bollinger Band, which represents two standard
deviations (a chance to use your statistics from biz school) outside the
norm. We're now close to THREE standard deviations!
I don't try
to forecast the future. I have a saying I made up: "Predicting the
future is for prophets, not profits". I don't know what the future
holds. I trade based upon what the charts and the market tell me, NOT
what prognosticators say. Prognosticators have a historically poor track
record! BUT -- I know a bubble when I see one. All it will take is
another "Lehman Bros moment" that triggers a sudden collapse in
confidence, and the next crash will ensue (John Mauldin wrote about this
extensively in his book Endgame). I have no idea what that trigger event
will be. But I am certain it will come. And the more euphoric Wall St
becomes, and the more they ignore the red flags, the more likely that
event will occur with immensely cataclysmic consequences.
One
small note: public sentiment (measured by "consumer confidence"
indicators), tends to mirror the stock market -- NOT vice versa! (see 2
Ne 28:21)
Interestingly, over the past few months, I've read
information from some of Pres. Obama's advisers that indicates that they
INTEND to bring "fiscal collapse" (their term, not mine) to the US
government. Remember "never let a crisis go to waste"? If you don't have
a crisis, you CREATE one! That reminds me of what the secret
combinations did in 3 Ne 7! I'll share with you those details next time
we have a chance to get together to chat.
The market just
opened, and I need to go. There is a new book out by John Mauldin,
called Code Red. I asked for the local library to get it so I can read
it. They said it will arrive after Jan 1st (new budget). Mauldin, after
being quite optimistic over the past few years, has suddenly turned
somewhat pessimistic over the course of 2013. I want to read his book to
learn why. His last book was about what he and others have termed "the
debt supercycle" which is coming to an end soon. Duncan also expressed
his worries about the same phenom. I use the term The Mother of All
Bubbles to refer to US government debt. When that bubble pops, we will
have a depression that Duncan says will likely last for DECADES, even
generations. That's his opinion! Wow!
One last thing and then I MUST go:
re: deflation
There
hasn't been broad-based deflation since the Fed was created. The dollar
has depreciated 98% since then. (By the way, the Fed's 100th
anniversary was Dec 23d -- the same day as Joseph Smith's birthday. One
was a great day in history, and the other was a day of infamy!) I'm
convinced that inflation is a better bet than deflation. We HAVE seen
some deflation, most notably in housing, but the deflation was from
BUBBLE levels. We all know that food and energy inflation are MORE
likely, not less. Notwithstanding the gas price deflation you mentioned,
the price of gas is still almost DOUBLE the price of gasoline when
Obama took office. For this time of year (there are seasonal aspects to
crude/gas prices), gas prices are unusually high.
Well, time to
go to work. Let's keep up the dialogue. I appreciate having someone with
your knowledge and background to palaver with.
Keep up the great work! I appreciate your example and ethic!
God bless!
Steve
Meanwhile, stocks are hitting fresh all-time record highs.
Holiday shopping is weak this year, but that doesn't appear to have dampened Wall St.'s euphoric love of stocks.


This
is the monthly chart of the current S&P 500 stock index. This is
literally a textbook case of what a bubble looks like. There are many
characteristics of a bubble, and I literally can't think of a single one
that this current market circumstance does NOT manifest.


Friday's relatively strong GDP reading sent stocks to new record highs, and Sunday evening, stocks set still another record.

Screw Lew! (To the censors, NO, that is NOT mature content!)
What an amazing resemblance. Can you distinguish between them?


...and all this, despite weaker data today! Just bubbly!


...even as stocks closed at new all-time record highs yesterday. Something is wrong with this picture! A great reset is coming! Stocks are barely in the red.
Here are the headlines this morning.


It's a "non-taper" taper!
Fed reveals that it will ease off it's debt monetization by $10 billion/month, but will continue low interest rates indefinitely. In some ways, this is even more dovish that previous statements were. Wall St is thrilled! The bubble builds!

This image from Yahoo Finance provides a good summary of today's market action on the eve of another Fed monetary policy statement tomorrow.


Nat gas is today's big mover.


China is causing worry!
Seeking Alpha explains today's strange market behavior:
"...the sell-off in S&P futures came on the heels of disappointing
China Manufacturing data. Almost in lock step, whether it was a nervous
trader or a more concerted effort, and in conjunction with the tensions
on the Street about the FOMC meeting, they reacted harshly to that China
data.
"Conversely, Europe had positive news on the same front, and
that is what allowed futures to recover, but the same major concern
still exists. The FOMC is clearly front and center, concerns about
tapering are on everyone's mind, and analysis al have an opinion. Some
think turmoil could lie ahead before the year's end, but I prefer to pay
attention to one simple thing, the technicals.
"The near and
midterm technicals told me to expect the bounce we are getting today,
but the longer term technicals tell me that the major markets, the
S&P 500 (SPY), Dow Jones Industrial Average (DIA), NASDAQ (QQQ), and Russell 2000 (IWM), have not yet tested longer term support."
And their assessment going forward:
"Therefore,
even with this nice bounce, our combined analysis warns us that it can
be short lived, and the market can turn lower and officially test longer
term support levels. Our rules tell us to short near resistance levels
and buy near support levels. That is therefore what we intend to do as
this year comes to an end."
BEATEN DOWN?
This shows the stock market today, with a tiny little red "candlestick"
showing the month of December at the top right. I have highlighted it
with a yellow arrow. It would be hard to see it at all if I didn't. Does
that look "beaten down" to you? That tiny little red mark, if I had
left all the technical indicators on the chart (I removed them so that
this "beaten down" red mark could be seen more easily), would be close
to the upper Bollinger Band, which indicates two statistical standard
deviations outside of normal market activity.
 |
| I'm still struggling to find that "beaten down" part on this chart. |
This is a classic characteristic of a Fed-induced bubble. The Fed's own Empire State Index fell short of expectations, but stocks leaped higher on the news. Stocks left bad news in Asian markets in their tracks, and used some good news in Europe to leap higher still. Now, this news is sending stocks into the rafters in expectation that the Fed is less likely to reduce its debt monetization scheme on Wednesday. When all news is perceived as good news, and no news introduces thoughts of risk, then all news leads to higher prices. When all thought of proper pricing is discarded, and even the slightest dip sends investors scrambling to buy more, this is textbook bubble mentality! The Dow is up more than 130 points in just the first hour of trading!


Strange phenomenon, suggests how fragile and overbullish these market really are!

This occurred without much news. Someone wanted to exit in a hurry!


 | |
| Running for the exits before end of 2013 |
 | |
| More taper rumors. Is this the beginning of another taper tantrum? |
 | |
| The beginning of a taper tantrum? |
Isn't "easing spending cuts", as shown in this Bloomberg headline this morning, just another way of saying that they are going to spend MORE? Why the parsing of words? Why the games of semantics, just to tell us that they're kicking the can down the road again?


Is this the reason stocks are showing weakness again, just two days after a 200-point Dow rally? There are more and more voices, even on Wall St, calling for the Fed to begin tapering it's debt monetization scheme at the Fed's meeting next week.

Stocks
came to within a hair's breadth of another new all-time record high
yesterday and throughout the night, but what Wall St seems to be
shrugging off is that the recent stronger-than-expected GDP contains a
real devil in the details. The recent GDP growth has been based all on
inventory builds.
"...of the $534 billion rise in nominal GDP in
the past year, a whopping 56% of this is due to nothing else but
inventory hoarding.
"The problem with inventory hoarding,
however, is that at some point it will have to be "unhoarded." Which is
why expect many downward revisions to future GDP as this inventory
overhang has to be destocked."
And when that "destocking" takes
place in future quarters, it must be accomplished with REDUCED profit
margins and REDUCED payroll. This means that we are robbing the future's
GDP Peter, to pay today's GDP Paul. In other words, unless the American
people suddenly find a strong and compelling urge to buy, buy, BUY,
future quarters will be weak and there will be lay-offs in jobs.
So that dirty little devil in those GDP details forebodes disappointment ahead.
What's
worse, economists over the past few days have now assessed that last
Friday's surge in consumer confidence wasn't really an IMPROVEMENT at
all. It was just a return to a more normal level following the the
temporary shutting down of part of the government in October. It wasn't a
surge in sentiment. It was just a return to the same level of malaise
that has dominated for the past few years.
And there is a
growing cacophony of voices -- even on Wall St -- calling for the Fed to
begin tapering its debt monetization scheme NOW! The Fed board meets
next Tues and Wed, and will release a policy statement at the end of
their Wed meeting.
No more worries of a taper? Friday's jobs report was calculated to be just high enough to suggest growth, but not enough for the Fed to begin a taper of asset purchases.




